This report was developed for our partners at Brookings Mountain West; the original version was published on their site on August 9, 2021.
Contents
- Individual factors and local housing market conditions influence homelessness
- The size and composition of homeless populations varied over time and metro areas
- To prevent rising homelessness, policymakers should quickly provide more support to low-income renters
Over the past year, job losses from the COVID-19 pandemic have exacerbated housing insecurity among low-income renters. As of January 2021, nearly one in four of the nation’s 43 million renter households reported having missed at least one rent payment during the pandemic.
To prevent widespread displacement that could increase public health risks, federal, state, and local policymakers have used a variety of tools to help families stay in their homes. Direct financial support, such as unemployment insurance, and emergency rent relief funds allowed many renters to catch up on back rent. A nationwide eviction moratorium limited landlords from evicting tenants for nonpayment of rent (although the moratorium has been unevenly enforced).
But these measures are temporary, intended as stopgaps until the public health threat recedes and the economy recovers. This raises the question: What will happen to low-income renters when these policies end? Will there be a surge of people displaced from their homes? And where will they go?
To gain some insight into how homelessness changes over macroeconomic cycles, we examine changes in homelessness rates from 2007 to 2020. Our analysis focuses on four metro areas that were particularly hard-hit by the 2007 foreclosure crisis: Las Vegas, Los Angeles, Phoenix, and Riverside, Calif. Using data collected by the Department of Housing and Urban Development’s (HUD) annual Point-in-Time (PIT) survey, we look at changes over time in homelessness rates, the share of family homelessness, and the percentage of unsheltered homeless persons.1 We find that homelessness rates declined over time in three of the four metros (Los Angeles saw an increase), but the share of unsheltered homelessness has been rising in recent years.
Individual factors and local housing market conditions influence homelessness
People are more likely to experience housing instability, displacement, and homelessness following a shock to their economic or personal circumstances, such as job loss, divorce, or severe illness.
There are various ways people can adjust their housing situation after income losses. Households often cut back spending, spend down their savings, or run up credit card debt. When those resources run out, households facing immediate risk of eviction often “double-up,” moving in temporarily with family or friends. (Concerns over the public health risk of crowded housing was a primary reason the Centers for Disease Control and Prevention imposed the national eviction moratorium in October 2020.) Even without the COVID-19 pandemic, households living in crowded housing (more than two persons per bedroom) face higher physical and mental health risks.
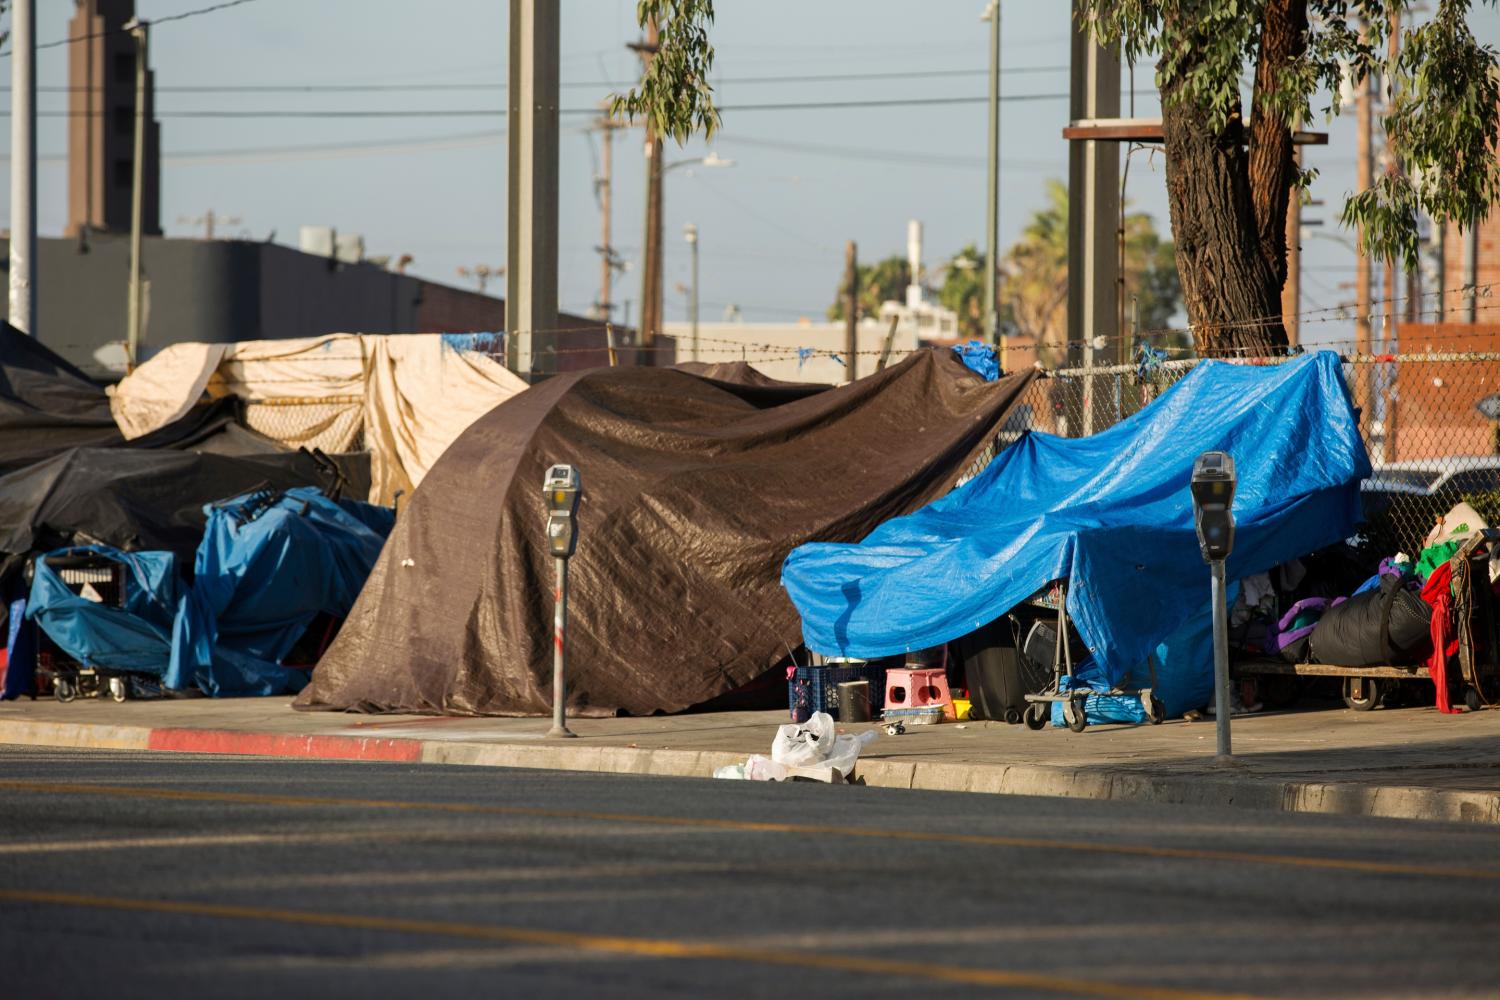
In the worse-case outcomes, families who have lost income and exhausted their resources may become homeless—living in temporary shelters, staying in cars or abandoned buildings, or sleeping unsheltered on streets and public spaces.
Local and regional housing market conditions also influence the prevalence of homelessness within communities. Places where housing is expensive and the supply of rental homes is tight tend to have more people experiencing homelessness. Research has shown that homelessness is higher in metro areas with higher median rents, higher shares of rental housing, and higher percentages of single-person homes. These local economic conditions are more strongly correlated with family homelessness than individual homelessness.
Broader economic conditions matter as well. Some studies have also found that income inequality and poverty are positively correlated with homelessness. Other factors, such as a place’s climate and federal funding for homelessness, have been shown to be predictive of sheltered homelessness in particular.
Rising homelessness can harm entire communities, not just the persons experiencing homelessness. It increases financial and staffing demands on local governments and nonprofit organizations who manage shelters and provide food assistance and other social services. Children whose families are homeless struggle in school, which can have long-term consequences for their education and career. In short, rehousing people after they become homeless is far more expensive—in human and financial terms—than keeping them housed in the first place.
The size and composition of homeless populations varied over time and metro areas
In our analysis, Las Vegas and Los Angeles had persistently higher rates of homelessness than Phoenix and Riverside during the 2007 to 2020 period. Time trends vary widely across the four metro areas, and are not obviously correlated with the impact of the Great Recession and subsequent recovery.
Las Vegas shows the closest tracking of regional economic trends. Homelessness rose from 2008 to 2010—the period corresponding to the sharpest decline in housing prices due to foreclosures—then declined in all subsequent years. By contrast, homelessness in Los Angeles declined until about 2012, before increasing in the second half of the period, as the regional economy strengthened. Phoenix and Riverside saw mostly declining homelessness rates over this time, starting from a much lower base.

The composition of homeless populations varies across the four metro areas. Roughly one-third of persons experiencing homelessness in Phoenix belong to families (specifically, families with children). Las Vegas has the lowest share of family homelessness: around 10%. Family homelessness poses particular challenges for local governments (including schools) and service providers. Emergency shelters generally separate single adults from families with children, who require different supportive services.

In Los Angeles and Riverside, nearly three-quarters of the homeless population was unsheltered. For the point-in-time counts, HUD defines “sheltered” homeless as people living in emergency shelters or transitional housing, both of which are intended as short-term housing. Unsheltered homeless persons—including those living in cars or RVs—are generally at higher risk from severe weather, including extreme heat, especially in Southwestern areas like Las Vegas and Phoenix.
Los Angeles’ moderate climate likely explains some of its higher rate of unsheltered homeless. Phoenix’s low share may also reflect the higher percentage of homeless families, who are more likely than single adults to be placed in emergency shelters. A concerning trend is that all four metro areas show increases in the share of unsheltered homeless in the latter years of the period.

To prevent rising homelessness, policymakers should quickly provide more support to low-income renters
The COVID-19 pandemic’s impacts on housing markets are not directly parallel to the impacts of the Great Recession. Crucially, while the Great Recession was triggered by a massive wave of foreclosures among owner-occupied homes, then spilled over into rental markets, job losses in the pandemic have hit renter households far harder than homeowners. Because renters earn lower incomes and have less wealth than homeowners, job losses concentrated among renters are more likely to translate into increased housing insecurity, doubling-up, and potentially greater homelessness. Based on past research, we would expect the largest increases in places with expensive housing, limited availability of rental housing, and where COVID-19 has hit jobs the hardest—metro areas like Los Angeles and Las Vegas.
Policymakers trying to address housing insecurity are hampered by inadequate real-time data on housing distress. Weekly unemployment filings have been useful in following the pandemic’s impacts on labor markets, advising when and where to target additional resources. But we have no equivalent frequently reported measure of housing distress, especially for tracking the well-being of renter households.
It is also important to note that homelessness is a lagging indicator of housing distress. Just as becoming homeless is an outcome of last resort for individuals, increased housing instability will take some time to show up in city-level homelessness rates. By the time the PIT data shows an increase in homelessness, long-term damage to households’ financial, social, and physical well-being will already have been done.
Local and state governments have variety of tools to prevent people from becoming homeless—but also varying capacity in approaching the problem. The federal government has allocated an unprecedented amount of money that could be used to support low-income renters, from emergency rent relief to flexible funding for state and local governments. But to date, bureaucratic hurdles have gotten in the way of distributing funds to renters and landlords. Some large cities already had rent relief programs they could build on, but many communities had to create programs from scratch.
If ever there was a time to give poor renters money quickly, without requiring them to jump through bureaucratic hoops, now is that time. Failing to get in front of the problem will have severe consequences for impacted households and for larger communities.
-
Footnotes
- HUD’s PIT homelessness counts are collected by local governments every year on a single night in January. HUD’s methodology notes that these surveys often undercount sheltered homeless individuals. The PIT does not attempt to count people who are temporarily staying with other households, so it understates the full extent of people who lack long-term stable housing. Nonetheless, the PIT is an important and widely cited source for measuring housing insecurity. American Community Survey (ACS) population data is used to normalize homelessness counts across metro areas. We construct three-year rolling averages to smooth out year-by-year noise and illustrate longer-term trends.
The Brookings Institution is committed to quality, independence, and impact.
We are supported by a diverse array of funders. In line with our values and policies, each Brookings publication represents the sole views of its author(s).


