

Part I of the 2015 Brown Center Report on American Education.

Girls score higher than boys on tests of reading ability. They have for a long time. This section of the Brown Center Report assesses where the gender gap stands today and examines trends over the past several decades. The analysis also extends beyond the U.S. and shows that boys’ reading achievement lags that of girls in every country in the world on international assessments. The international dimension—recognizing that U.S. is not alone in this phenomenon—serves as a catalyst to discuss why the gender gap exists and whether it extends into adulthood.
Background
One of the earliest large-scale studies on gender differences in reading, conducted in Iowa in 1942, found that girls in both elementary and high schools were better than boys at reading comprehension.[i] The most recent results from reading tests of the National Assessment of Educational Progress (NAEP) show girls outscoring boys at every grade level and age examined. Gender differences in reading are not confined to the United States. Among younger children—age nine to ten, or about fourth grade—girls consistently outscore boys on international assessments, from a pioneering study of reading comprehension conducted in fifteen countries in the 1970s, to the results of the Program in International Reading Literacy Study (PIRLS) conducted in forty-nine nations and nine benchmarking entities in 2011. The same is true for students in high school. On the 2012 reading literacy test of the Program for International Student Assessment (PISA), worldwide gender gaps are evident between fifteen-year-old males and females.
As the 21st century dawned, the gender gap came under the scrutiny of reporters and pundits. Author Christina Hoff Sommers added a political dimension to the gender gap, and some say swept the topic into the culture wars raging at the time, with her 2000 book The War Against Boys: How Misguided Feminism is Harming Our Young Men.[ii] Sommers argued that boys’ academic inferiority, and in particular their struggles with reading, stemmed from the feminist movement’s impact on schools and society. In the second edition, published in 2013, she changed the subtitle to How Misguided Policies Are Harming Our Young Men. Some of the sting is removed from the indictment of “misguided feminism.” But not all of it. Sommers singles out for criticism a 2008 report from the American Association of University Women.[iii] That report sought to debunk the notion that boys fared poorly in school compared to girls. It left out a serious discussion of boys’ inferior performance on reading tests, as well as their lower grade point averages, greater rate of school suspension and expulsion, and lower rate of acceptance into college.
Journalist Richard Whitmire picked up the argument about the gender gap in 2010 with Why Boys Fail: Saving Our Sons from an Educational System That’s Leaving Them Behind.[iv] Whitmire sought to separate boys’ academic problems from the culture wars, noting that the gender gap in literacy is a worldwide phenomenon and appears even in countries where feminist movements are weak to nonexistent. Whitmire offers several reasons for boys’ low reading scores, including poor reading instruction (particularly a lack of focus on phonics), and too few books appealing to boys’ interests. He also dismisses several explanations that are in circulation, among them, video games, hip-hop culture, too much testing, and feminized classrooms. As with Sommers’s book, Whitmire’s culprit can be found in the subtitle: the educational system. Even if the educational system is not the original source of the problem, Whitmire argues, schools could be doing more to address it.
In a 2006 monograph, education policy researcher Sara Mead took on the idea that American boys were being shortchanged by schools. After reviewing achievement data from NAEP and other tests, Mead concluded that the real story of the gender gap wasn’t one of failure at all. Boys and girls were both making solid academic progress, but in some cases, girls were making larger gains, misleading some commentators into concluding that boys were being left behind. Mead concluded, “The current boy crisis hype and the debate around it are based more on hopes and fears than on evidence.”[v]
Explanations for the Gender Gap
The analysis below focuses on where the gender gap in reading stands today, not its causes. Nevertheless, readers should keep in mind the three most prominent explanations for the gap. They will be used to frame the concluding discussion.
Biological/Developmental: Even before attending school, young boys evidence more problems in learning how to read than girls. This explanation believes the sexes are hard-wired differently for literacy.
School Practices: Boys are inferior to girls on several school measures—behavioral, social, and academic—and those discrepancies extend all the way through college. This explanation believes that even if schools do not create the gap, they certainly don’t do what they could to ameliorate it.
Cultural Influences: Cultural influences steer boys toward non-literary activities (sports, music) and define literacy as a feminine characteristic. This explanation believes cultural cues and strong role models could help close the gap by portraying reading as a masculine activity.
The U.S. Gender Gap in Reading
Table 1-1 displays the most recent data from eight national tests of U.S. achievement. The first group shows results from the National Assessment of Educational Progress Long Term Trend (NAEP-LTT), given to students nine, 13, and 17 years of age. The NAEP-LTT in reading was first administered in 1971. The second group of results is from the NAEP Main Assessment, which began testing reading achievement in 1992. It assesses at three different grade levels: fourth, eighth, and twelfth. The last two tests are international assessments in which the U.S. participates, the Progress in International Reading Literacy Study (PIRLS), which began in 2001, and the Program for International Student Assessment (PISA), first given in 2000. PIRLS tests fourth graders, and PISA tests 15-year-olds. In the U.S., 71 percent of students who took PISA in the fall of 2012 were in tenth grade.
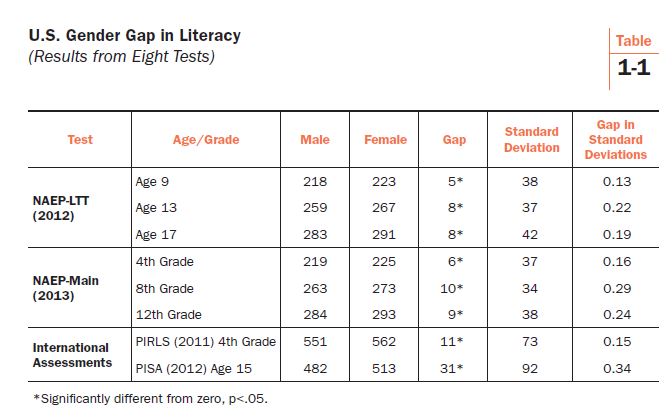
Two findings leap out. First, the test score gaps between males and females are statistically significant on all eight assessments. Because the sample sizes of the assessments are quite large, statistical significance does not necessarily mean that the gaps are of practical significance—or even noticeable if one observed several students reading together. The tests also employ different scales. The final column in the table expresses the gaps in standard deviation units, a measure that allows for comparing the different scores and estimating their practical meaningfulness.
The second finding is based on the standardized gaps (expressed in SDs). On both NAEP tests, the gaps are narrower among elementary students and wider among middle and high school students. That pattern also appears on international assessments. The gap is twice as large on PISA as on PIRLS.[vi] A popular explanation for the gender gap involves the different maturation rates of boys and girls. That theory will be discussed in greater detail below, but at this point in the analysis, let’s simply note that the gender gap appears to grow until early adolescence—age 13 on the LTT-NAEP and grade eight on the NAEP Main.
Should these gaps be considered small or large? Many analysts consider 10 scale score points on NAEP equal to about a year of learning. In that light, gaps of five to 10 points appear substantial. But compared to other test score gaps on NAEP, the gender gap is modest in size. On the 2012 LTT-NAEP for nine-year-olds, the five point gap between boys and girls is about one-half of the 10 point gap between students living in cities and those living in suburbs.[vii] The gap between students who are eligible for free and reduced lunch and those who are not is 28 points; between black and white students, it is 23 points; and between English language learners (ELL) and non-ELL students, it is 34 points.
Table 1-1 only shows the size of the gender gap as gauged by assessments at single points in time. For determining trends, let’s take a closer look at the LTT-NAEP, since it provides the longest running record of the gender gap. In Table 1-2, scores are displayed from tests administered since 1971 and given nearest to the starts and ends of decades. Results from 2008 and 2012 are both shown to provide readers an idea of recent fluctuations. At all three ages, gender gaps were larger in 1971 than they are today. The change at age nine is statistically significant, but not at age 13 (p=0.10) or age 17 (p=.07), although they are close. Slight shrinkage occurred in the 1980s, but the gaps expanded again in the 1990s. The gap at age 13 actually peaked at 15 scale score points in 1994 (not shown in the table), and the decline since then is statistically significant. Similarly, the gap at age 17 peaked in 1996 at 15 scale score points, and the decline since then is also statistically significant. More recently, the gap at age nine began to shrink again in 1999, age 13 began shrinking in the 2000s, and age 17 in 2012.
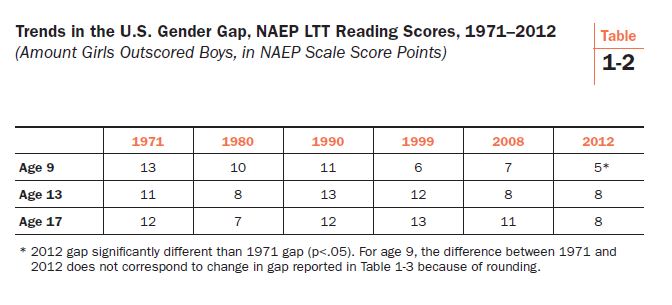
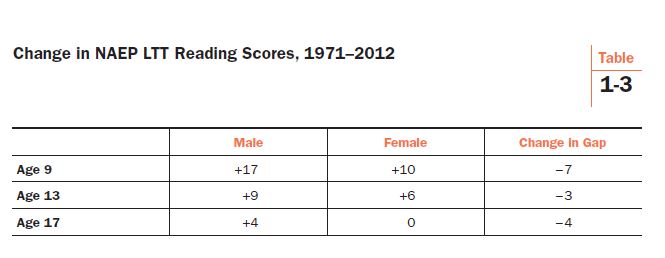
Table 1-3 decomposes the change figures by male and female performance. Sara Mead’s point, that the NAEP story is one of both sexes gaining rather than boys falling behind, is even truer today than when she made it in 2006. When Mead’s analysis was published, the most recent LTT-NAEP data were from 2004. Up until then, girls had made greater reading gains than boys. But that situation has reversed. Boys have now made larger gains over the history of LTT-NAEP, fueled by the gains that they registered from 2004 to 2012. The score for 17-year-old females in 2012 (291) was identical to their score in 1971.
International Perspective
The United States is not alone in reading’s gender gap. Its gap of 31 points is not even the largest (see Figure 1-1). On the 2012 PISA, all OECD countries exhibited a gender gap, with females outscoring males by 23 to 62 points on the PISA scale (standard deviation of 94). On average in the OECD, girls outscored boys by 38 points (rounded to 515 for girls and 478 for boys). The U.S. gap of 31 points is less than the OECD average.
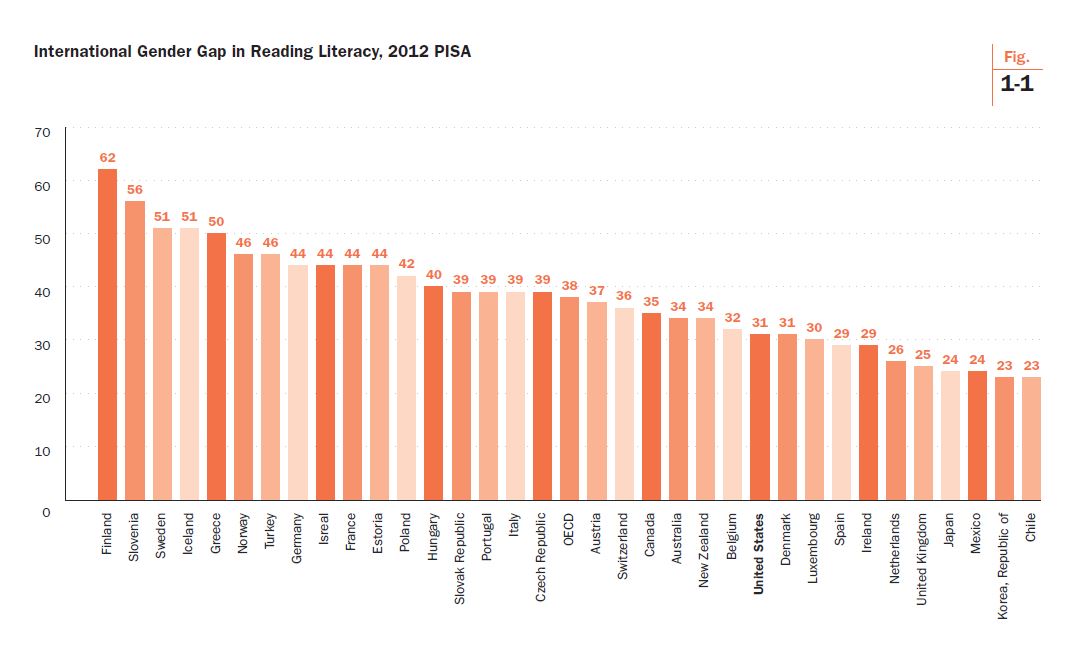
Finland had the largest gender gap on the 2012 PISA, twice that of the U.S., with females outscoring males by an astonishing 62 points (0.66 SDs). Finnish girls scored 556, and boys scored 494. To put this gap in perspective, consider that Finland’s renowned superiority on PISA tests is completely dependent on Finnish girls. Finland’s boys’ score of 494 is about the same as the international average of 496, and not much above the OECD average for males (478). The reading performance of Finnish boys is not statistically significantly different from boys in the U.S. (482) or from the average U.S. student, both boys and girls (498). Finnish superiority in reading only exists among females.
There is a hint of a geographical pattern. Northern European countries tend to have larger gender gaps in reading. Finland, Sweden, Iceland, and Norway have four of the six largest gaps. Denmark is the exception with a 31 point gap, below the OECD average. And two Asian OECD members have small gender gaps. Japan’s gap of 24 points and South Korea’s gap of 23 are ranked among the bottom four countries. The Nordic tendency toward large gender gaps in reading was noted in a 2002 analysis of the 2000 PISA results.[viii] At that time, too, Denmark was the exception. Because of the larger sample and persistence over time, the Nordic pattern warrants more confidence than the one in the two Asian countries.
Back to Finland. That’s the headline story here, and it contains a lesson for cautiously interpreting international test scores. Consider that the 62 point gender gap in Finland is only 14 points smaller than the U.S. black-white gap (76 points) and 21 points larger than the white-Hispanic gap (41 points) on the same test. Finland’s gender gap illustrates the superficiality of much of the commentary on that country’s PISA performance. A common procedure in policy analysis is to consider how policies differentially affect diverse social groups. Think of all the commentators who cite Finland to promote particular policies, whether the policies address teacher recruitment, amount of homework, curriculum standards, the role of play in children’s learning, school accountability, or high stakes assessments.[ix] Advocates pound the table while arguing that these policies are obviously beneficial. “Just look at Finland,” they say. Have you ever read a warning that even if those policies contribute to Finland’s high PISA scores—which the advocates assume but serious policy scholars know to be unproven—the policies also may be having a negative effect on the 50 percent of Finland’s school population that happens to be male?
Would Getting Boys to Enjoy Reading More Help Close the Gap?
One of the solutions put forth for improving boys’ reading scores is to make an effort to boost their enjoyment of reading. That certainly makes sense, but past scores of national reading and math performance have consistently, and counterintuitively, shown no relationship (or even an inverse one) with enjoyment of the two subjects. PISA asks students how much they enjoy reading, so let’s now investigate whether fluctuations in PISA scores are at all correlated with how much 15-year-olds say they like to read.
The analysis below employs what is known as a “differences-in-differences” analytical strategy. In both 2000 and 2009, PISA measured students’ reading ability and asked them several questions about how much they like to read. An enjoyment index was created from the latter set of questions.[x] Females score much higher on this index than boys. Many commentators believe that girls’ greater enjoyment of reading may be at the root of the gender gap in literacy.
When new international test scores are released, analysts are tempted to just look at variables exhibiting strong correlations with achievement (such as amount of time spent on homework), and embrace them as potential causes of high achievement. But cross-sectional correlations can be deceptive. The direction of causality cannot be determined, whether it’s doing a lot of homework that leads to high achievement, or simply that good students tend to take classes that assign more homework. Correlations in cross-sectional data are also vulnerable to unobserved factors that may influence achievement. For example, if cultural predilections drive a country’s exemplary performance, their influence will be masked or spuriously assigned to other variables unless they are specifically modeled.[xi] Class size, between-school tracking, and time spent on learning are all topics on which differences-in-differences has been fruitfully employed to analyze multiple cross-sections of international data.
Another benefit of differences-in-differences is that it measures statistical relationships longitudinally. Table 1-4 investigates the question: Is the rise and fall of reading enjoyment correlated with changes in reading achievement? Many believe that if boys liked reading more, their literacy test scores would surely increase. Table 1-4 does not support that belief. Data are available for 27 OECD countries, and they are ranked by how much they boosted males’ enjoyment of reading. The index is set at the student-level with a mean of 0.00 and standard deviation of 1.00. For the twenty-seven nations in Table 1-4, the mean national change in enjoyment is -.02 with a standard deviation of .09.
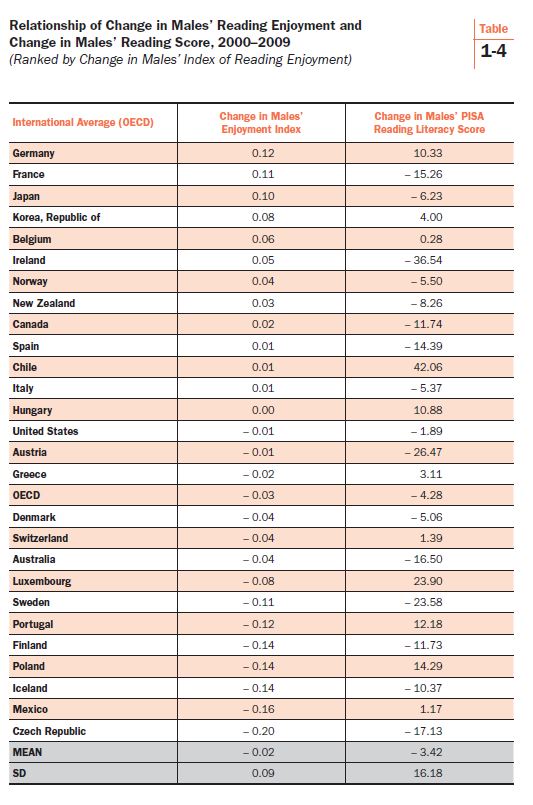
Germany did the best job of raising boys’ enjoyment of reading, with a gain of 0.12 on the index. German males’ PISA scores also went up—a little more than 10 points (10.33). France, on the other hand, raised males’ enjoyment of reading nearly as much as Germany (0.11), but French males’ PISA scores declined by 15.26 points. A bit further down the column, Ireland managed to get boys to enjoy reading a little more (a gain of 0.05) but their reading performance fell a whopping 36.54 points. Toward the bottom end of the list, Poland’s boys enjoyed reading less in 2009 than in 2000, a decline of 0.14 on the index, but over the same time span, their reading literacy scores increased by more than 14 points (14.29). Among the countries in which the relationship goes in the expected direction is Finland. Finnish males’ enjoyment of reading declined (-0.14) as did their PISA scores in reading literacy (-11.73). Overall, the correlation coefficient for change in enjoyment and change in reading score is -0.01, indicating no relationship between the two.
Christina Hoff Sommers and Richard Whitmire have praised specific countries for first recognizing and then addressing the gender gap in reading. Recently, Sommers urged the U.S. to “follow the example of the British, Canadians, and Australians.”[xii] Whitmire described Australia as “years ahead of the U.S. in pioneering solutions” to the gender gap. Let’s see how those countries appear in Table 1-4. England does not have PISA data for the 2000 baseline year, but both Canada and Australia are included. Canada raised boys’ enjoyment of reading a little bit (0.02) but Canadian males’ scores fell by about 12 points (-11.74). Australia suffered a decline in boys’ enjoyment of reading (-0.04) and achievement (-16.50). As promising as these countries’ efforts may have appeared a few years ago, so far at least, they have not borne fruit in raising boys’ reading performance on PISA.
Achievement gaps are tricky because it is possible for the test scores of the two groups being compared to both decline while the gap increases or, conversely, for scores of both to increase while the gap declines. Table 1-4 only looks at males’ enjoyment of reading and its relationship to achievement. A separate differences-in-differences analysis was conducted (but not displayed here) to see whether changes in the enjoyment gap—the difference between boys’ and girls’ enjoyment of reading—are related to changes in reading achievement. They are not (correlation coefficient of 0.08). National PISA data simply do not support the hypothesis that the superior reading performance of girls is related to the fact that girls enjoy reading more than boys.
Discussion
Let’s summarize the main findings of the analysis above. Reading scores for girls exceed those for boys on eight recent assessments of U.S. reading achievement. The gender gap is larger for middle and high school students than for students in elementary school. The gap was apparent on the earliest NAEP tests in the 1970s and has shown some signs of narrowing in the past decade. International tests reveal that the gender gap is worldwide. Among OECD countries, it even appears among countries known for superior performance on PISA’s reading test. Finland not only exhibited the largest gender gap in reading on the 2012 PISA, the gap had widened since 2000. A popular recommendation for boosting boys’ reading performance is finding ways for them to enjoy reading more. That theory is not supported by PISA data. Countries that succeeded in raising boys’ enjoyment of reading from 2000 to 2009 were no more likely to improve boys’ reading performance than countries where boys’ enjoyment of reading declined.
The origins of the gender gap are hotly debated. The universality of the gap certainly supports the argument that it originates in biological or developmental differences between the two sexes. It is evident among students of different ages in data collected at different points in time. It exists across the globe, in countries with different educational systems, different popular cultures, different child rearing practices, and different conceptions of gender roles. Moreover, the greater prevalence of reading impairment among young boys—a ratio of two or three to one—suggests an endemic difficulty that exists before the influence of schools or culture can take hold.[xiii]
But some of the data examined above also argue against the developmental explanation. The gap has been shrinking on NAEP. At age nine, it is less than half of what it was forty years ago. Biology doesn’t change that fast. Gender gaps in math and science, which were apparent in achievement data for a long time, have all but disappeared, especially once course taking is controlled. The reading gap also seems to evaporate by adulthood. On an international assessment of adults conducted in 2012, reading scores for men and women were statistically indistinguishable up to age 35—even in Finland and the United States. After age 35, men had statistically significantly higher scores in reading, all the way to the oldest group, age 55 and older. If the gender gap in literacy is indeed shaped by developmental factors, it may be important for our understanding of the phenomenon to scrutinize periods of the life cycle beyond the age of schooling.
Another astonishing pattern emerged from the study of adult reading. Participants were asked how often they read a book. Of avid book readers (those who said they read a book once a week) in the youngest group (age 24 and younger), 59 percent were women and 41 percent were men. By age 55, avid book readers were even more likely to be women, by a margin of 63 percent to 37 percent. Two-thirds of respondents who said they never read books were men. Women remained the more enthusiastic readers even as the test scores of men caught up with those of women and surpassed them.
A few years ago, Ian McEwan, the celebrated English novelist, decided to reduce the size of the library in his London townhouse. He and his younger son selected thirty novels and took them to a local park. They offered the books to passers-by. Women were eager and grateful to take the books, McEwan reports. Not a single man accepted. The author’s conclusion? “When women stop reading, the novel will be dead.”[xiv]
McEwan might be right, regardless of the origins of the gender gap in reading and the efforts to end it.
[i] J.B. Stroud and E.F. Lindquist, “Sex differences in achievement in the elementary and secondary schools,” Journal of Educational Psychology, vol. 33(9) (Washington, D.C.: American Psychological Association, 1942), 657-667.
[ii] Christina Hoff Sommers, The War Against Boys: How Misguided Feminism Is Harming Our Young Men (New York, NY: Simon & Schuster, 2000).
[iii] Christianne Corbett, Catherine Hill, and Andresse St. Rose, Where the Girls Are: The Facts About Gender Equity in Education (Washington, D.C.: American Association of University Women, 2008).
[iv] Richard Whitmire, Why Boys Fail: Saving Our Sons from an Educational System That’s Leaving Them Behind (New York, NY: AMACOM, 2010).
[v] Sara Mead, The Evidence Suggests Otherwise: The Truth About Boys and Girls (Washington, D.C.: Education Sector, 2006).
[vi] PIRLS and PISA assess different reading skills. Performance on the two tests may not be comparable.
[vii] NAEP categories were aggregated to calculate the city/suburb difference.
[viii] OECD, Reading for Change: Performance and Engagement Across Countries (Paris: OECD, 2002), 125.
[ix] The best example of promoting Finnish education policies is Pasi Sahlberg’s Finnish Lessons: What Can the World Learn from Educational Change in Finland? (New York: Teachers College Press, 2011).
[x] The 2009 endpoint was selected because 2012 data for the enjoyment index were not available on the NCES PISA data tool.
[xi] A formal name for the problem of reverse causality is endogeneity and for the problem of unobserved variables, omitted variable bias.
[xii] Christina Hoff Sommers, “The Boys at the Back,” New York Times, February 2, 2013; Richard Whitmire, Why Boys Fail (New York: AMACOM, 2010), 153.
[xiii] J.L. Hawke, R.K. Olson, E.G. Willcutt, S.J. Wadsworth, & J.C. DeFries, “Gender ratios for reading difficulties,” Dyslexia 15(3), (Chichester, England: Wiley, 2009), 239–242.
[xiv] Daniel Zalewski, “The Background Hum: Ian McEwan’s art of unease,” The New Yorker, February 23, 2009.
| Part II: Measuring Effects of the Common Core » |