The desire to secure and sustain a middle-class standard of living is virtually universal. But the opportunity to do so is not. In some cities, the middle class is thriving, and low-income children are rising up to join its ranks. In others, the middle class is sliding (even shrinking, on some measures), and upward mobility rates are low.
We focus on the middle class in Las Vegas in a new paper published as part of our partnership with the University of Nevada, Las Vegas. Our analysis of the middle-class at the metro level, and the “middle-class-making” capacity of local colleges, has broader applicability beyond just the Las Vegas metro area, however. In particular, we argue that the strength of the middle class should be measured by a “quality of life” measure rather than a “size” measure; we introduce a new metric to assess the extent to which colleges are helping students attain or sustain a middle-class standard of living that may have value for other regions as well.
The Las Vegas middle class: hit hard, still bruised
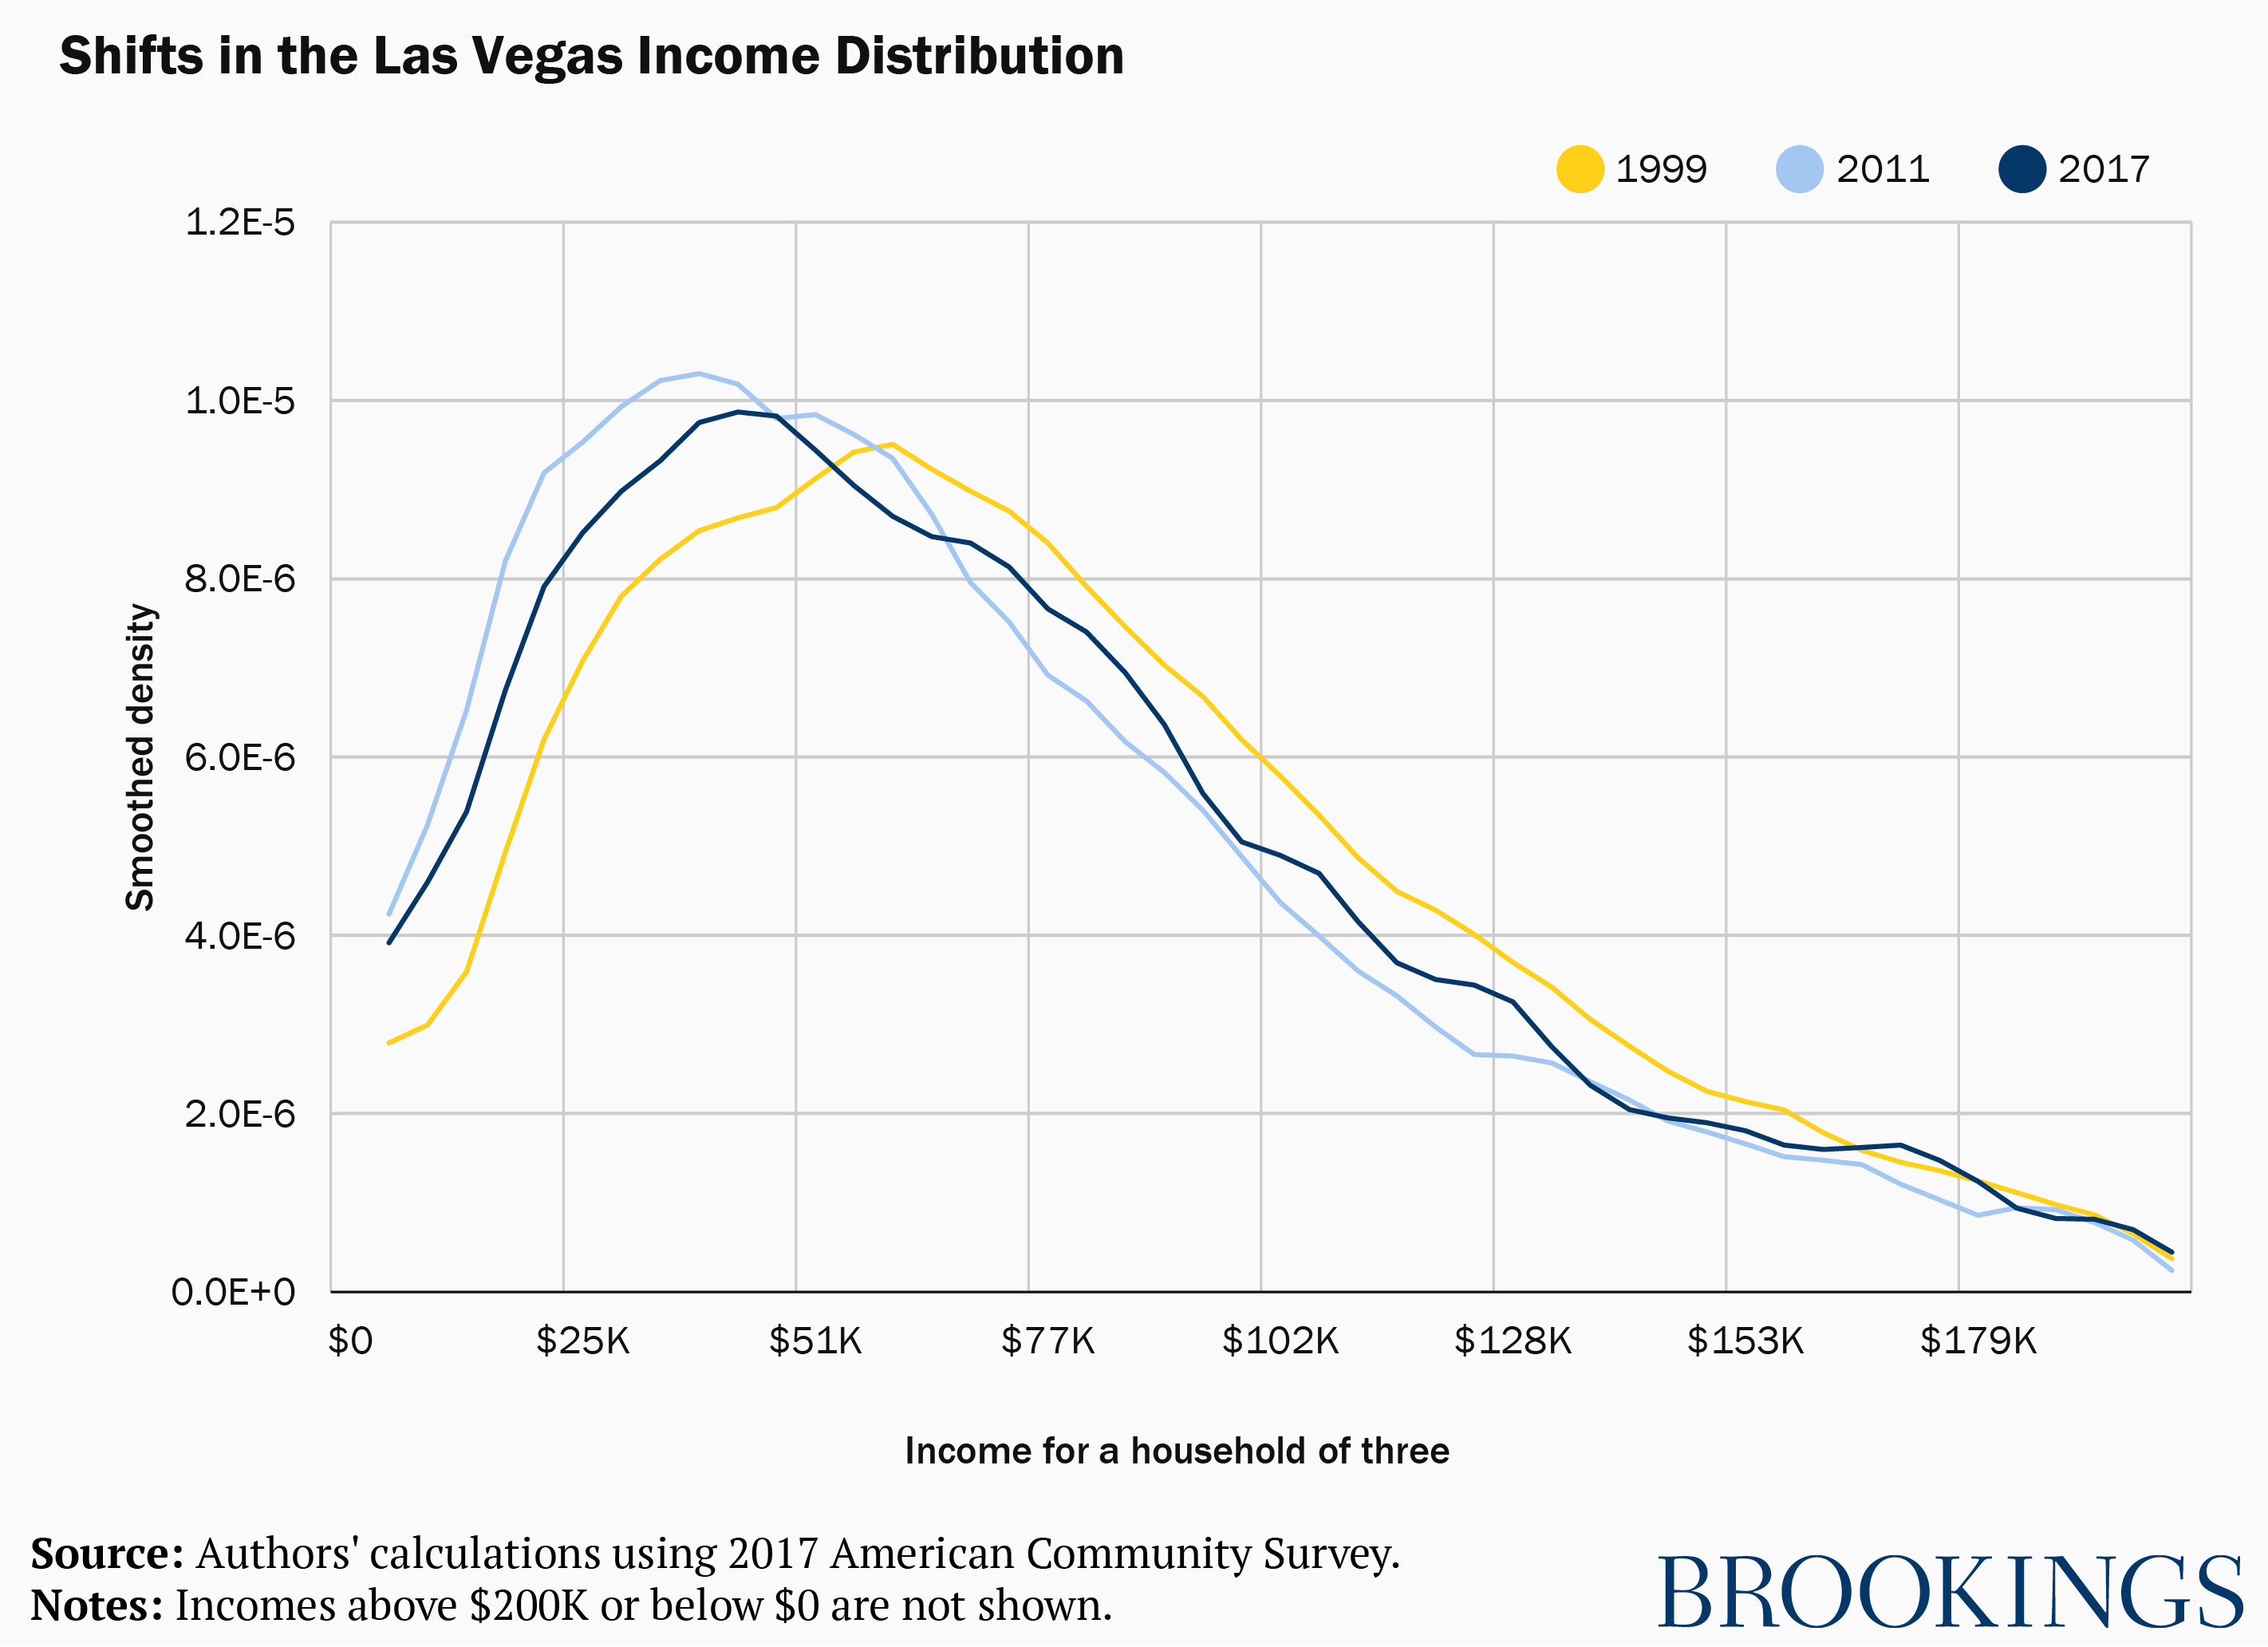
The overall household income distribution in Las Vegas shifted left during the Great Recession, with relatively more households at lower incomes in 2011 than in 1999.

These trends have prompted concern that the middle class in Las Vegas is shrinking. This is not just a local issue: a recent report from the OECD reported that the middle class is shrinking in most member nations. But the middle class can only change in size if it is defined in a certain way. For instance, if the middle class is defined as the middle 60% of the local income distribution, then the percentage of households in the middle class will always be 60%; if it is instead defined as the middle 60% of the national distribution, then declining local incomes could lead households to fall out of the national middle class.
Changes in the size of the middle class thus depend crucially on its definition. Using two different definitions of the middle class (our own and a version of the definition popularized by Pew Research Center), we show that the share of households in Las Vegas who are middle class either dropped from 57% to 52% or remained constant at about 65% between 1999 and 2017.
Further, changes in the size of the middle class can occur for radically different reasons—because more (or fewer) people are rich, or because more (or fewer) people are poor. Our colleague Alan Berube previously found that most metros with shrinking middle-class populations are primarily seeing growth in high-income populations. Prognostications on the size of the middle class can therefore be misleading and should be treated with caution.
The dynamics of the middle class are more informative than simply the size of the middle class. Las Vegas was among the ten metros hit hardest by the Great Recession, and the middle got hit hardest of all. The chart below shows not only that middle wages (especially the second and third quintiles) suffered most in the Recession, but also that middle earners in harder-hit areas like Las Vegas experienced a persistent gap in wage growth through 2016, even as those at the top and bottom kept pace with less-affected areas:
Like many local areas across the U.S., Las Vegas faces the challenge of rebuilding wages and incomes for middle-class families. One of the most important routes to a middle-class income—and likely to become even more important—is post-secondary education.
Colleges and upward mobility
Debates on post-secondary education tend to be dominated by the tails. One example of this tendency is the popular measure of bottom-to-top mobility—that is, the percentage of a college’s students who move from the very bottom of the income distribution to the very top. This measure is useful for describing a rags-to-riches style of mobility. But it provides no information about how far colleges are serving and helping students from middle-class families or getting low-income students into the middle class.
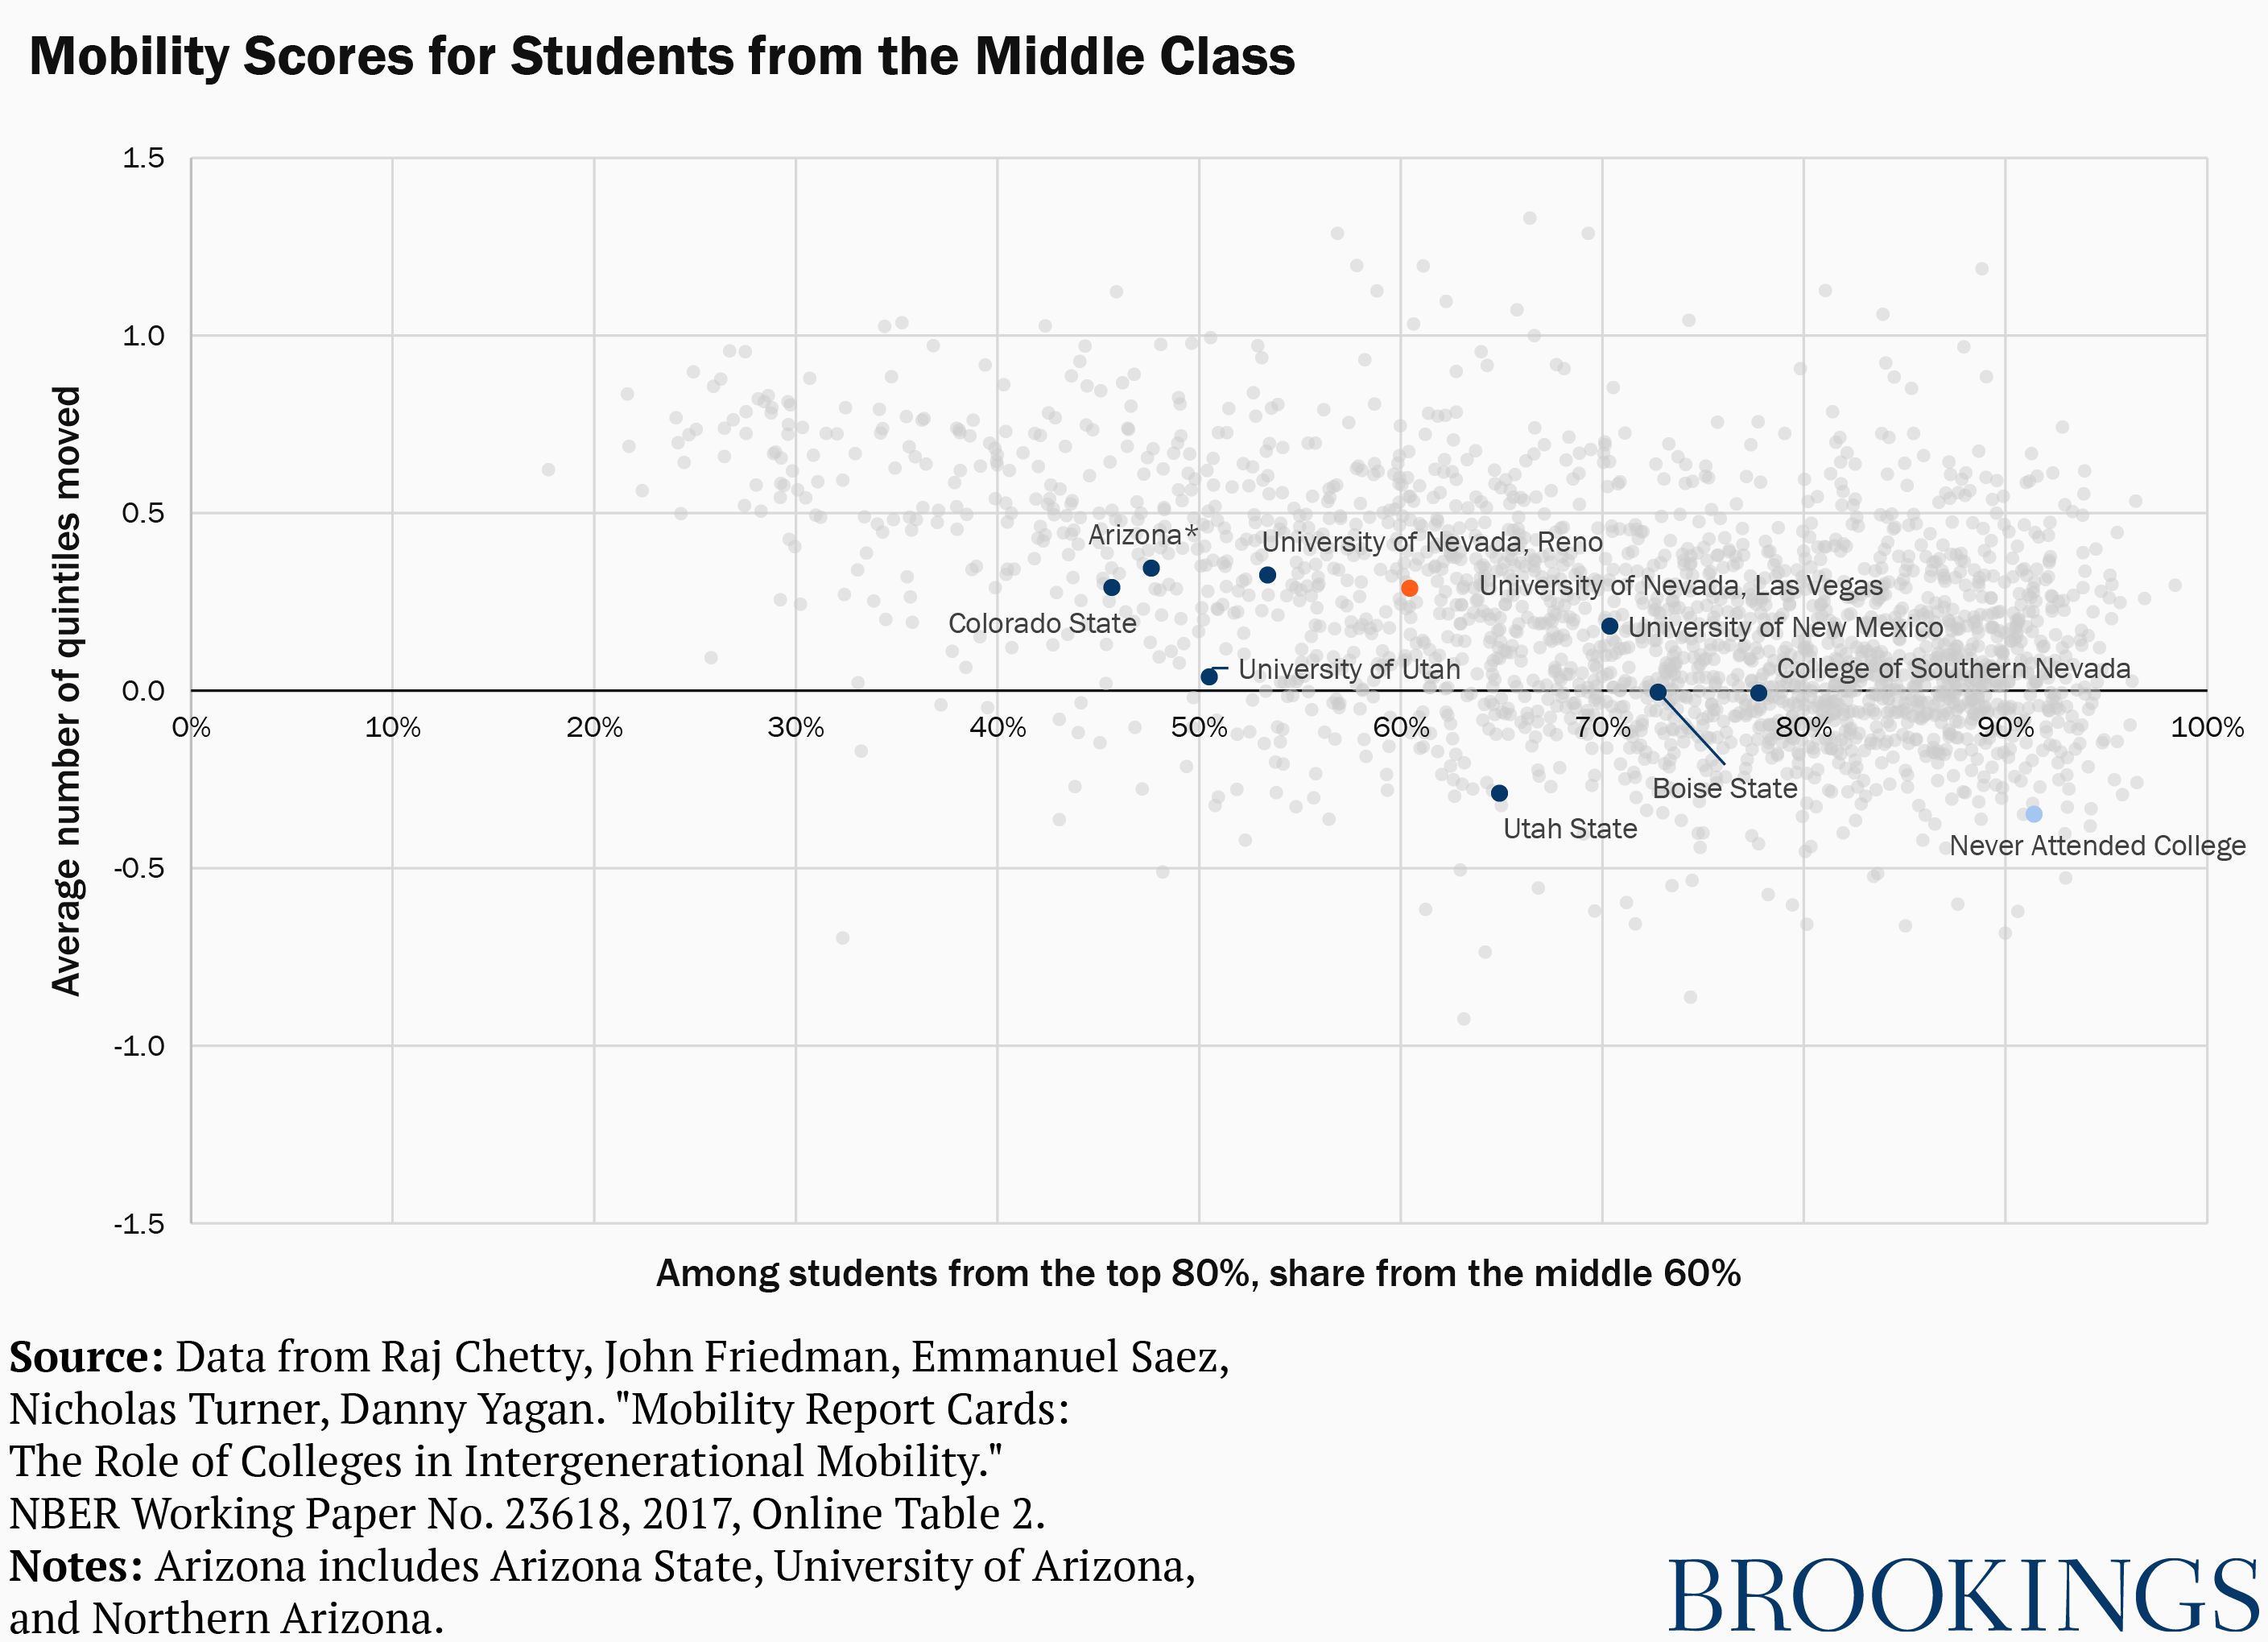
Using a new metric of mobility based on data from Opportunity Insights (formerly the Equality of Opportunity Project), we examine the contribution of colleges to serving and strengthening the middle class. Our topline mobility measure shows the average number of quintiles moved among middle-income students at a given college. Big moves up the income ladder will pull up the average; downward movements will pull it down.
We test out this mobility measure on the University of Nevada, Las Vegas and eight other colleges of similar size and geographic location:

(The x-axis shows the share of the college’s students who come from the middle 60% relative to students from the top 80%, to avoid penalizing colleges for taking large shares from the bottom 20%. For more details on our approach see the full paper).
Colleges with positive mobility scores move students up the income distribution, on average, while colleges with negative mobility scores move students down the income distribution. The average number of quintiles moved across the whole distribution of colleges is low: the national figure is 0.2.
For the most part, then, colleges are largely keeping middle-class students in place. This is not necessarily a bad outcome. Most community colleges, including the College of Southern Nevada, take the bulk of their students from the middle class and send most of them back into the middle class. The outcomes for those who do not attend college are considerably worse: the average non-attender is downwardly mobile.
It is important to stress that the economic outcomes of students attending a particular college reflect a range of factors independent of the college itself. The level of academic readiness of students enrolling at different institutions, even at similar levels of selectivity, may vary considerably. The state of the labor market they graduate into will differ greatly, too. So for schools that send most of their students into jobs nearby, the availability of middle- and upper-income job opportunities will clearly impact outcomes. This is important context for assessments of the mobility performance of local colleges.
Implications for studying middle-class mobility
Building a stronger middle class is a priority for the nation. This work must be done not just nationally, but also by metro areas and institutions—not least, colleges. This is especially true in cities like Las Vegas, where middle-class workers were hit hardest by the recession.
Our report explores a new measure of middle-class college mobility, using institutions in the Mountain West by way of illustration and motivation. Most of these colleges help middle-class students move up the economic ladder, or at least protect them against downward mobility.
To be clear, colleges should be compared on a range of mobility metrics to capture the extent to which they serve different populations of students. Bottom-to-top mobility is an important goal, but not the only one. Particularly for less selective public institutions (which educate the bulk of middle-class students), as well as for institutions in struggling local labor markets, moving students into or keeping them in the middle class may well be counted as a success.
The Brookings Institution is committed to quality, independence, and impact.
We are supported by a diverse array of funders. In line with our values and policies, each Brookings publication represents the sole views of its author(s).


Commentary
Making a middle class: Colleges and cities in the Mountain West
July 17, 2019
The authors use data on the middle class in Las Vegas to argue that the strength of the middle class should be measured by a “quality of life” measure rather than a “size” measure and introduce a new metric to assess the extent to which colleges are helping students attain or sustain a middle-class standard of living.