U.S. policymakers continue to engage in an active debate over the minimum wage. Calls for minimum wage increases—at the federal, state, and local levels—are based on the premise that rises in the minimum wage will improve the economic well-being of low-paid workers. This has become an important policy prescription in movements to combat poverty.
One area of focus in the debate is whether a minimum wage increase would actually affect many workers. Some skeptics have argued that only a very small share of workers actually receive the minimum wage, and furthermore, that many of those workers are not struggling adults, but rather teenagers from affluent families. Understanding the magnitude of the impact of a federal or state-level minimum wage increase on workers is an important first step in informing the policy debate.
The argument that only a small share of workers is actually paid the minimum wage misses a key point: many of those who would be impacted by a raise in the minimum wage are actually low-wage workers making slightly above the minimum wage. In addition to this broader scope of the workforce, economist Arin Dube of the University of Massachusetts-Amherst points out that a shrinking share of low-wage workers is comprised of teenagers. His work shows that among those earning no more than the federal minimum wage of $7.25 in 2011, fewer than a quarter were teenagers. Among those earning less than $10 an hour, only 12 percent were teenagers, as compared to 26 percent in 1979.
In this month’s Hamilton Project economic analysis, we consider the likely magnitude of the effects of a minimum wage increase on the number and share of workers affected. Considering that near-minimum wage workers would also be affected, we find that an increase could raise the wages of up to 35 million workers—that’s 29.4 percent of the workforce.For the purpose of this analysis, we set aside the important issue of potential employment effects, which is another crucial element in the debate about an optimal minimum wage policy. We also continue to explore the nation’s “jobs gap,” or the number of jobs needed to return to pre-recession employment levels.
The Ripple Effects of Minimum Wage Policy
Although relatively few workers report wages exactly equal to (or below) the minimum wage, a much larger share of workers in the United States earns wages near the minimum wage. This holds true in the states that comply with the federal minimum wage, in addition to those states that have instituted their own higher minimum wage levels.
An increase in the minimum wage tends to have a “ripple effect” on other workers earning wages near that threshold. This ripple effect occurs when a raise in the minimum wage increases the wage received by workers earning slightly above the minimum wage. This effect of the statutory minimum wage on wages paid at the low end of the wage distribution more generally is well recognized in the academic literature. Based on this recognition, we quantify the number of workers potentially affected by minimum wage policy using the assumption that workers earning up to 150 percent of the minimum wage would see a wage increase from a higher minimum wage. We hasten to note that a complete analysis of the net effects of a minimum wage increase would also have to account for potential negative employment effects. Our main goal of this empirical exercise is to dispel the notion that the minimum wage is not a relevant policy lever, which is based on the faulty premise that only a small number of workers would be affected.
Using data from the Bureau of Labor Statistics, combined with information on the binding minimum wage in each state, we are able to calculate these shares. Just 2.6 percent of workers are paid exactly the minimum wage, but 29.4 percent of workers are paid wages that are below or equal to 150 percent of the minimum wage in their state. Furthermore, the hours worked by this group represent nearly one-quarter—24.7 percent—of hours worked, which indicates that a large share of the impacted group is working close to full time hours.
In 2012, 32 states complied with the federally set minimum wage of $7.25 per hour. In these states adhering to the federal floor, 3.7 million workers earn the minimum wage or less. An additional 15.2 million are near minimum wage, earning more than $7.25 per hour but less than $10.88 per hour. Therefore, 18.9 million workers in these states would likely benefit from an increase in the federal minimum wage.
The Ripple Effect by State
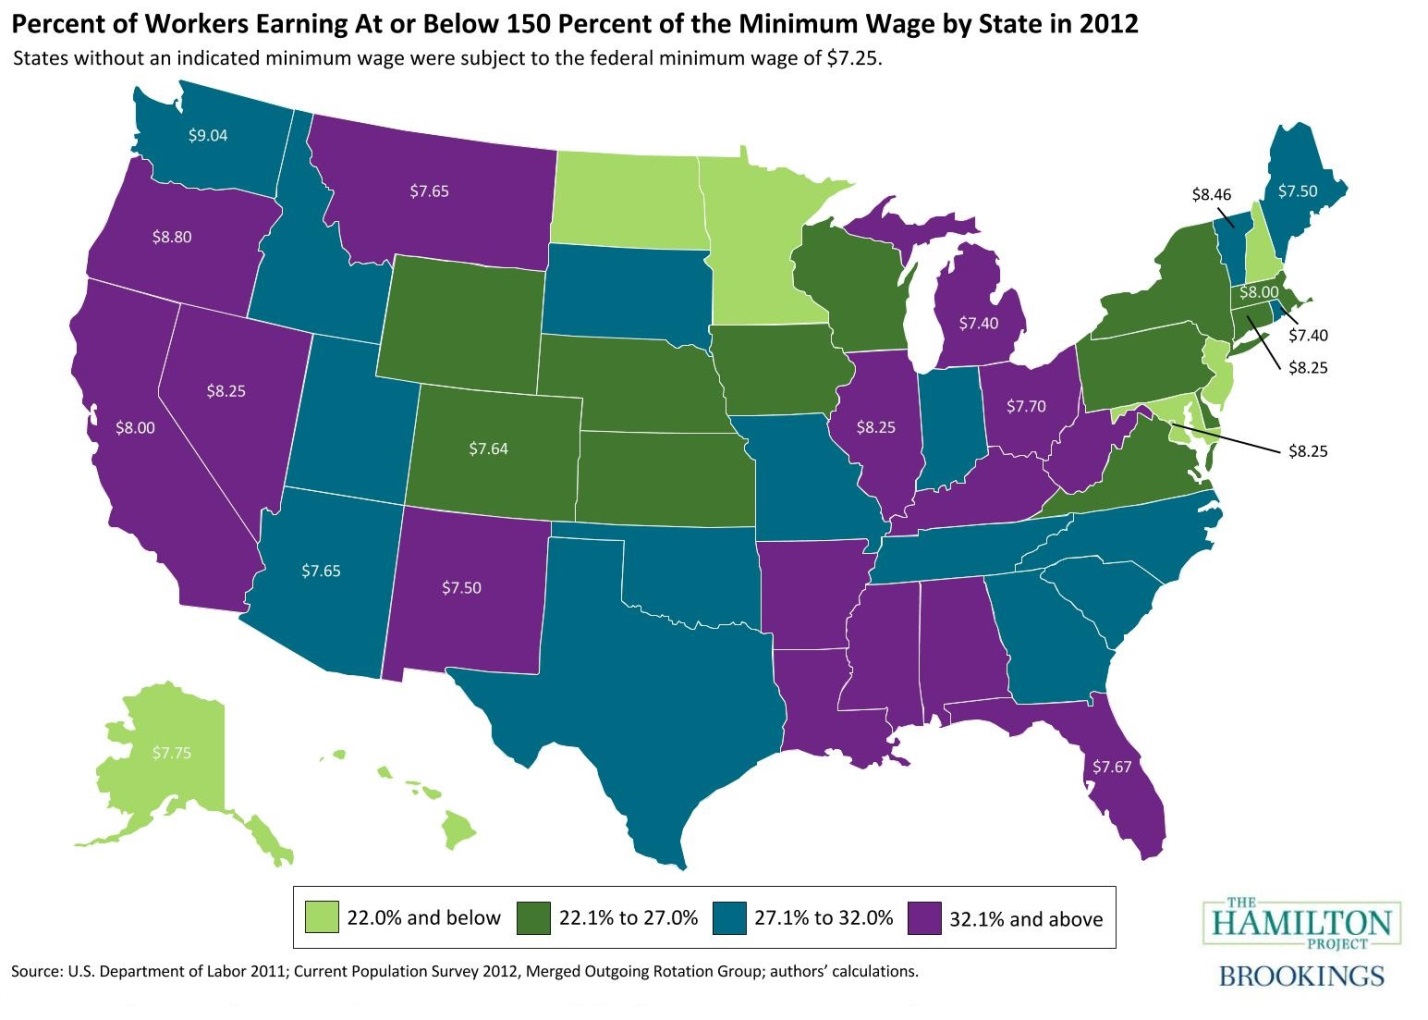
States have the opportunity to set a minimum wage above the federal floor. Eighteen states, plus the District of Columbia, had minimum wages that exceeded the federal wage floor in 2012, ranging from $7.40 in Michigan and Rhode Island to $9.04 in Washington. In these states, 3.9 million workers earn their state’s minimum wage and an additional 12.1 million workers earn between the mandated floor but less than 150 percent of the minimum level.
Overall, up to 16.0 million workers would likely see a raise in their wages if the minimum wage were increased in these states.
Indeed, every state in the country has a substantial share of workers who would be impacted by an increase in the minimum wage in that state, as seen in figure 1 below. In 2012, Montana had the highest share of workers—37.2 percent—with wages equal to or less than 150 percent of the minimum wage. Even in Alaska, which boasts higher wages compared to the rest of the country, 16.9 percent of workers had wages equal to or lower than 150 percent of the minimum. In the high-population state of California, 4.6 million workers would likely see a wage increase if the minimum wage were raised in that state.
Not surprisingly, the eighteen states with a higher minimum wage level than the federal benchmark tended to have higher shares of workers with wages within 150 percent of the minimum wage. However, in every state in the country, at least one in six workers had wages that were equal to 150 percent of the minimum wage or lower.
Figure 1
To see the new state-by-state interactive chart, click here.
The December Jobs Gap
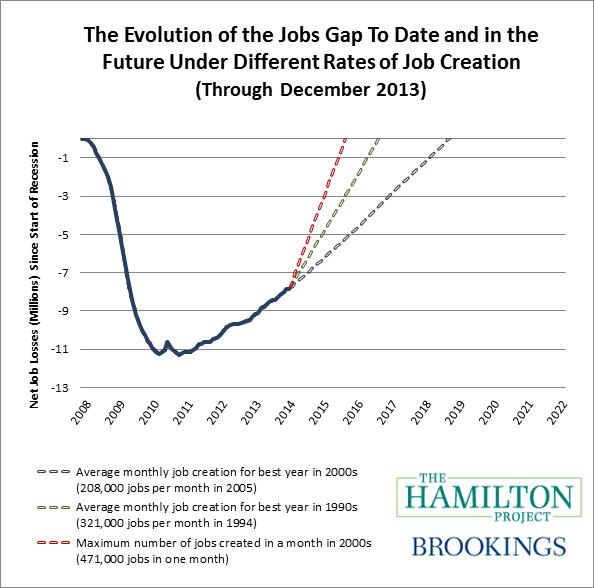
As of December, our nation faces a jobs gap of 7.8 million jobs. The chart below shows how the jobs gap has evolved since the start of the Great Recession in December 2007, and how long it will take to close under different assumptions of job growth. The solid line shows the net number of jobs lost since the Great Recession began. The broken lines track how long it will take to close the jobs gap under alternative assumptions about the rate of job creation going forward.
Figure 2
If the economy adds about 208,000 jobs per month, which was the average monthly rate for the best year of job creation in the 2000s, then it will take until September 2018 to close the jobs gap. Given a more optimistic rate of 321,000 jobs per month, which was the average monthly rate of the best year of job creation in the 1990s, the economy will reach pre-recession employment levels by August 2016.
To explore the outcomes under various job creation scenarios, you can try out our interactive jobs gap calculator by clicking here. You can also see the jobs gap in each state by clicking here.
Conclusion
The minimum wage debate currently underway tends to narrowly focus on those workers making exactly the minimum wage. This approach misses a large number of low-wage workers whose wages would likely be raised through a ripple effect resulting from an increase in the minimum wage.
As our economy continues to recover, a minimum wage increase could provide a much-needed boost to the earnings of low-wage workers. A significant 35 million workers from across the country could see their wages rise if the minimum wage were increased, allowing them to earn a better livelihood and lead more economically secure lives. When discussing the minimum wage, this is the magnitude of the impact that policymakers should consider.
[1] Throughout this analysis we only consider non-self-employed workers age 16-64. By our calculations, the size of that workforce was 122.2 million workers in 2012.
The Brookings Institution is committed to quality, independence, and impact.
We are supported by a diverse array of funders. In line with our values and policies, each Brookings publication represents the sole views of its author(s).


Commentary
The “Ripple Effect” of a Minimum Wage Increase on American Workers
January 10, 2014