To kick off the Future Development blog in 2020, we present the third in a four-part series on the future of development.
Around the world, household final consumption expenditure rose by $18.2 trillion in 2011 PPP terms between 2010 and 2020, from $46.5 trillion to $64.8 trillion. This growth, averaging about 3.3 percent per year, was the same as the average growth over the previous forty years—a bit better than growth in the first decade of this century, a bit worse than the growth in the last decade of the last century. It represents a continuation of a period of sustained advances in material prosperity in most places across the world that has seen average real consumption per person more than doubling in the last 40 years.
But as we all know, averages can be deceiving. What matters is how growth has been distributed. Who gained most and who gained least? To answer these questions, I broke down household consumption into four different groups—the poor, the vulnerable, the middle class and the rich—in 167 countries for which distributional data is available, representing 97 percent of the world’s population and 95 percent of global GDP.
Before getting to the punchline, it is helpful to set the stage. In 2010, households in rich countries accounted for over half of global household spending, despite having only 15 percent of the world’s population. Upper-middle-income countries (think China) had 36 percent of the people and 29 percent of consumption; lower-middle-income countries (think India) had 37 percent of the people and 17 percent of the spending; and low-income countries had 11 percent of the people but only 2 percent of global consumption.
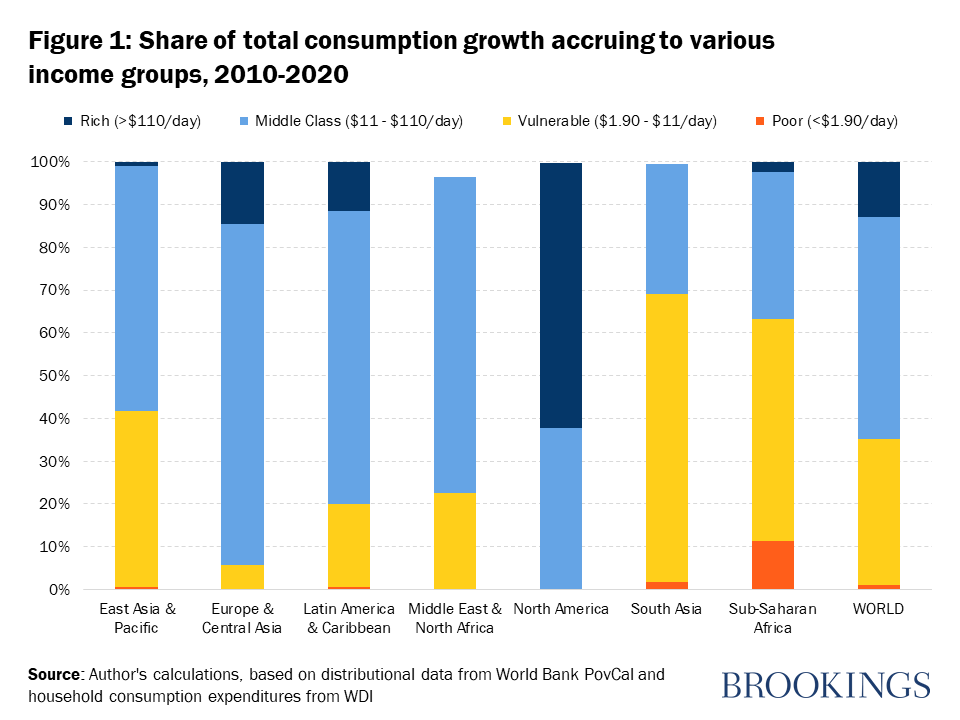
It will come as no surprise to readers of this blog to be told that the bulk of the spending gains of the last decade have accrued to the global middle class—52 percent by our calculations (see previous posts on the middle class here, here and here). The vulnerable group—those above the level of extreme poverty but not yet in the middle class—also benefited quite a bit, gaining one-third of the incremental spending growth. The rich got 13 percent but remember that there were not that many to begin with in 2010, fewer than 150 million people or only 2 percent of the global population. So, they got far more than their population share would warrant. And, unfortunately, the poor got the least, just 1 percent of the total spending increment in the world in the last decade was by people who had been extremely poor in 2010.
Why did this happen? Partly, it is the result of the geographic distribution of growth. Households in North America (U.S., Canada, and Bermuda), who number only 5 percent of the world’s population, accounted for 17 percent of the incremental global spending. Asian households, with 32 percent of the world’s population, got 40 percent of the total increment in spending. Every other region received less than its initial population share, implying they fell behind the global average. Unsurprisingly, households living in sub-Saharan Africa, with 13 percent of the global population, only saw annual per capita spending gains of 0.6 percent over the decade.
Beyond geography, income distribution also makes a difference. In North America, two-thirds of the spending gains went to households that were already rich in 2010. In South Asia, two-thirds went to vulnerable households. Latin America, Europe, and the Middle East did not have much growth in average spending, but the distribution was massively in favor of the middle class. East Asia shared the gains between the middle class and the vulnerable.
In many countries, the rich got a massively disproportionate share of the growth. The United States was the top of the league table in terms of the rich’s share of consumption growth—fully 65 percent of the spending increase. But to a certain extent, this is to be expected. The rich started in 2010 with the bulk of household spending in the United States, and the distribution over the last decade simply reinforced this inequality. In other countries, the changes were even more severe. For example, in Cyprus, the rich constituted 3 percent of the population in 2010. The incremental spending of this top 3 percent between 2010 and 2020 accounted for 59 percent of the total spending increase by all Cypriot households. Germany, Austria, Argentina, Korea, Denmark, the United Kingdom, and South Africa see similarly large shares of household spending going to the small fraction of the population that were rich in 2010.
Table 1: Top 10 countries where rich accrued highest of share consumption gains, 2010-2020
| Country | Total Consumption Growth 2010-2020 | Population Share Rich, 2010 | Rich’s share of total consumption growth between 2010 and 2020 |
| United States | $2,817,870,790,656 | 28% | 65% |
| Cyprus | $2,299,336,704 | 3% | 59% |
| Germany | $253,561,536,512 | 8% | 51% |
| Austria | $20,363,804,672 | 9% | 40% |
| Argentina | $42,132,013,056 | 3% | 39% |
| Luxembourg | $4,304,900,096 | 15% | 37% |
| Korea, Rep. | $177,334,059,008 | 2% | 36% |
| Denmark | $15,600,689,152 | 4% | 35% |
| United Kingdom | $248,524,570,624 | 8% | 33% |
| South Africa | $20,367,638,528 | 3% | 29% |
Source: Author’s calculations, based on distributional data from World Bank PovCal and household consumption expenditures from WDI
Looking towards the future
Looking towards the future, there is a risk that this pattern of growth and its distribution will simply perpetuate itself. Forecasts by the IMF through 2024, and trends thereafter, suggest that household consumption will continue to register growth of 3.4 percent per year. By 2030, household expenditure should reach $90 trillion in real terms, or just over $10,800 for every man, woman, and child on the planet. That is enough to ensure a comfortable life for everyone, but, as is true today, the distribution of consumption gains will not be even.
In 2030, the rich will account for 4 percent of the world’s population and one-quarter of household consumption. In North America, all the growth in consumption over the next decade will happen in rich households—those who were already rich in 2020 plus those who become rich in the next ten years. In Europe, the gains will be evenly split between the rich and the middle class.
In Asia, the big gains will accrue to the middle class. Asian middle-class markets are set to expand from $20 trillion today to $36 trillion by 2030. By comparison, the North American plus European middle-class markets will barely change—$17 trillion in 2020 and perhaps $18 trillion in 2030. In sub-Saharan Africa, headcounts of vulnerable households and those in extreme poverty look likely to continue to rise.
The good news, then, is that the world in 2030 will be more prosperous. Indeed, the middle class could swell to over 5.5 billion people, predominantly in Asia.
But it will also be significantly more unequal in individual countries. The European and North American middle class may not get much relief given current growth and policy trends. Rich people in those countries will continue to prosper, but that raises the question of whether such trends are politically and socially sustainable and, if not, what kinds of new politics and new policies will arise.
Finally, there is limited hope for significant gains for the 1.4 billion people who will live in sub-Saharan Africa in 2030, unless there are sharp changes in approach. These populations, likely further buffeted by climate change and by local conflicts, will look towards wealthier parts of the world in Europe and North America with ever-growing desperation. The world community does not have much time to mitigate these pressures.
I would like to thank Meagan Dooley for the data analysis contributed to this blog.
Related Books
Related Content

Author

The Brookings Institution is committed to quality, independence, and impact.
We are supported by a diverse array of funders. In line with our values and policies, each Brookings publication represents the sole views of its author(s).


Commentary
Who gained from global growth last decade—and who will benefit by 2030?
January 16, 2020