Everyone is talking about “inclusive growth.” U.N. Secretary General António Guterres called for inclusive growth in a recent Financial Times op-ed. Former IMF Managing Director Christine Lagarde called for inclusive growth in her 2019 interview in The Economist magazine. The G-20 leaders added pursuit of inclusive growth to their mandate in 2016, pledging to work towards “strong, sustainable, balanced and inclusive growth.” Across the world, in advanced and developing countries, the narrative to explain electoral results and street protests revolves around whether growth has been inclusive. In this blog, we try to tease out the empirics of inclusive growth over the last three decades.
There is no clear consensus on what is meant by inclusive growth (and maybe it is so widely used because it is a deliberately ambiguous term). Martin Ravallion and Shaohua Chen use an absolute definition; any period of growth during which there is poverty reduction is considered inclusive. Nanak Kakwani and Ernesto Pernia, Klasen (2010), and Ali and Son (2007), consider growth to be inclusive when the incomes of the poor grow faster than the incomes of the rich. More texture can be added by considering non-income variables, often determinants of opportunity like access to health care, education, infrastructure services or job opportunities. The African Development Bank takes a very broad view that captures the concept but is hard to measure: “economic growth that results in a wider access to sustainable socio-economic opportunities for a broader number of people, regions or countries, while protecting the vulnerable, all being done in an environment of fairness, equal justice, and political plurality.”
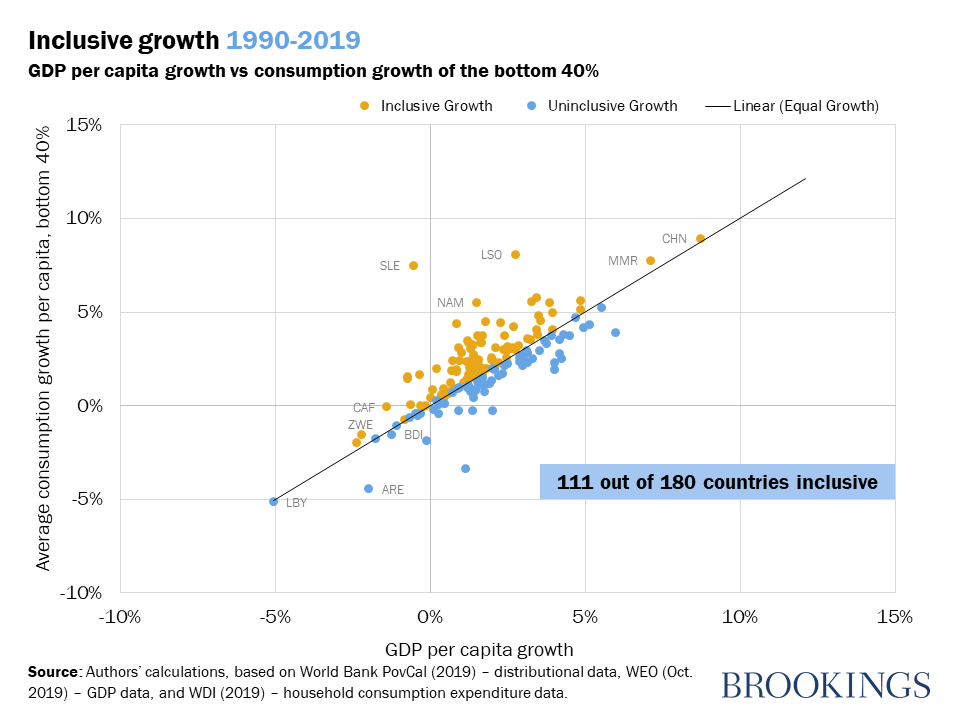
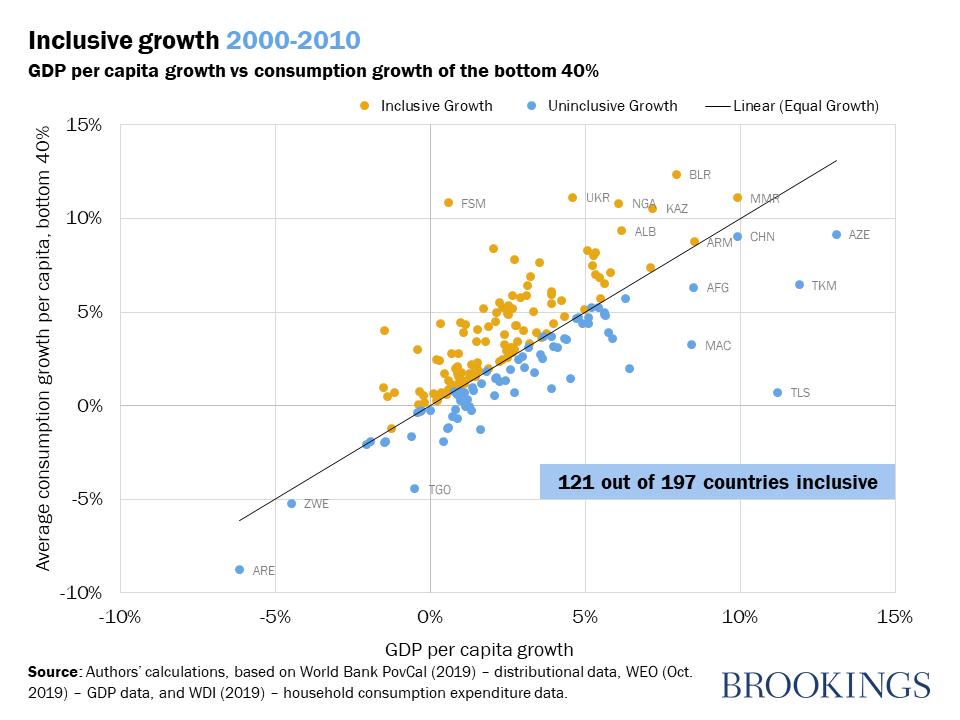
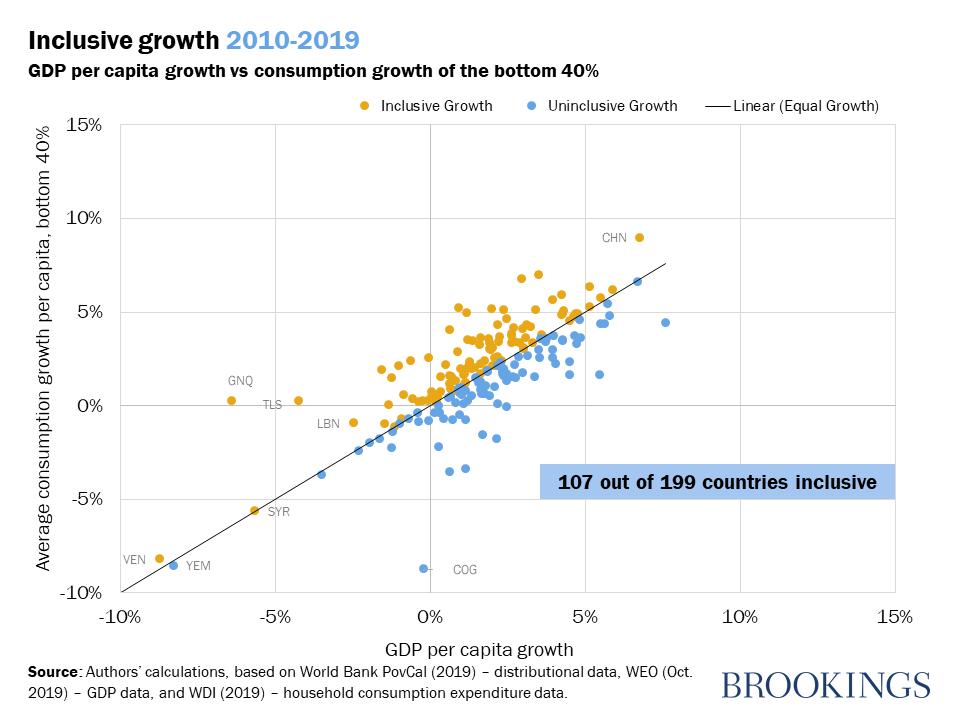
We take a very simple approach: growth is inclusive when it (1) translates into increased household consumption, and (2) those consumption gains are broadly distributed. Our measure of inclusive growth, therefore, compares the growth in mean consumption of the poorest 40 percent of the population with GDP per capita growth.
To obtain the consumption growth of the bottom 40 percent of the population in each country, we use the World Bank’s PovCal database. We follow the method described in Chen and Ravallion (2008) to estimate the share of the bottom 40 percent in total consumption, and apply this share to household expenditure from national accounts data. Our sample covers 199 countries, over 3 decades between 1990 and 2019 (latter forecast by IMF), totaling 597 independent observations.
Does growth lead to increased household consumption?
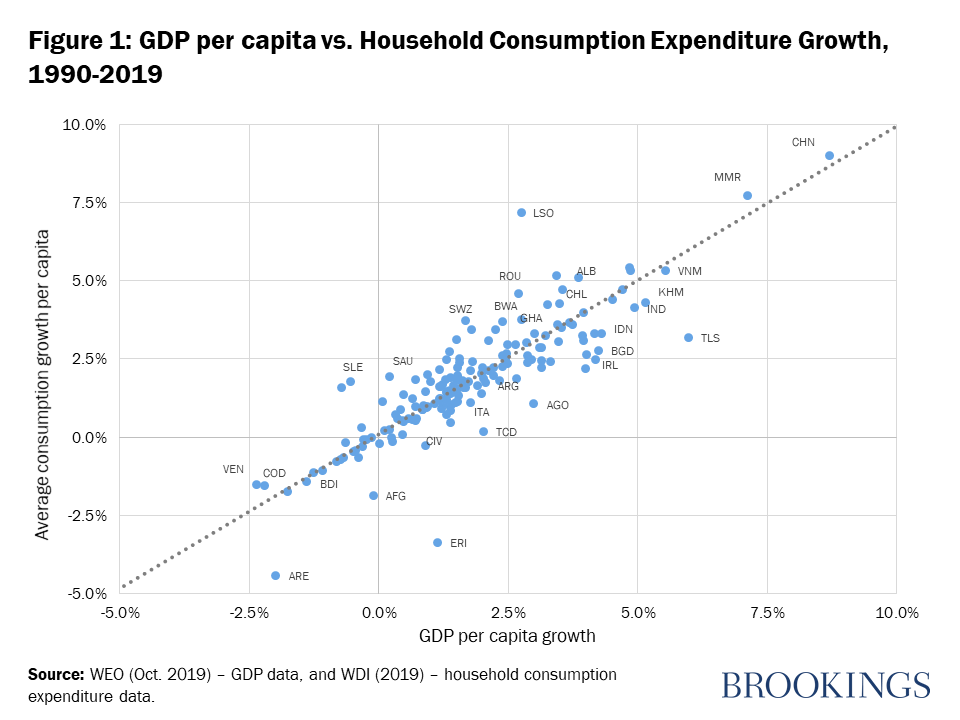
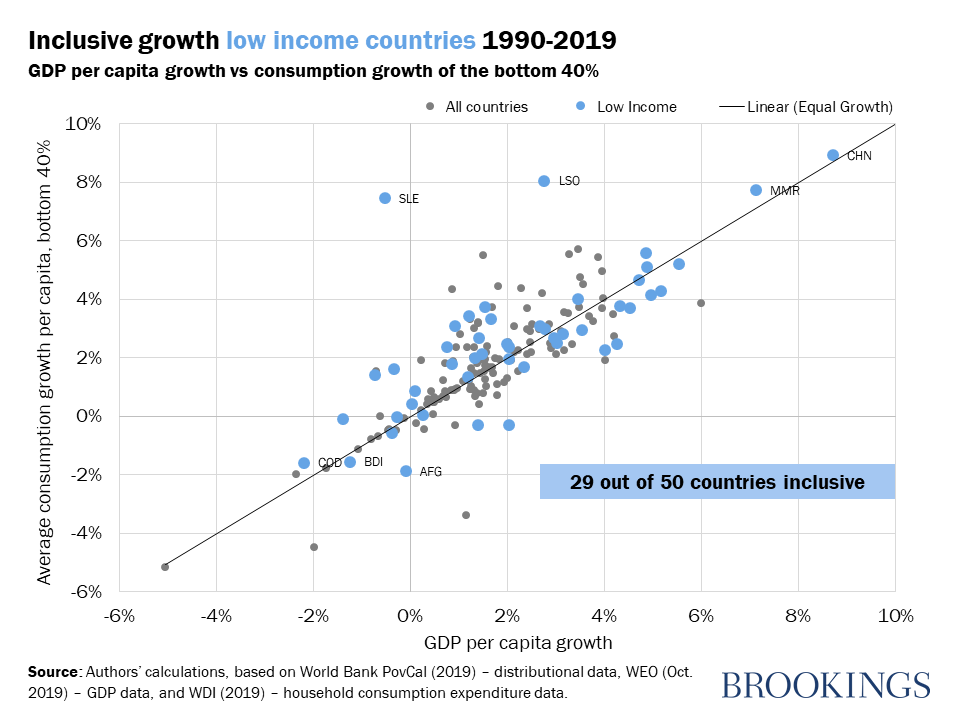
Figure 1 below shows how GDP growth translates into household final consumption expenditures over the full period, 1990-2019. The 178 countries are clustered along a line with a slope of 0.9852. In other words, on average, each one percentage point of GDP growth translates into a one percentage point increase in household expenditure. This holds for countries with rapid growth (China, Myanmar), moderate growth (Vietnam, Ghana) and negative growth (Burundi, Venezuela).
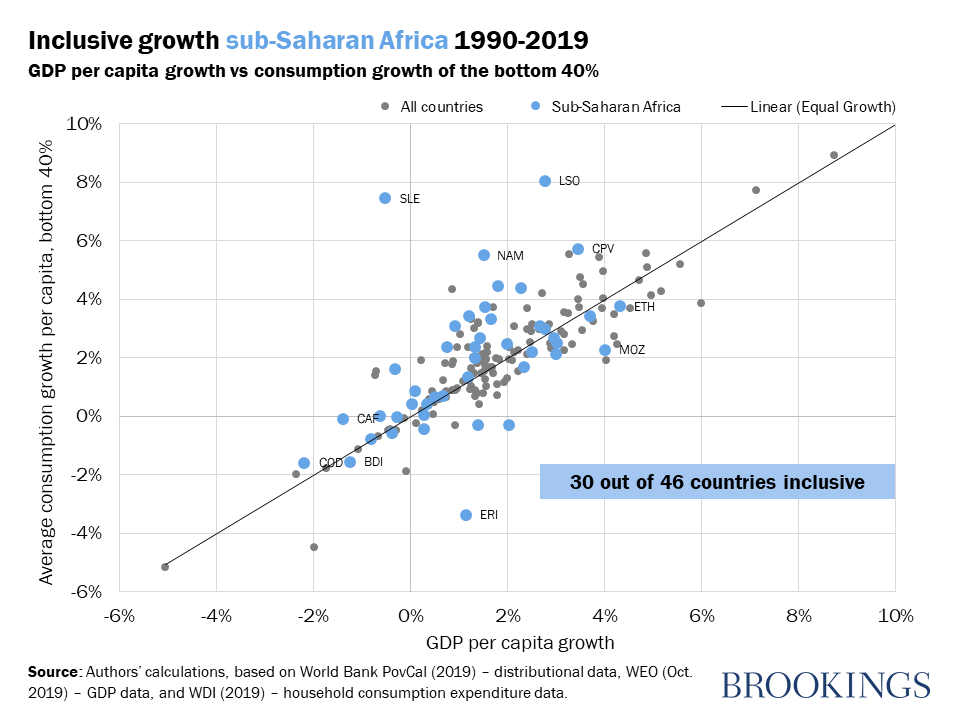
As expected, there are some outliers that reflect specific country circumstances. Timor Leste (TLS) stands out as a country that has had rapid GDP growth, largely due to oil and gas production, but it has saved significant amounts for future consumption in a Petroleum Fund. Conversely, Lesotho (LSO) has enjoyed more rapid consumption growth than GDP growth thanks to large remittances received from overseas workers.
How is consumption growth distributed across the population?
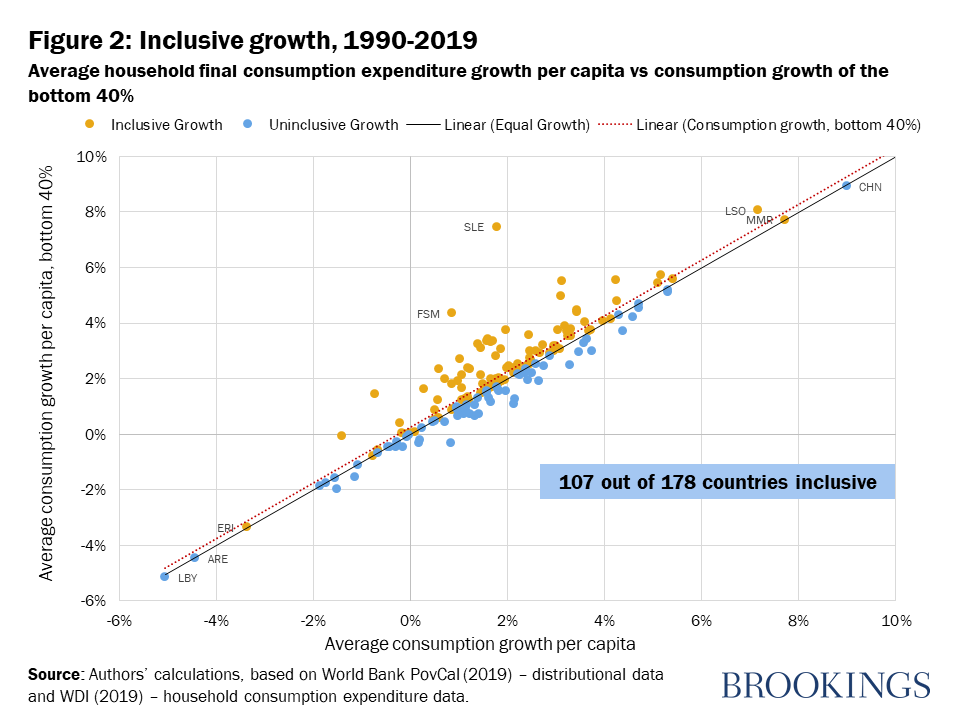
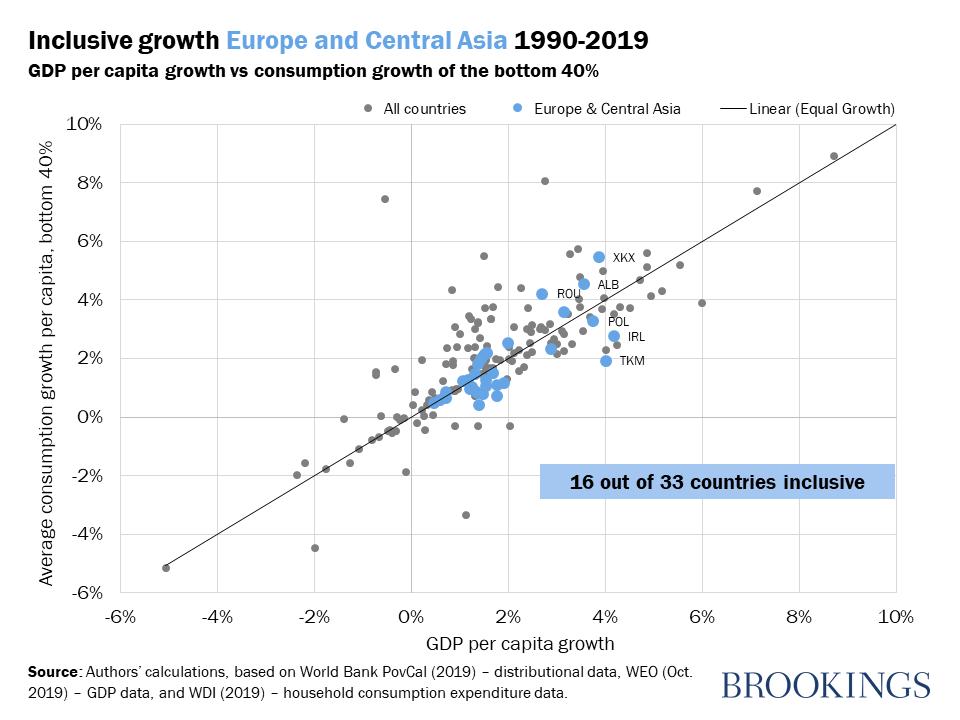
The next step is to look at how consumption growth is distributed. Figure 2 below shows the relationship between consumption growth of the bottom 40 percent and average consumption growth for the overall population across countries. The estimated coefficient of the best-fit line is almost exactly one. This mirrors Dollar and Kraay’s results in 2001 that growth is good for the poor.
Going behind the averages
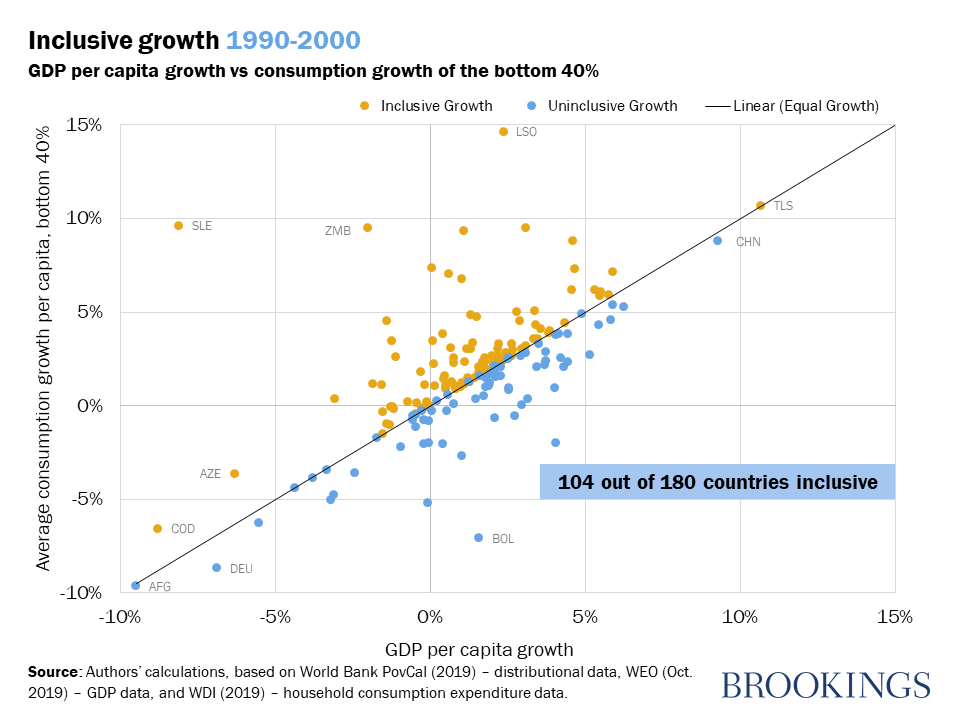
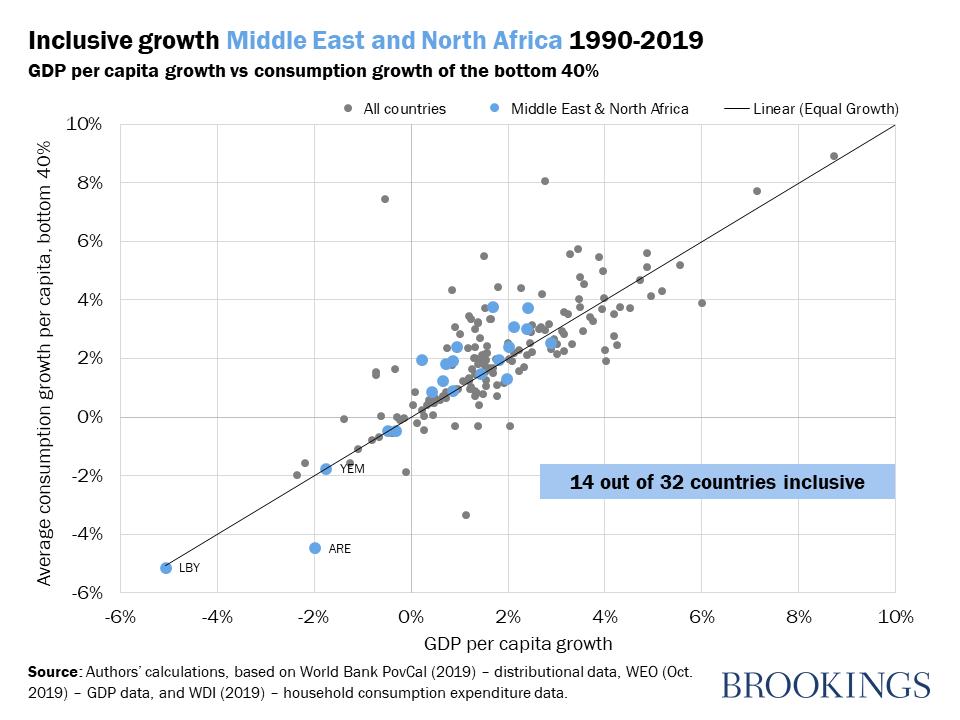
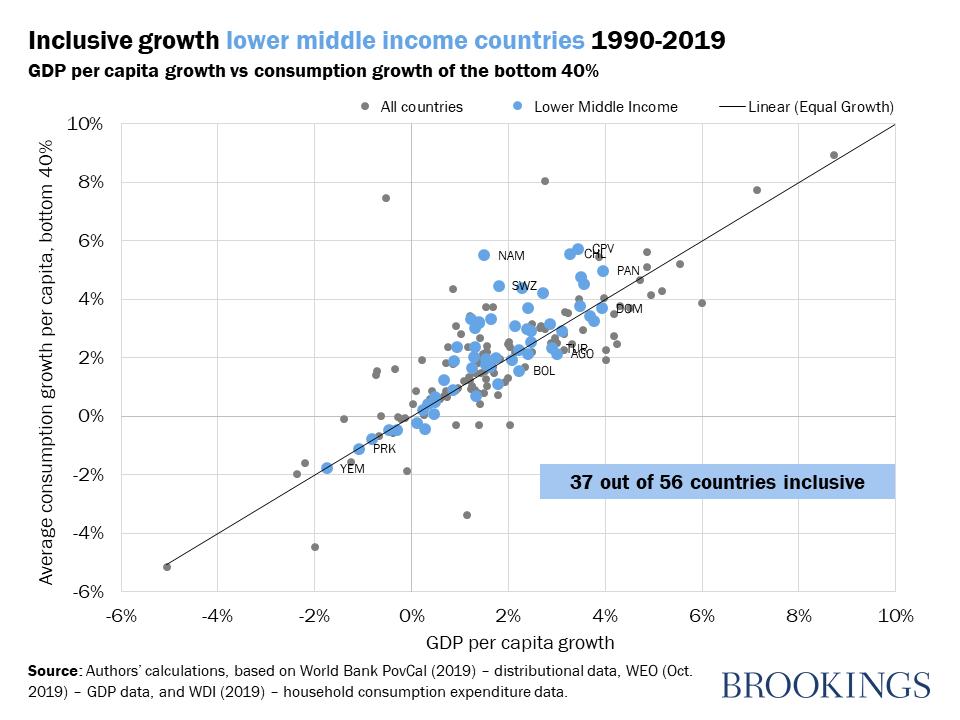
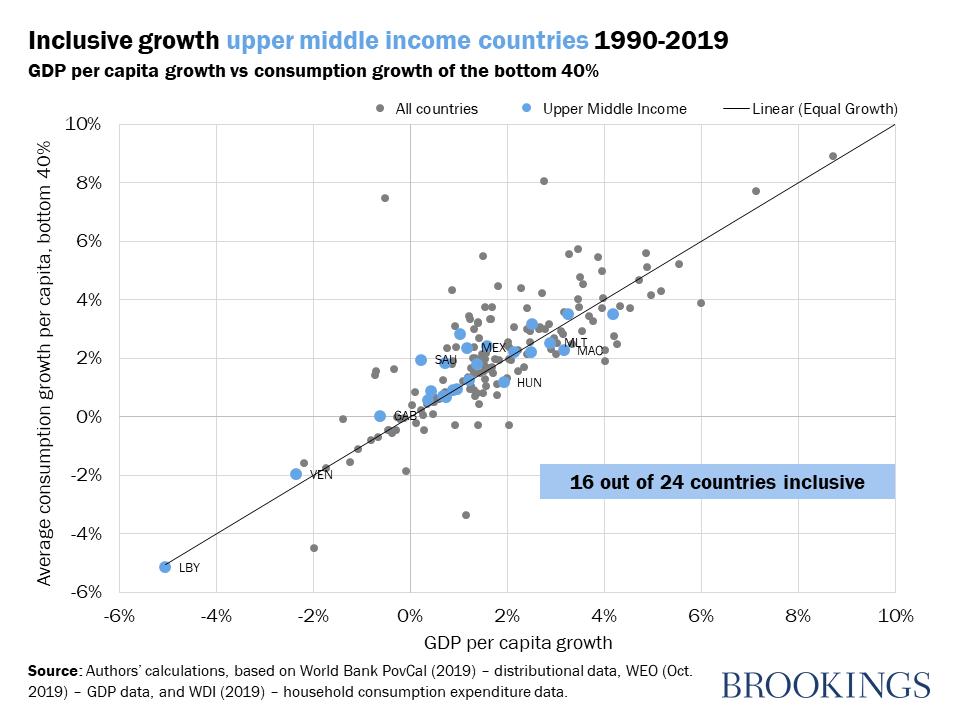
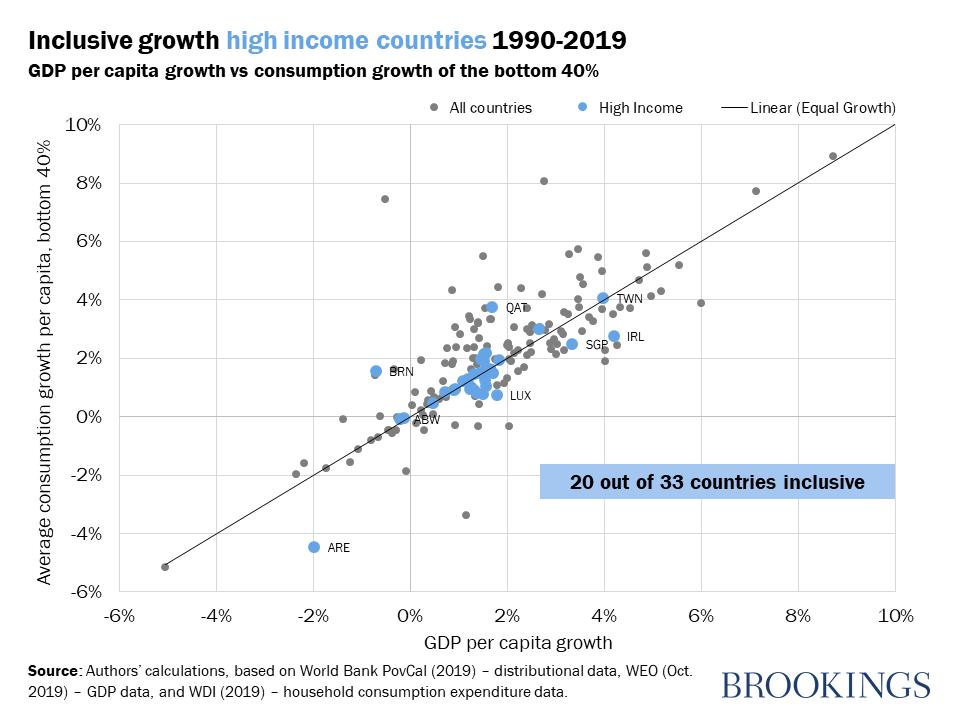
We repeated this exercise for different groupings of countries, and different time periods to see if there are any characteristics that would clearly show more or less inclusive patterns of growth. The results are summarized in Table 1 below. The Table columns show the number of times a country displays inclusive growth, using the definition above, over the three-decade period 1990-2019. To illustrate, the first row shows 33 high income countries in our sample. Seven of these did not have inclusive growth in any of the three decadal periods; another 7 had one episode; 15 had inclusive growth for two of the three decades; and 4 had inclusive growth for all three decades.
The first three rows classify countries by income level. The next 7 rows classify them by region. The last 4 rows classify them by a long-term national characteristic (at the beginning of the period).
We do not find significant variation across these classifications. In each case, we find that countries mostly have had 2 episodes of inclusive growth in the thirty-year period; one episode is the next most common frequency. The tails—either inclusive growth over all periods or none of the periods—are the least common. About 30 percent of all countries fall into one or other of these tails.
Table 1: Episodes of Inclusive Growth, 1990-2019
| Number of Inclusive Growth Periods | |||||
| Category | 0 | 1 | 2 | 3 | TOTAL |
| High Income | 7 | 7 | 15 | 4 | 33 |
| Middle Income | 4 | 15 | 41 | 20 | 80 |
| Low Income | 5 | 20 | 17 | 8 | 50 |
| East Asia and Pacific | 3 | 8 | 14 | 8 | 33 |
| Europe and Central Asia | 12 | 14 | 20 | 4 | 50 |
| Latin America and Caribbean | 1 | 4 | 19 | 13 | 37 |
| Middle East and North Africa | 2 | 5 | 10 | 4 | 21 |
| North America | 0 | 2 | 1 | 0 | 3 |
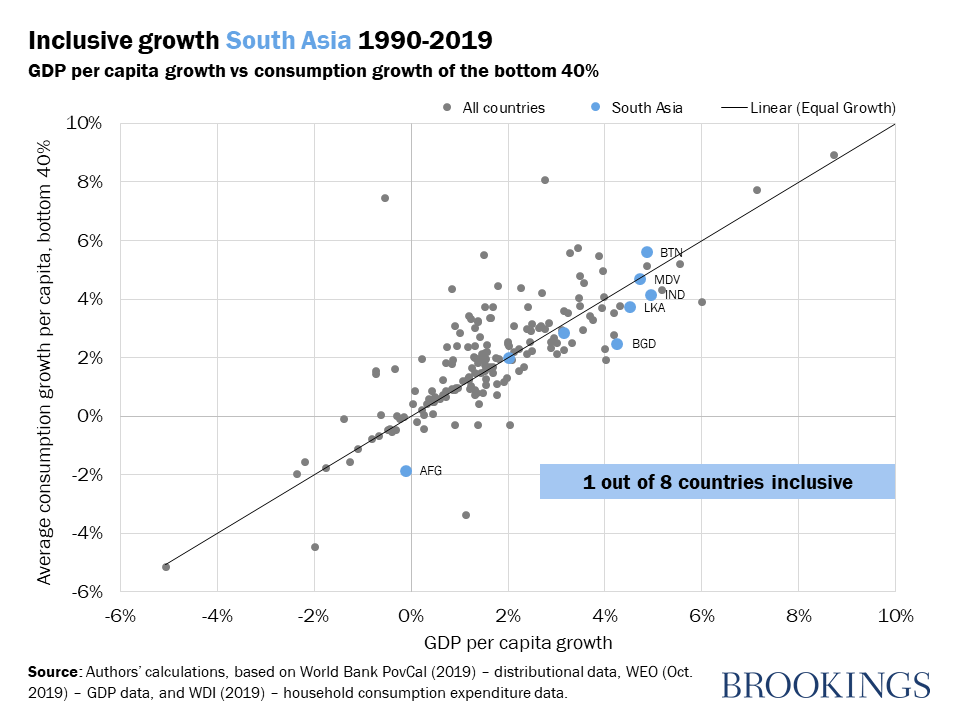
| South Asia | 2 | 5 | 1 | 0 | 8 |
| Sub-Saharan Africa | 4 | 16 | 20 | 7 | 47 |
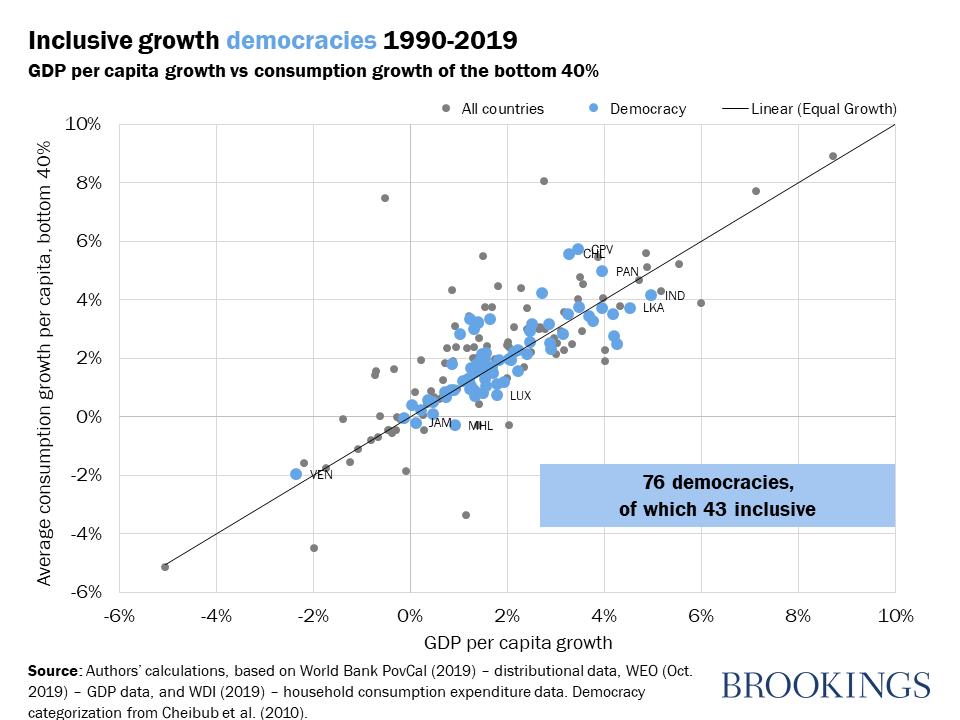
| Democracies | 9 | 21 | 32 | 15 | 77 |
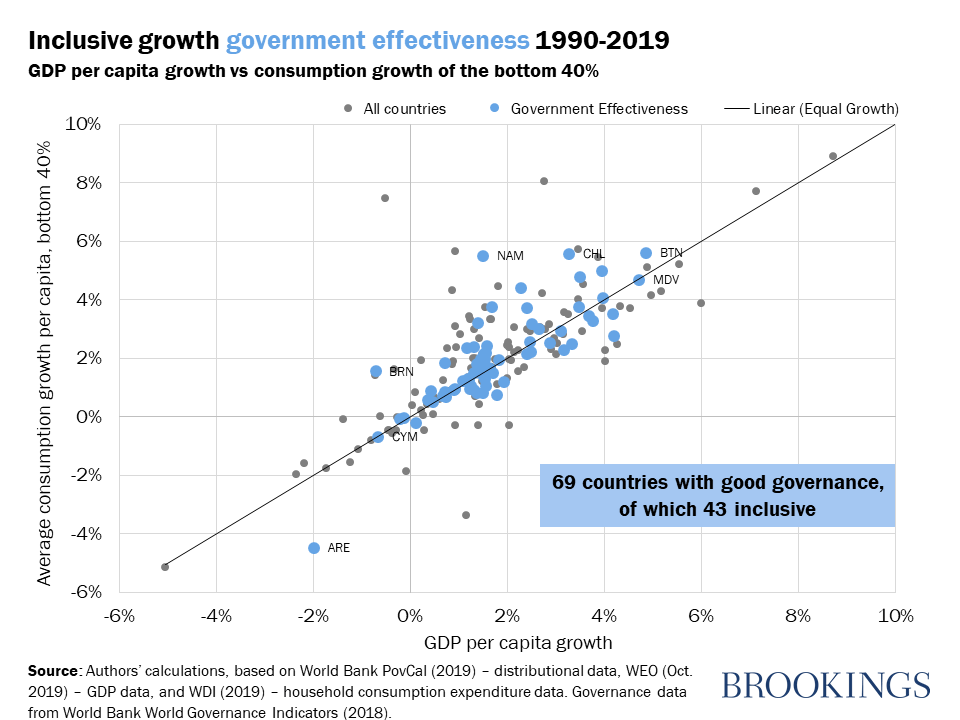
| Good Governance | 13 | 16 | 33 | 13 | 75 |
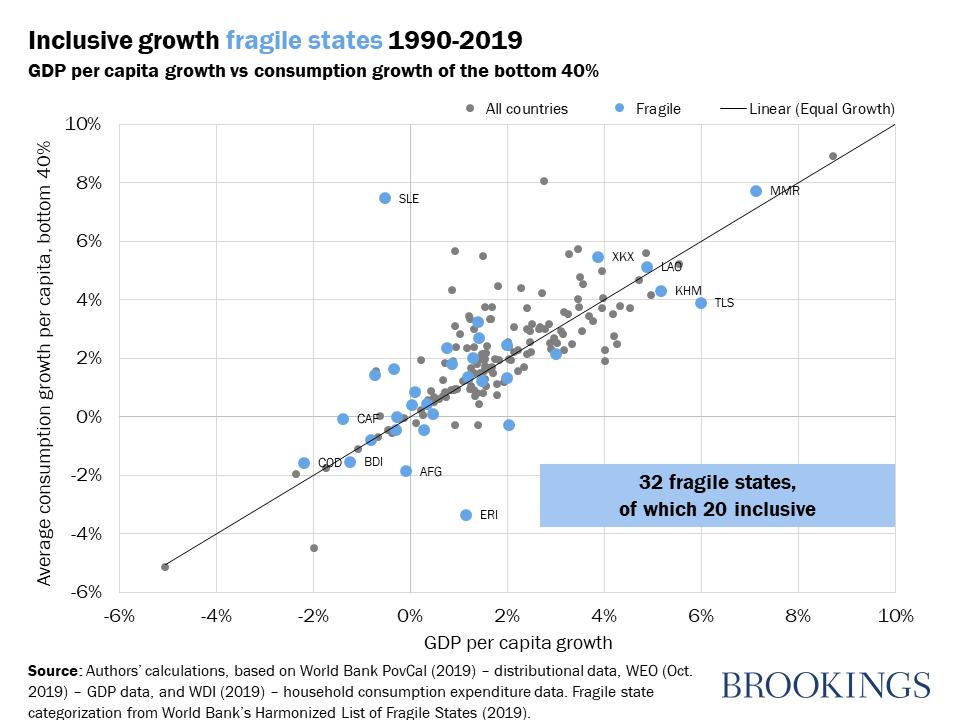
| Fragile States | 6 | 7 | 14 | 7 | 34 |
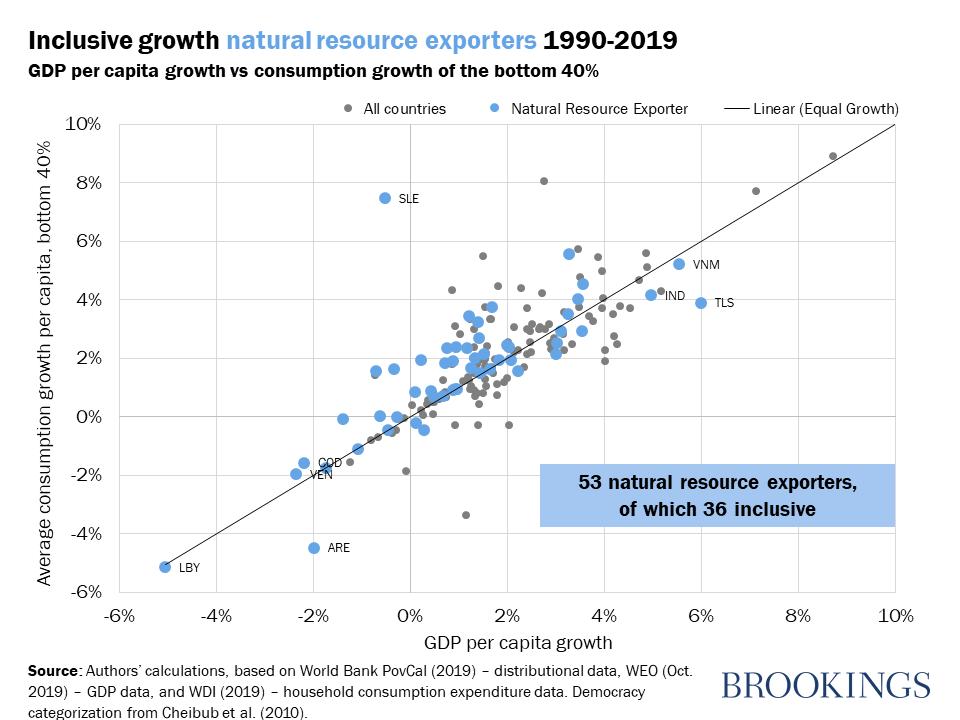
| Natural Resource Rich | 2 | 15 | 28 | 9 | 54 |
| All countries | 24 | 54 | 85 | 36 | 199 |
Source: Authors’ calculations, based on World Bank PovCal (2019) – distributional data, WEO (Oct. 2019) – GDP data, and WDI (2019) – household consumption expenditure data.
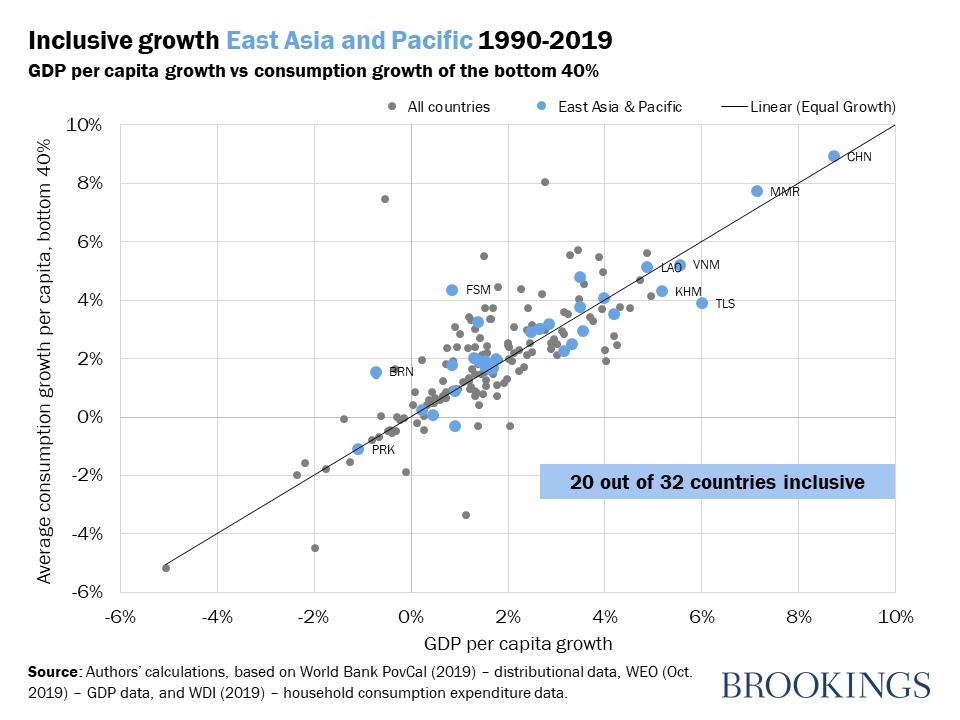
The results hold some surprises. East Asia is often viewed as a region that has had great success in achieving growth with equity, while Latin America is commonly portrayed as a region with substantial inequality. But actually it would appear that Latin America has had more country-decade inclusive growth episodes than East Asia in the last 30 years. East Asia’s relative success in reducing poverty and building the middle class has more to do with the level of growth, compared to Latin America, than to the inclusive character of that growth.
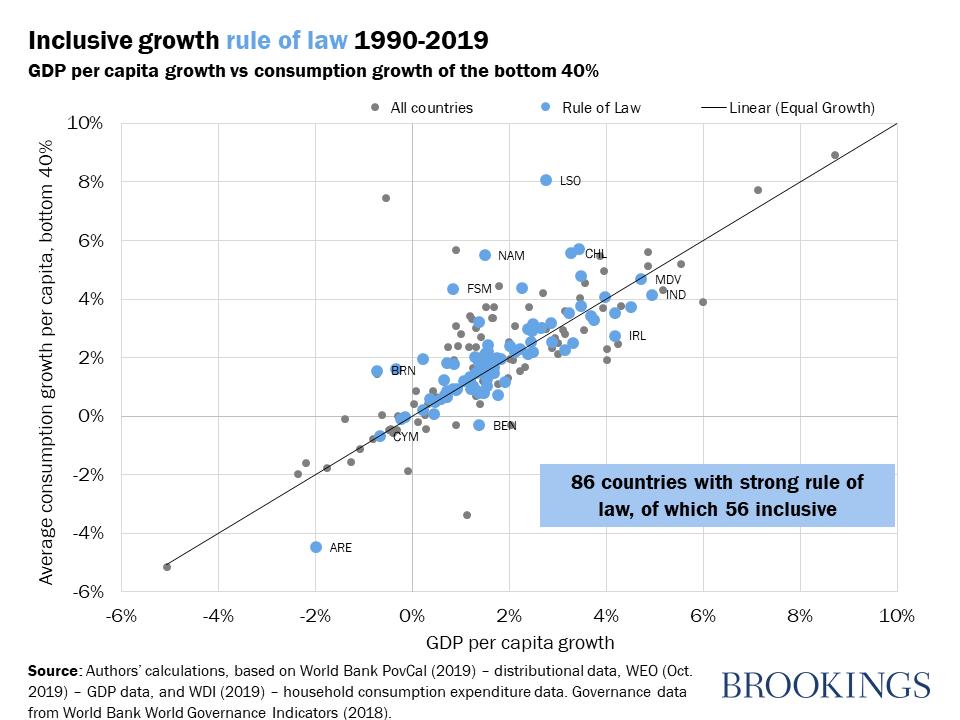
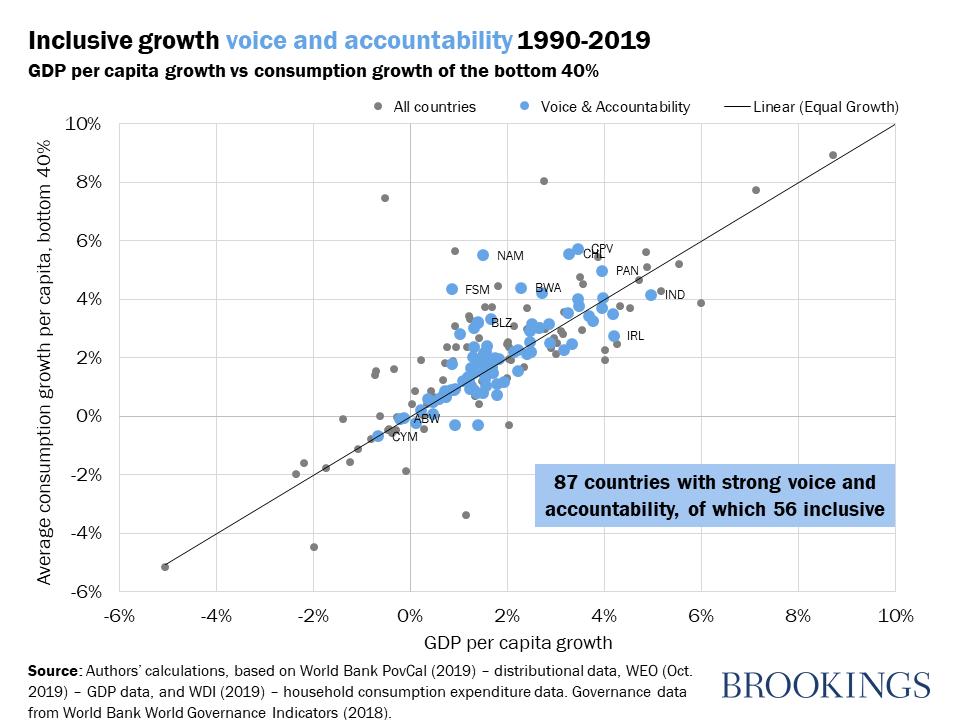
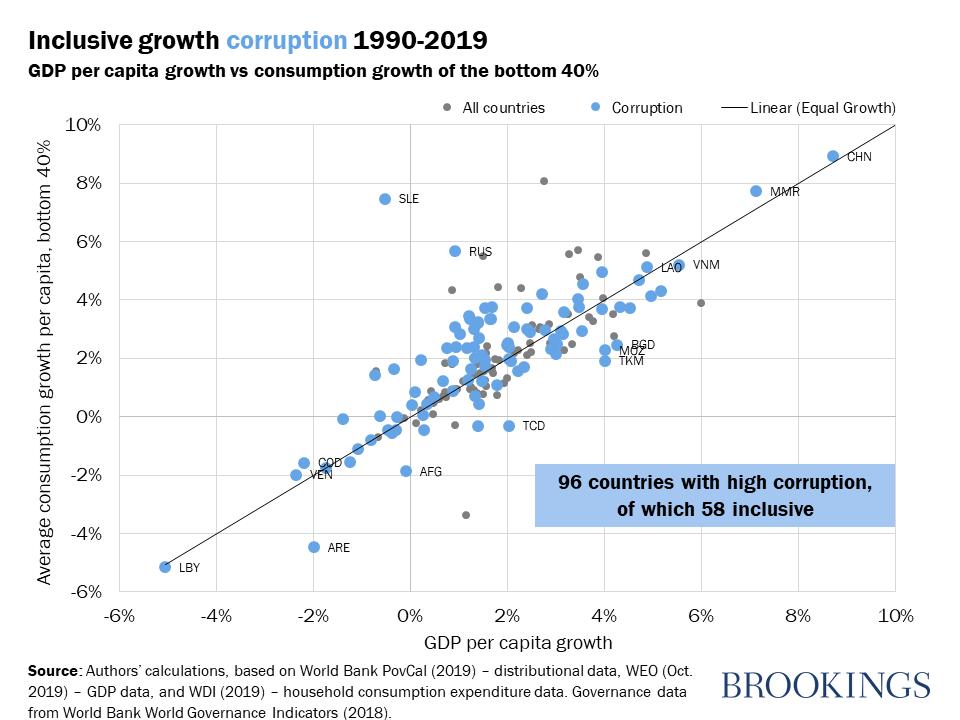
Another surprise is that long-term country characteristics do not seem to matter much. Growth in natural resource rich countries, where GDP is often concentrated in mineral extraction sectors, has a very similar impact on consumption of the poorest 40 percent as in other countries. We defined resource rich countries as those where natural resources comprised at least 20 percent of total exports in 1990 (IMF’s threshold for resource-rich developing countries), and used trade data from the Harvard Atlas of Economic Complexity to classify countries. Fragility, using the World Bank’s harmonized List of Fragile States, also does not seem to affect frequency of inclusive growth episodes. Democracies, using Cheibub et al. (2010)’s democracy and dictatorship dataset and country definitions in 1990, do not have more inclusive growth. Countries with good governance, using the World Governance Indicator on government effectiveness, also have similar patterns on inclusive growth. As a robustness check, we looked at other measures of governance, such as corruption, voice and accountability and rule of law, again dividing the sample of countries into those above and below the mean, and found similar frequencies of country-decade episodes of inclusive growth.

What does it all mean?
The growth in consumption of the bottom 40 percent depends on both average GDP per capita growth and on the pattern of its distribution. Over the last 30 years, most countries fall into the range of -2 percent to +4 percent growth per year. Compounded over 30 years this has large consequences—over a six-fold difference in income levels. But the distributional consequences of growth also matter. For any given average growth rate, there is a range of around 4 percentage points between the consumption growth of the most inclusive performers and the least inclusive performers. This translates into a threefold difference in income over 30 years.
The policy issue then becomes one of finding the right combination that delivers both rapid growth and more inclusive growth. While our work is not conclusive in this regard, we can say that many of the traditional institutional growth drivers, like good governance, absence of fragility or diversification away from natural resource exports do not seem to have corresponding effects on inclusiveness.
One final caveat. The careful reader may have noted that we build our data on consumption growth by distributing household expenditure from the national accounts across income groups using household survey data. An alternative is to simply use household surveys directly. This lowers consumption growth of the bottom 40 percent by an average of 0.5 percent per year and, in many cases, by far more. The point is that we simply do not know how to allocate the missing consumption that arises because national accounts and household surveys are not properly aligned. Without an understanding where this missing consumption goes, our ability to truly understand inclusive growth will be tentative, at best.
Authors


Commentary
How inclusive is growth?
November 22, 2019