The resource-curse literature is full of recommendations that resource-rich countries should try to diversify their exports. This is based on the empirically well-founded proposition that countries with diversified exports tend to grow faster in the long run. However, for at least one subset of resource-rich countries, namely, those rich in hydrocarbons (oil and gas), diversification is easier said than done.
To see this, consider the experience over the past 40 years of countries whose oil and gas exports were more than 50 percent of total exports on average during 1970-1980. These 17 countries may be said to have been “swimming in oil” during the 1970s. How many of them were able to achieve significant export diversification over the next three decades?
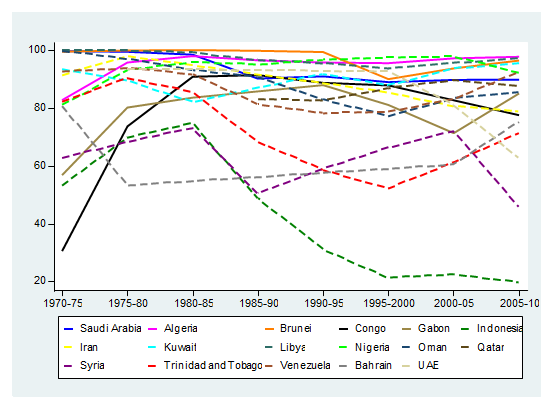
First, we have to define what we mean by “significant export diversification.” Let us say that this means achieving a hydrocarbon export share that was at least 20 percentage points lower on average during 2000-2010 (the ending decade) than during 1970-1980 (the starting decade). The chart below shows the evolution of oil and gas export shares for the 17 countries during 1980-2010 (using data sourced through the World Integrated Trade Solution).
Only 2 of the 17 countries meet our test of significant diversification: Indonesia and the United Arab Emirates. Indonesia’s oil export share declined steadily from a high of 75 percent during 1980-1985 to less than 20 percent by 2005-2010. For the UAE, the relevant share was 93 percent in 1970-1980 and stayed relatively high for the next twenty years before beginning to decline to its 2005-2010 average of 63 percent.
Figure 1. Oil and gas exports as a percentage of total exports

The failure of the vast majority of oil and gas exporters to diversify over three decades suggests how hard diversification is. The chart also shows that for some countries there have been periods of significant diversification when hydrocarbon prices were low (such as the period from 1985 to 2000) but these trends were reversed when prices rose again (during 2000-2010). For instance, Trinidad and Tobago’s oil export share fell from 86 percent in 1970-1980 to a low of 52 percent in 1995-2000 before rising again to above 70 percent in 2005-10.
What accounts for the success of Indonesia and the UAE? Both are substantial exporters of nonoil goods and services. Starting in the 1980s and accelerating thereafter, Indonesia became a big exporter of labor-intensive manufactures such as textiles and footwear as well as of primary-resource-based items like palm oil and wood products. As for the UAE, the diversification is due mostly to the successful cultivation of tourism and transport service exports by one of its federating emirates, Dubai, whose own reserves of oil ran out by the 1990s (unlike those of its neighboring emirate, Abu Dhabi). Indonesia’s case is also characterized by the decline of oil output after 1990 as well as increasing domestic consumption of oil, both of which sharply reduced oil exports. For Dubai, success in establishing a major international transport hub has also meant that it has become a center for re-exporting. Re-exports contribute to the statistics and impression of export diversification.
Mexico and Norway have been mentioned in the literature as successful cases of export diversification among hydrocarbon-rich countries. However, they are not captured in our definition of “swimming in oil” in the 1970s. They would have qualified had we defined our starting period to be 1980-85, which was when their hydrocarbon shares in exports first exceeded 50 percent. Like Indonesia, Mexico has developed a successful export industry based on labor-intensive manufactures, boosted tremendously by the North American Free Trade Agreement with the United States and Canada. Norway, however, is not a successful diversifier by our definition; its oil share in total exports has actually been increasing steadily since the mid-1980s and currently stands at above 60 percent.
The Brookings Institution is committed to quality, independence, and impact.
We are supported by a diverse array of funders. In line with our values and policies, each Brookings publication represents the sole views of its author(s).


Commentary
It’s hard to diversify when you’re swimming in oil
March 31, 2015