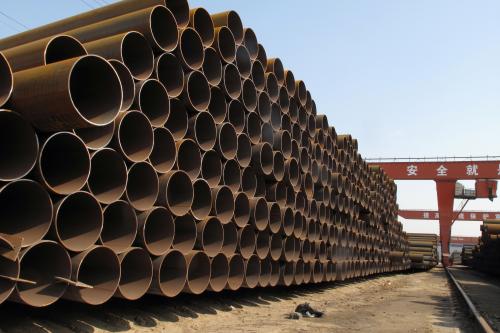
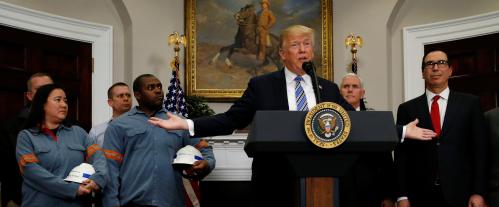
Earlier this week, President Trump moved forward with his plans to impose tariffs on both steel and aluminum imports into the United States, now set to go into effect on March 23. Brookings experts have responded by commenting on several elements of this policy including why tariffs would be controversial, how they could lead to a trade war, and, though they are initially exempt from President Trump’s formal order, how this would impact trade and NAFTA renegotiations with Mexico and Canada. Below, we’ve highlighted a few charts and graphs from their research.
MISSOURI, LOUISIANA, CONNECTICUT, AND MARYLAND RELY MOST HEAVILY ON STEEL AND ALUMINUM IMPORTS
Brookings experts Max Bouchet and Joseph Parilla explain three possible consequences, one positive and two negative, that Trump’s tariffs could have on U.S. regional and state economies. In their analysis, they examine which states’ production relies most heavily on steel and aluminum imports by measuring the share of those products of states’ total imports. They find that in four states—Missouri, Louisiana, Connecticut, and Maryland—aluminum and steel imports account for at least 5 percent of total state imports, double the share of the nation’s 2 percent total.
Bouchet and Parilla also note that even with NAFTA exempt, tariffs would still apply to other strategic partners. Illinois, for example, imports 41 percent of its steel from Brazil and 29 percent of its aluminum from China.
SMALL, MANUFACTURING-ORIENTED AREAS ARE MOST RELIANT ON EXPORTS
In a similar piece from last year, Joseph Parilla and Mark Muro examined which U.S. metropolitan areas are most dependent on trade and susceptible to trade shocks. They find that while large regional economies like New York and Los Angeles are leaders in terms of overall volume of trade and exports, “export intensity—measured as the export share of GDP—is highest in smaller energy- and manufacturing-oriented metros.” In Columbus, Indiana, for example, over half of the economy is driven by exports.
THE MIDWEST DEPENDS ON NAFTA-ENABLED TRADE
John Austin, an expert in the Metropolitan Policy Program, points out that while President Trump may be motivated to deliver on his anti-trade rhetoric and campaign promises, tariffs are unlikely to help the Midwestern voters and communities that helped propel his Electoral College victory. Austin writes that “the Rust Belt is at the center of this export economy, generating 26 percent of export-derived GDP.” And further, that NAFTA nations are “leading export markets for the 11 Midwestern states, which together account for 48 percent of all U.S. exports to Canada, and 21 percent of all U.S. exports to Mexico.”


Commentary
Charts of the week: President Trump’s tariffs and trade negotiations
March 9, 2018