
This analysis was published in full on March 13, 2025, with work permit data through January 2025. For the most recent work permit data, see this tracker.
For immigrants to work in the United States legally, they generally must obtain work authorization. Immigrants with particular legal statuses, such as those seeking parole or asylum status, request authorization by applying for Employment Authorization Documents, commonly called work permits. Tracking work permit applications can illuminate how changes in the pace of immigration are affecting labor supply. If immigration policy changes or other factors dampen net migration to the United States, work permit applications should be an early indicator of how much and when the decline in certain kinds of immigration will slow labor force growth.
So far, the widely discussed decline in people crossing the U.S. border since mid-2024 has yet to significantly slow the number of people obtaining work permits, as there is a delay between when an immigrant arrives in the country and when a work permit is received. Some new immigrants that will be eligible for work permits must wait months before applying, and the approval process itself takes time. Consequently, although immigration slowed significantly in the summer of 2024, approvals of work permits were higher in the fall of 2024 than during the comparable period of 2023. The higher number of approvals last fall reflects the high number of new immigrants prior to mid-2024 and the large number of applications these immigrants submitted.
Eventually, however, reduced immigration will result in sharply fewer applications; in fact, during the fall of 2024 the growth rate of applications slowed. In turn, a lower number of applications will result in fewer approvals regardless of whether future policy changes slow immigration even further (as we expect). To the degree that the lower number of approvals reflects fewer recent immigrants who would have been eligible for permits, the dampening effect on labor force growth is straightforward, and the work permit data are a timely read on that effect. At the same time, the work permit data offer no explicit information about the extent of undocumented immigration or the supply of labor among immigrants unauthorized to work in the U.S.
In January 2025 permit applications were very high, totaling more than 500,000 (or more than six million at an annual rate). That number was significantly larger than in January 2024 and stood in contrast to the generally slowing trend in application growth during fall 2024. January applications were likely elevated because some immigrants who were eligible to submit applications in January—but who had planned to apply later—accelerated their applications in order to get ahead of any potential rule changes regarding application eligibility. If eligibility concerns continue to accelerate applications, then the expected declines in permit applications and approvals may be delayed, temporarily offsetting the effects of immigration restrictions and deportations on labor supply growth to the degree that immigrants who have applied for work permits are waiting for approval before applying for jobs.
By following permit applications and approvals throughout 2025, we can get a sense of how immigration restrictions are likely to affect labor supply growth over time. As part of this analysis, we have produced an interactive tool with data on work permit applications through January 2025. It will be updated when new data become available every month (historically at the end of the month) and quarter (historically two months after the end of the quarter) with the number of applications, approvals, and denials, as well as pending applications that have yet to be approved. The interactive tool reports more detailed data on applications by separately reporting initial applications and renewal applications, but those data are available only on an annual basis through fiscal year (FY) 2024.
While the interactive is embedded below with data through January 2025, the interactive tool that will be updated going forward can be found here.
“Change from prior year” measures the difference between the current period and the same period in the prior year (year-over-year prior; quarter-over-four quarters prior; month-over 12-months prior). Total applications also include “replacement” and “not requested” permits, which are not separated out in this tool or analysis.
The surge in immigration boosted work permit applications through 2024
For immigrants to work in the United States legally, they must generally obtain work authorization. In some cases, work authorization is granted through employment-based visas, such as H-1B visas, which are based on specialty occupations or merit, or H-2A visas, which are given for temporary agricultural work. Immigrants may also receive permanent employment-based visas (such as First Preference, EB-1) based on job skills; temporary employment visas for students and exchange visitors or short-term business; or authorization to immigrate as an entrepreneur.
During the last few years, however, Employment Authorization Documents, which are commonly called work permits, have been the type of work authorization experiencing the sharpest growth. Obtaining a work permit is an avenue for immigrants with particular legal statuses to receive authorization to work in the United States. Eligible statuses include people seeking refugee or asylum status; spouses of certain visa holders; certain student trainees; and foreign-born people who were victims of abuse that took place in the United States.
Most immigrants who have recently applied for work permits are people that the Congressional Budget Office (CBO) labels “Other Foreign Nationals” or OFN. OFNs eligible to apply for work permits include:
- People in the United States applying for asylum;
- People paroled into the United States under special programs, such as United for Ukraine or a separate program for Cubans, Haitians, Nicaraguans, and Venezuelans; and
- People who have been granted delays in removal via deferred action or temporary protected status (TPS).
The Department of Homeland Security’s (DHS) U.S. Citizenship and Immigration Service (USCIS) manages the work permit application process, and all people applying for work permits are “inside” the U.S. immigration system. Although CBO’s OFN category also includes undocumented immigrants, who are outside the immigration system, undocumented immigrants are not eligible to apply for work permits.
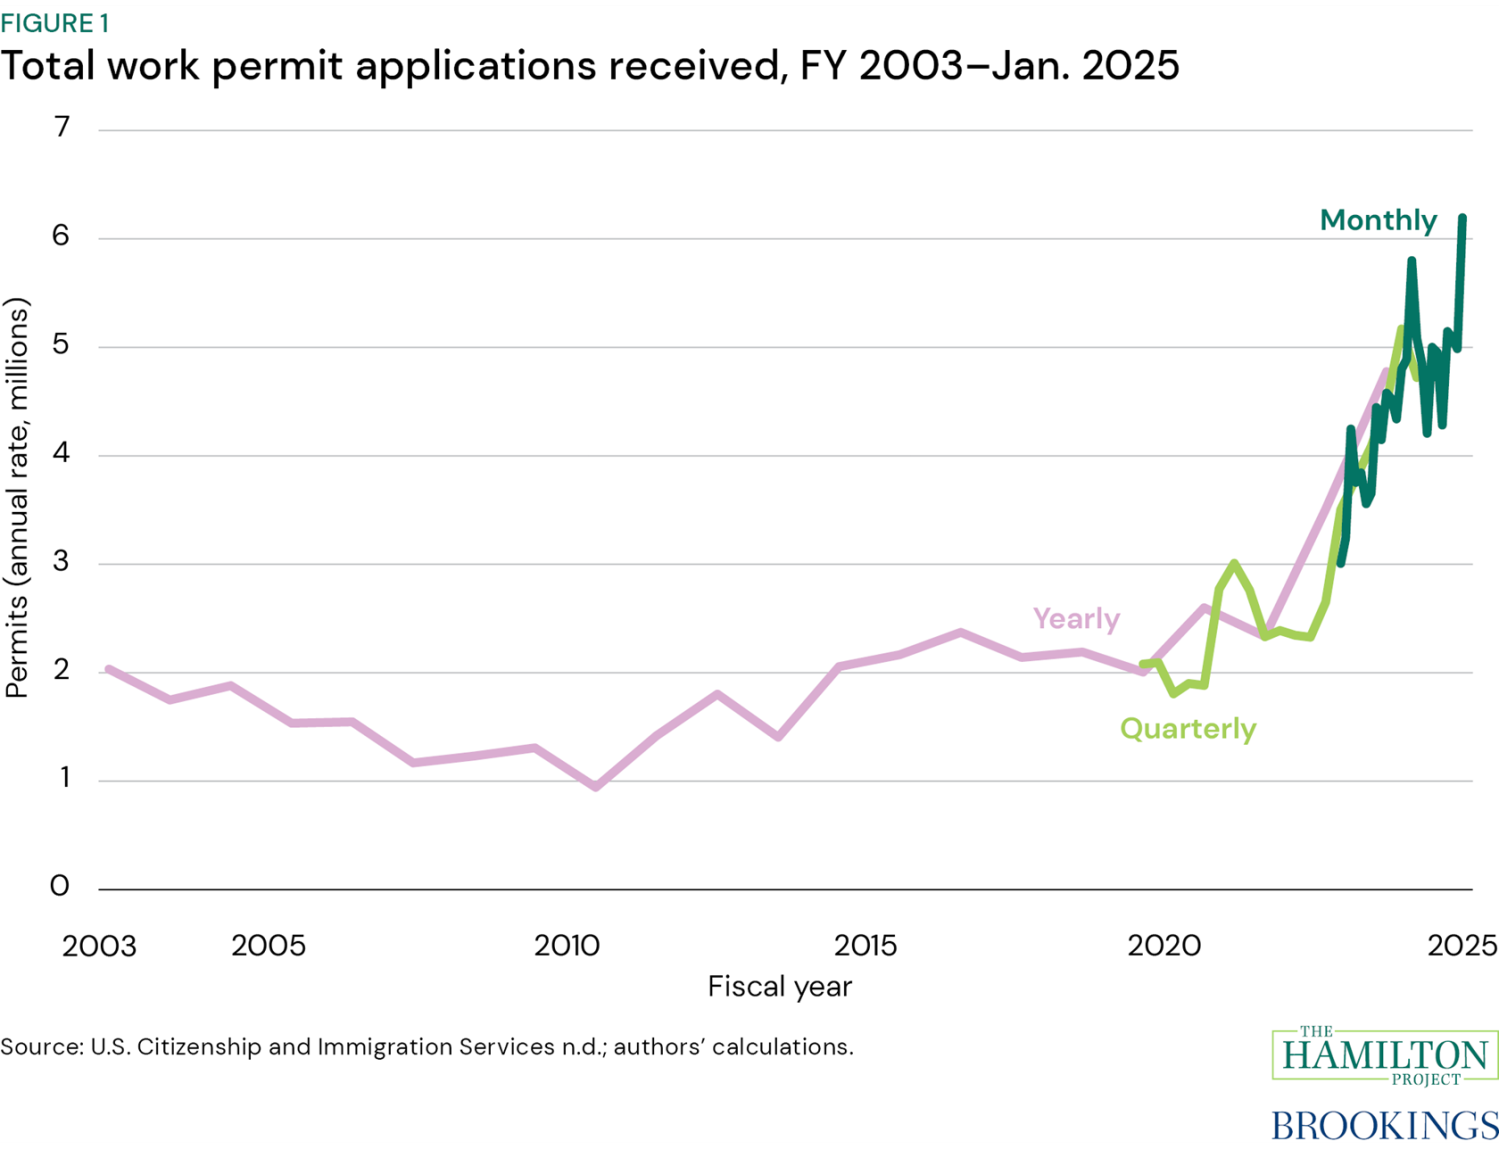
CBO has documented that OFN immigration surged from FY 2022 to FY 2024. Separate data from USCIS (figure 1) show that applications for work permits have surged as well. The accompanying work permit interactive is built from these data for fiscal years 2003 to present. The “Total applications” tab shows work permit applications by varying frequencies (monthly, quarterly, and annually by fiscal year) and status (received, approved, denied). The increase in work permits in recent fiscal years can be seen in this figure: Total applications increased by 1.2 million from FY 2022 to FY 2023 and then by another 1.3 million in FY 2024, reaching 4.8 million applications. Before FY 2022, the largest year-over-year increase was about 650,000 in FY 2015.
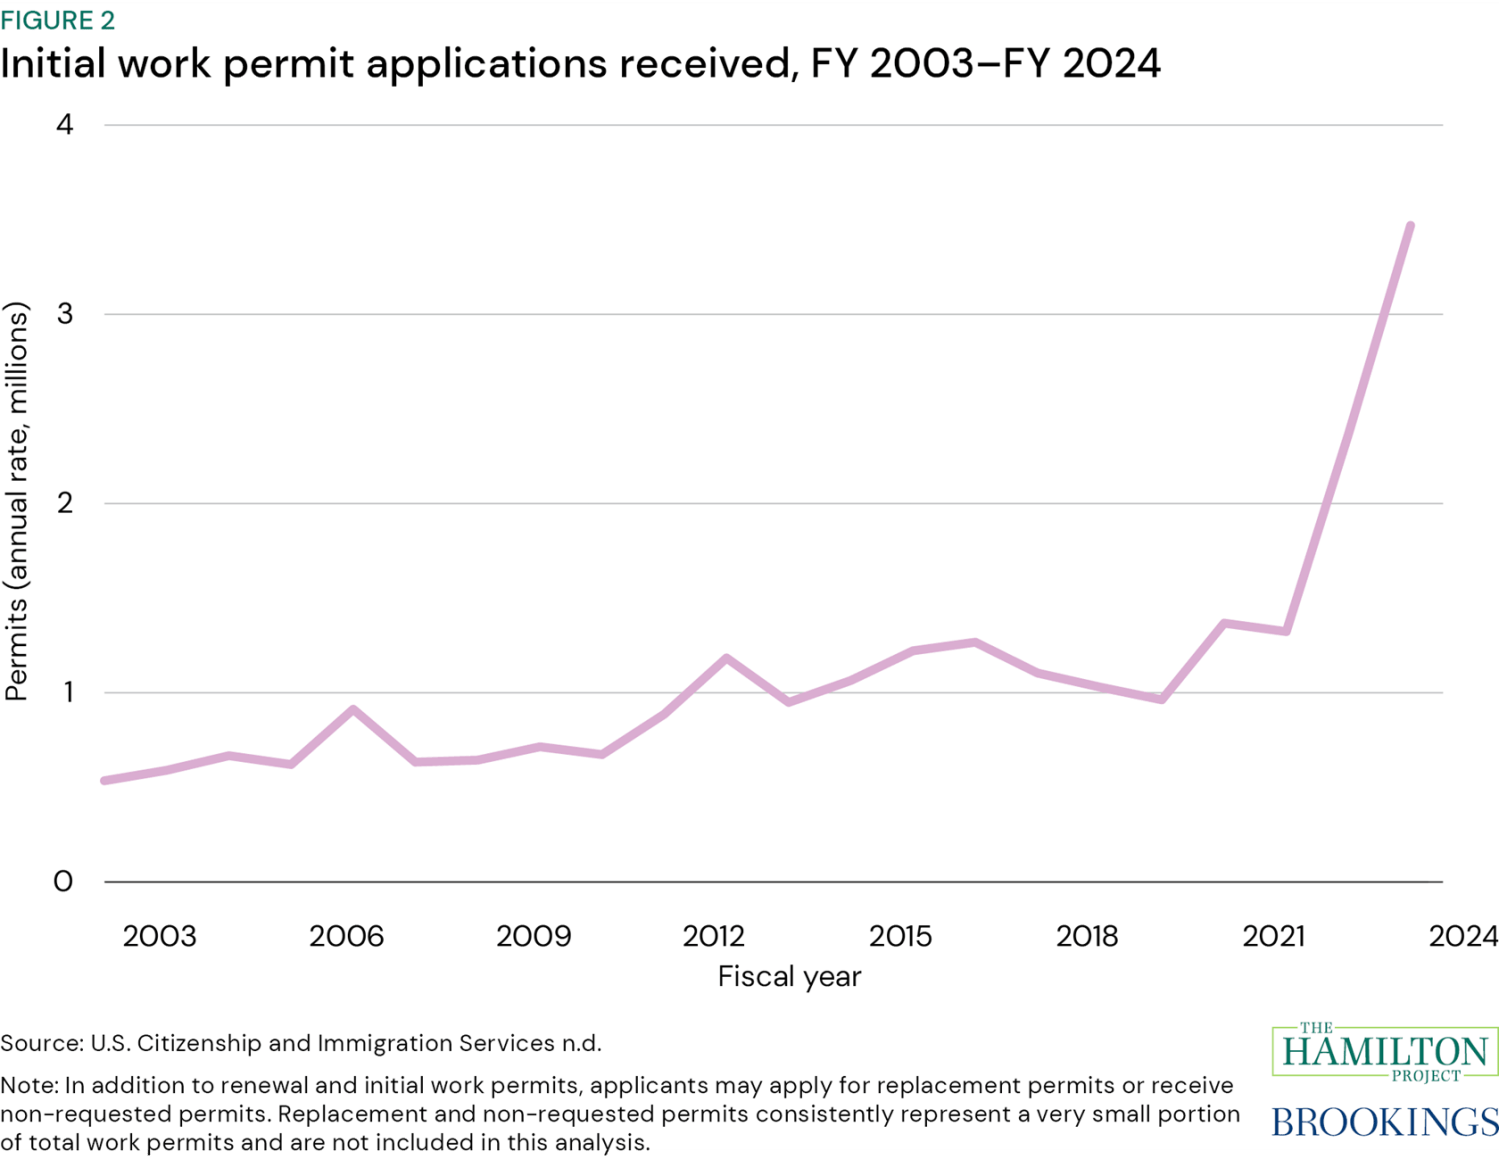
The total applications graphed in figure 1 overstate the number of new immigrant workers who have entered the labor market after receiving a permit, however, because some of those applications are renewal applications from people who already have work permits. Initial work permit applications (figure 2; the “Initial applications” tab of the interactive) are a better indicator of the number of new workers with permits. Figure 2 shows that initial applications grew by about 1.0 million in FY 2023 and 1.1 million in FY 2024. (The largest previous increases were about 400,000 in 2021 and about 300,000 in 2013.) Most of the remaining increase in total applications in FY 2023 and FY 2024 was comprised of renewal applications, which increased by about 120,000 and 150,000, respectively. Overall, initial applications accounted for 67 percent of total work permits in FY 2023 and 73 percent in FY 2024.
Although initial applications are a more useful series to understand labor market developments than total applications, only total applications are available on a timely basis. Data through FY 2024 show that initial and total applications clearly move together but caution should be used in interpreting changes in total applications because the relationship changes somewhat over time. That owes to two main reasons. First, the number of immigrants who are eligible to apply for work permits depends on policies that govern legal immigration statuses. The Secretary of the Department of Homeland Security has discretionary authority over the designation and implementation of these statuses, including parole and temporary protected status. Changes in DHS policies could change the pool of immigrants who are eligible to file for either initial or renewal work permits.
A second reason that the initial-application share could evolve is that the number of years that different types of work permits remain valid could change. Many permits are now valid for five years, but maximum validity periods are subject to USCIS guidance—five-year validity periods for asylees, asylum applicants, and refugees were instituted under new guidance in September 2023. A future policy change that requires more frequent renewals would raise the renewal share of total applications and reduce the initial share.
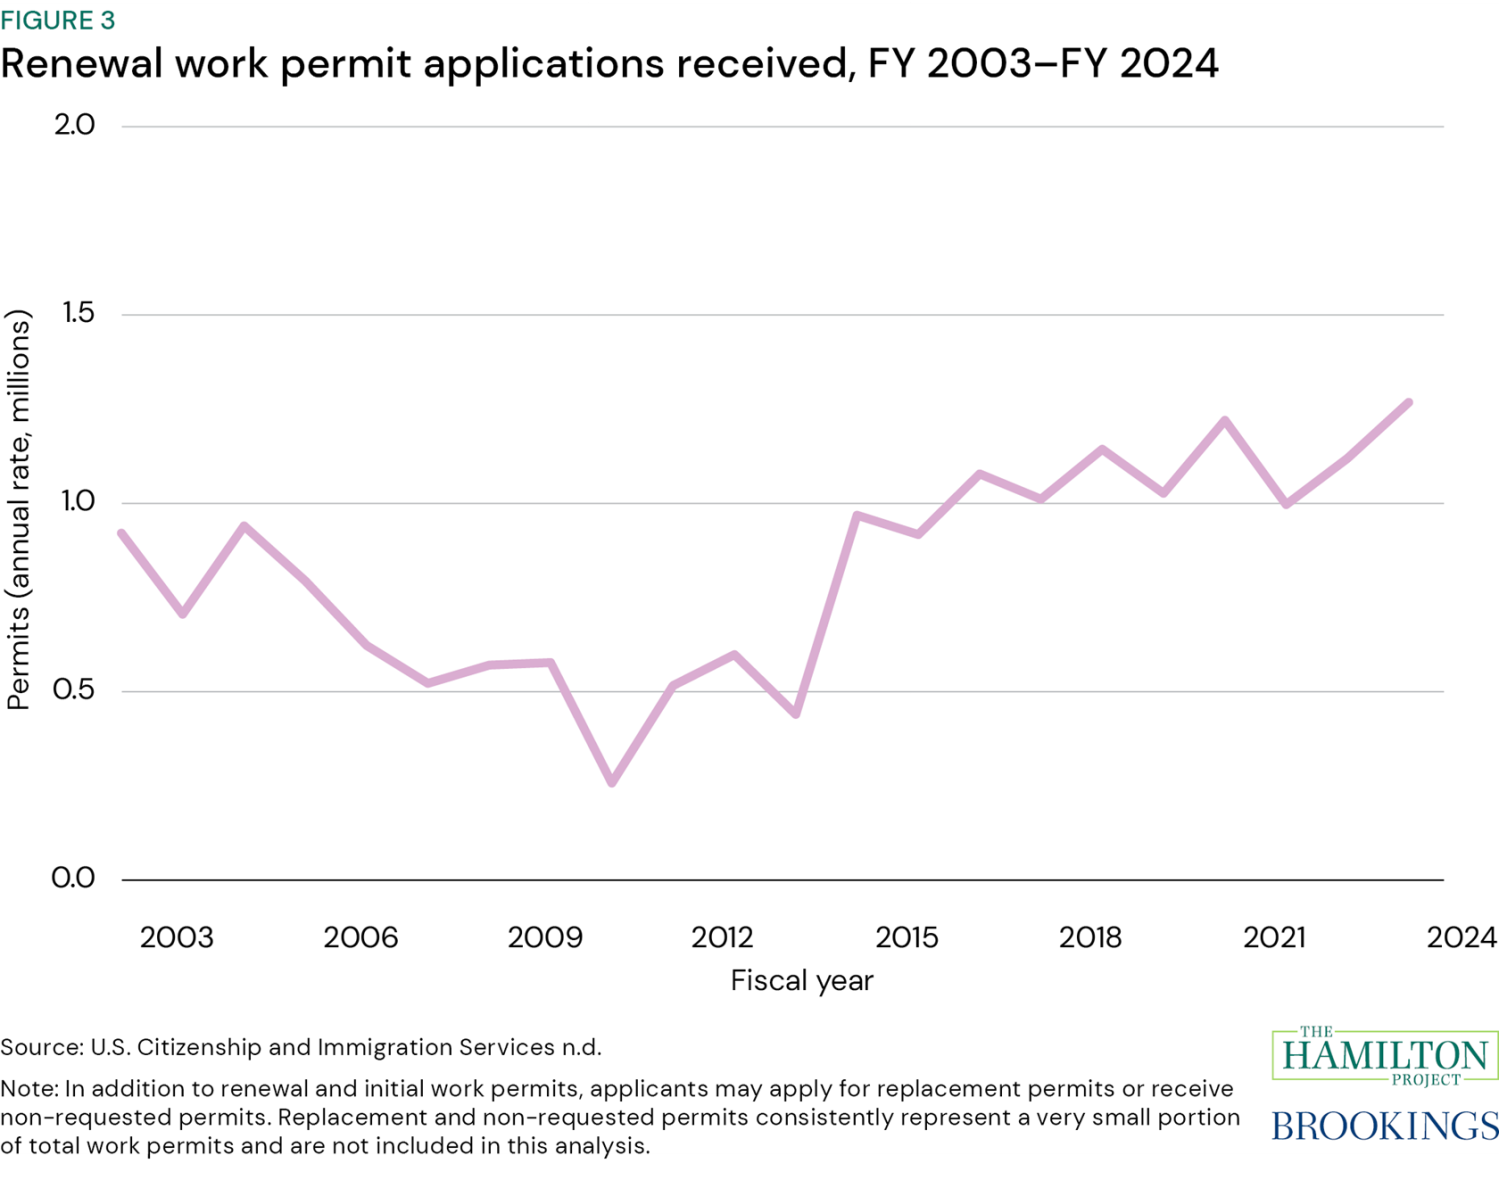
One way to quantify recent above-normal additions to the labor force accounted for by recent immigration is to determine how much initial work permits exceed their trend growth (Chris Foote’s recent work offers a key example of this method). Initial applications outpaced previous trend growth from FY 2003–2019 by 1.0 million in FY 2023 and 2.1 million in FY 2024. In addition, renewal applications (figure 3; the “Renewal applications” tab of the interactive) were about 190,000 and 320,000 above their linear trend in FY 2023 and FY 2024, respectively.
Immigrants who file a work permit application must document under which eligibility category they are applying. The eight eligibility categories that are most closely related to immigration policy developments in the last four years accounted almost entirely for the surge in initial work permits seen in FY 2023 and FY 2024. Among these categories, asylum applicants and public interest parolees have accounted for more of the growth in initial applications than the other six categories combined. In particular, of the 1.1 million increase in initial work permit applications in FY 2024, 750,000 was comprised of asylee applicants and public interest parolees. The other six categories together account for about 250,000 of the overall increase. That work permit applications grew among these populations is consistent with higher levels of asylum claims and policies that increased access to parole for immigrants of specific nationalities over this period.
The surge in work permit applications helps explain the recent increase in labor supply
The permit application process is an essential step for immigrants to enter the workforce legally, but this process takes time. First, an OFN who is eligible to apply for a work permit must initiate the application. To do so, immigrants must demonstrate their eligibility to apply for a permit to USCIS, often by providing an immigration form or immigration judge order for an underlying protected claim or legal status. The time it takes to obtain proof of a protected status can vary widely by immigration category. Asylum seekers may apply for work authorization before officially receiving asylum, but they must demonstrate that their application for asylum has been pending for at least 150 days. Similarly, immigrants with pending Temporary Protected Status forms may apply for work permits and receive prima facie eligibility from USCIS. These concurrent TPS and permit applications, however, vary widely in processing time by nationality and processing center and may take as long as two years. For people with other immigration statuses—such as immigrants seeking deferred action—eligibility to apply for a work permit requires proof of approval of a legal status, which can also take considerably longer than 150 days.
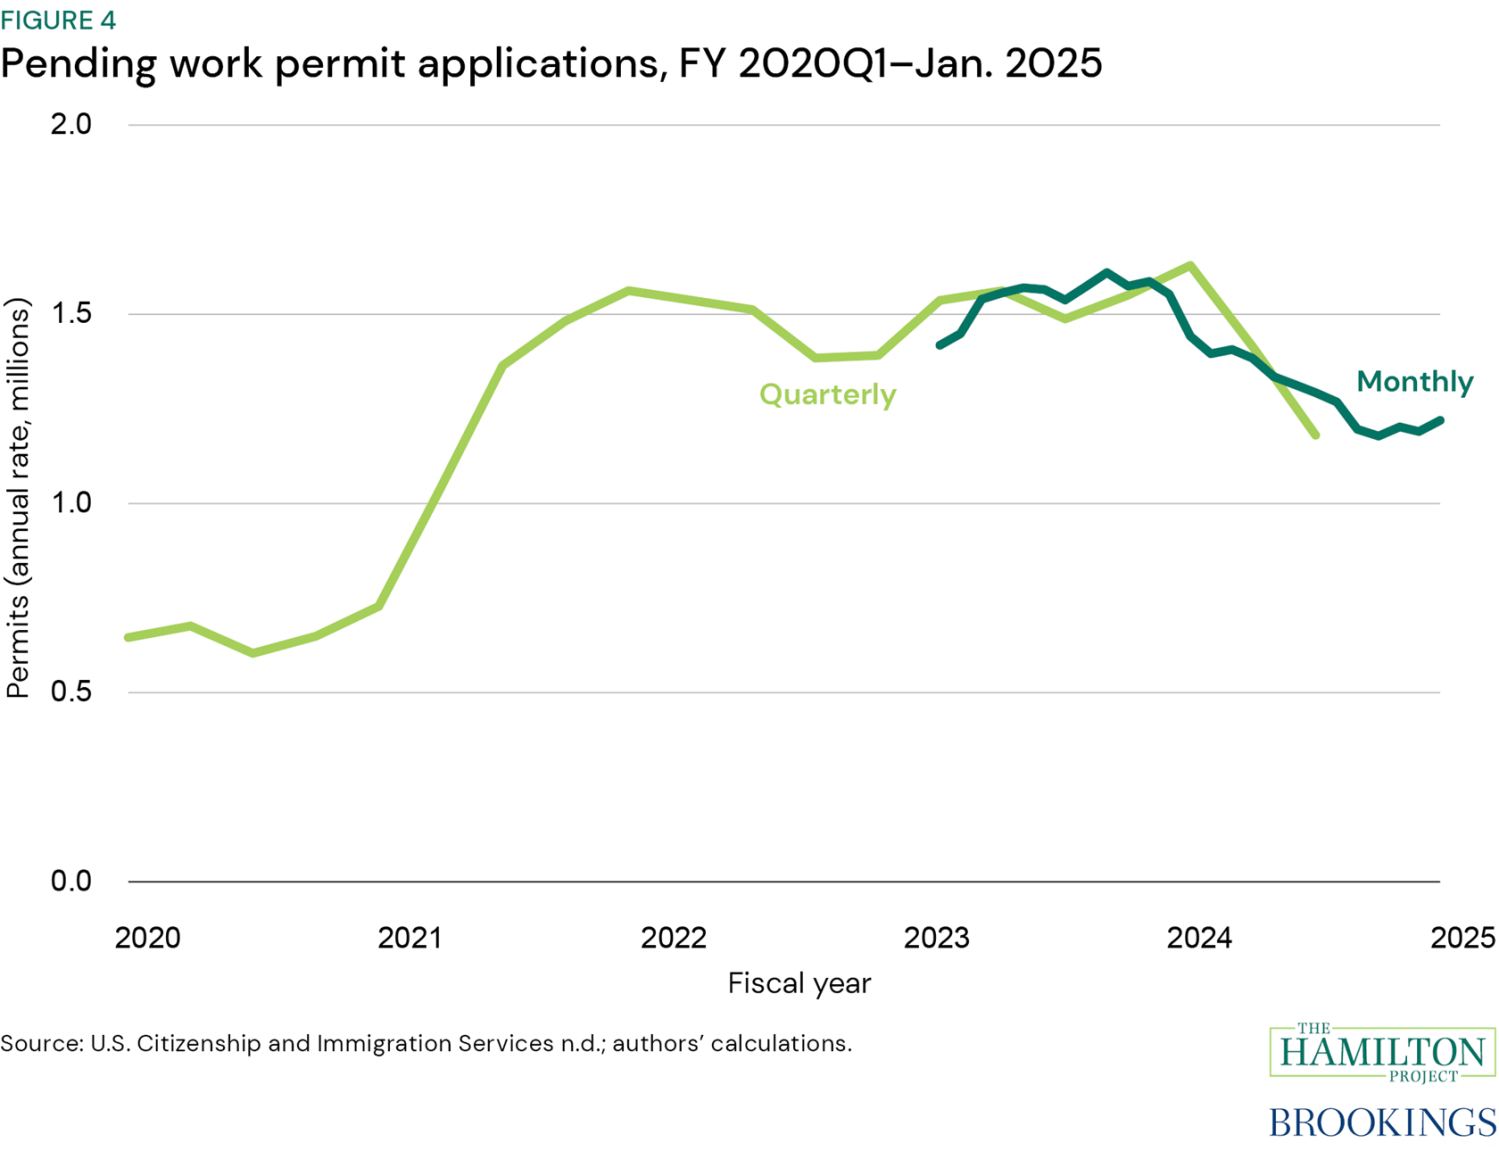
After eligibility to apply has been established and the permit application has been submitted, the application must then be approved. The average processing time for applications completed in December 2024 was about three months, down from about six months in January 2023. Similarly, the number of applications pending for more than six months trended downwards over 2023 and 2024 but remained elevated at more than 500,000. At the end of FY 2024, more than one million permits had not received a decision, down from a peak of 1.6 million in early 2024 (figure 4). Most applicants who receive a decision will have their application approved—since FY 2022, 89 percent of applications that received a decision were approved, only slightly lower than the average approval rate of 92 percent since FY 2003. Then, an OFN immigrant with a work permit must decide whether to seek employment.
A good check on the usefulness of the permit data as a measure of additional labor supply is to calculate an implicit labor force participation rate (LFPR) of recent immigrants by dividing the number of initial permit applications by the number of immigrants eligible to apply for them. We use CBO’s OFN figures to estimate the number of immigrants who were potentially eligible to apply for a work permit between FY 2021 and FY 2024. We estimate that roughly five million adult (16+) immigrants eligible to apply for permits entered the United States between 2021 and 2024. A little over three million initial work permit applications were submitted between FY 2021 and FY 2024 over and above the number that would be predicted by the prior trend growth.
The ratio of those two figures suggests that about 60 percent of eligible adult OFN immigrants from the recent immigration surge applied for work permits. That implicit LFPR of recent immigrants compares well with existing data on the LFPRs of new immigrants. Data from the Census Bureau’s American Community Survey (ACS) indicates that 54 percent of immigrants entering the country in 2023 reported being in the labor force that year. Immigrant LFPRs increase marginally with each additional year in the United States until six years, at which point the LFPR of immigrants is roughly 76 percent.
Interpreting the current fiscal year’s work permit application data
Monthly data on total work permit applications is available for the current fiscal year. The “Total applications” tab of the interactive shows receipts, approvals, and denials as well as pending applications and average processing times for total applications as of January 2025. It will update monthly and quarterly here. While these timelier work permit application data do not distinguish between initial applications and applications for renewal, these topline numbers can offer more-frequent insights into how changes in immigration may be affecting the labor market.
Estimated immigration slowed significantly beginning in summer 2024 among those most likely to be eligible to apply for a work permit. In June, former President Joe Biden issued a presidential proclamation, alongside a joint interim rule by DHS and the attorney general, that restricted people’s ability to claim asylum or other protections when crossing the border without authorization. An additional presidential proclamation and joint final rule followed in September.
Yet, from July 2024 to January 2025, work permit applications were higher than in the prior year. Why? Because work permit applications occur on a lag. Work permit applications from July to December were still being boosted by the surge in OFN immigration in prior months. In that sense, we should expect work permit applications to slow in the coming months, perhaps even fall below levels from the prior year, due to the changes in immigration policy put in place in summer 2024.
Applications in January 2025 were likely also boosted because eligible applicants accelerated their plans to submit applications to get ahead of potential eligibility rule changes. If applications were submitted in January that would have otherwise been submitted in future months, the coming drop-off might be even larger than implied simply by the slowdown in immigration in summer 2024.
Of course, more recent changes in immigration policy put in place by the Trump administration will also affect OFN immigration, work permit applications, and labor force growth. Trump administration policy may affect both new applications and renewals, which will pose a new challenge in interpreting the work permit data. For example, the Trump administration has rescinded previous extensions of TPS for both Venezuelan and Haitian immigrants, which—if upheld in court—would allow TPS status to expire in April and August, respectively. Additionally, the administration ended admissions under a Biden administration humanitarian parole program for immigrants from Cuba, Haiti, Nicaragua, and Venezuela. Restricting legal statuses affects both the number of immigrants currently in the U.S. who can apply for renewals of employment authorization and the number of immigrants entering the U.S. and requesting initial work authorization.
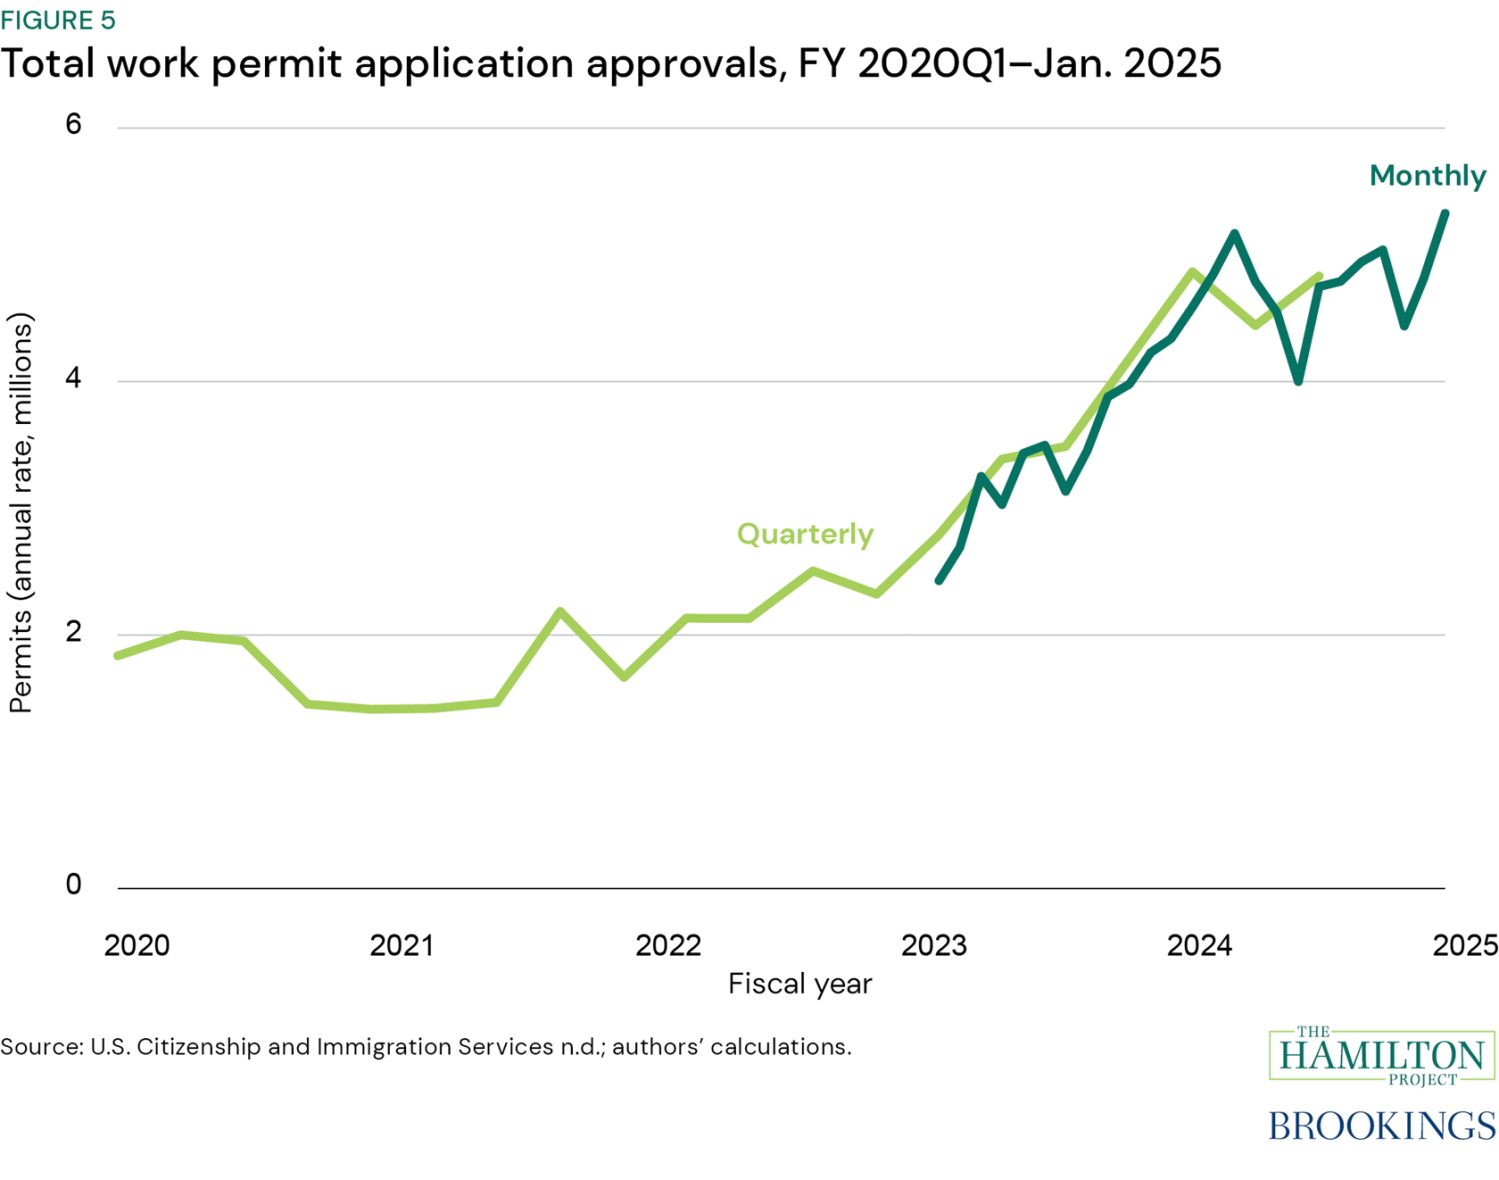
Because work permit approvals take several months, on average, approvals will likely remain elevated even after applications have slowed. For example, from July 2024 to October 2024, work permit approvals were significantly higher than in the prior year (figure 5) and grew more than application receipts. Increases relative to the prior year were smaller in late 2024 and January 2025 than in prior months; however, the boost in applications in January may result in a near-term boost to approvals in a few months.
Two other parts of the work permit process also bear watching to understand future changes to labor supply: time to review applications and approval rates. For example, if review time is extended (for example, because of fewer devoted federal resources) or if denial rates rise (for example, because of a change in policy), labor force growth in the U.S. would be dampened.
These two metrics are particularly important in the context of a large outstanding number of unresolved permit applications—as shown in figure 4, more than one million applications are pending a decision from USCIS. Absent any immediate and widespread policy changes, many of these immigrants will remain in the United States waiting for work authorization. If both approval rates and processing times stay roughly the same while new applications fall, we would expect to see the stock of pending applications fall, with the vast majority being approved.
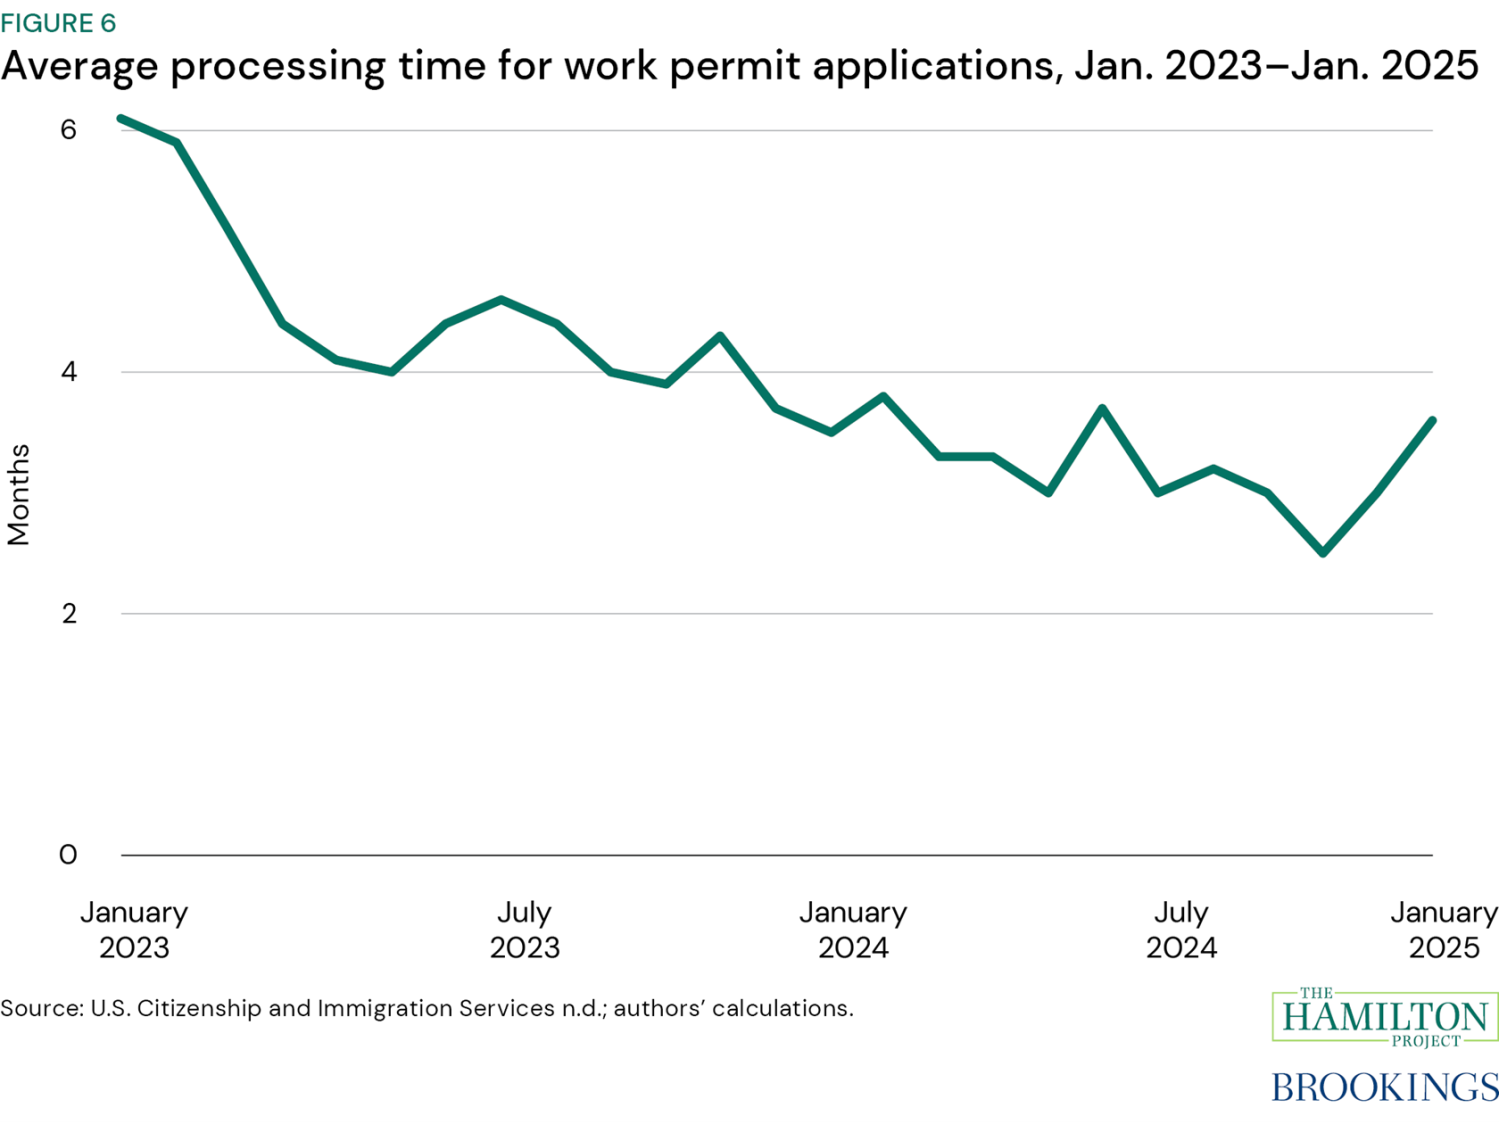
In January 2025, average processing time for applications was 3.6 months, about half a month longer than in the fall of 2024 (figure 6). The share of work permit decisions that were approvals fell slightly from about 94 percent in the fall of 2024 to 90 percent in January.
Conclusion
Work permits provide a provide a partial but close to real-time measure of recent immigrants taking steps to enter the workforce. To be sure, some immigrants eligible to apply for work permits start working before their permits are approved or continue after their permits expire. And many undocumented immigrants ineligible for work permits nonetheless work in the labor market. Still, the work permit data are a useful indicator of growth in labor supply.
Just as the surge in immigration helped explain employment growth in recent years, large reductions in net migration could lead to slower employment growth. However, the extent to which new policies reduce immigration and the subsequent impacts on the labor market are yet to be seen. In the coming months, data on applications, approval rates, and wait times will point to how much immigration will be a source of labor supply.
Authors


Related Content


-
Acknowledgements and disclosures
The authors thank Lauren Bauer and Tara Watson for insightful feedback and Olivia Howard, Asha Patt, and Riki Matsumoto for excellent research assistance. The authors give special thanks to Chris Foote for pioneering the use of work permit data to quantify surges in immigration and their effect on the labor market, insightful feedback and comments on this draft, and contributions to this analysis.
The Brookings Institution is committed to quality, independence, and impact.
We are supported by a diverse array of funders. In line with our values and policies, each Brookings publication represents the sole views of its author(s).