
Immigration estimates for 2023 notably surpassed prior projections, as we explain in a recent analysis. This piece explores what we know about where recent U.S. immigrants live, though data limitations mean the picture is necessarily incomplete. We specifically focus on one sub-population of interest: non-dependent immigrants arriving in the last two calendar years without a college degree. As we document in a 2022 policy proposal, recently arrived immigrants without a college degree are most likely to pose short-term fiscal challenges to states and localities even as that same group is likely beneficial for the federal budget.
The data suggest that there are increasing numbers of new arrivals across the country. Specifically, between 2018 and 2023, 42 states in the contiguous U.S. had increases in the share of their adult populations comprised of non-college immigrants who had arrived within two years. In turn, there is increasing pressure on the federal government, which reaps substantial positive fiscal gains from immigration over the long run, to distribute resources to a growing number of communities who face disproportionate near-term budget strains.
In our previous analysis, we describe some of the important aggregate economic effects of the increase in immigration. We document the boost to economic output and consumer spending, for example. In addition, “for 2024 we estimate sustainable employment growth will be between 160,000 and 200,000, approximately double the sustainable level that would have occurred in absence of the pickup in immigration according to the pre-pandemic projections…” Prior research also shows that immigration is good for the federal budget. In a comprehensive study, the National Academies of Sciences, Engineering, and Medicine estimates each additional immigrant, on average, directly contributes $1,208 (in 2023 dollars) more in tax revenue each year than they receive in federal benefits, and that net benefits over a 75-year horizon exceed $326,000 (in 2023 dollars) for an immigrant and their descendants.
Related Content


2022
To understand the effects of immigration at the sub-national level, we explore the geographic distribution of recent immigration. That distribution matters because where immigrants settle determines where labor supply is expanded and which communities see increases in demand for goods and services. In addition, the fiscal effects of immigration are different for state and local governments than for the federal government. Localities disproportionately pay for the benefits most often available to newly arrived immigrants, such as education and health care. In the short run, new migrants typically are a net fiscal negative for state and local government budgets. In the long run, the fiscal impacts are positive even at the state and local level as immigrants’ incomes rise. Nonetheless, most of the fiscal gains accrue at the federal level.
A Hamilton Project policy proposal by two of the authors of this piece explore the geographic distribution of immigrants that likely put more fiscal pressure on sub-national governments: immigrants who have arrived within five years who are not dependents and have not received a bachelor’s degree, which we defined as “impact index immigrants.” In this piece, to better assess changes since immigration started to rebound in 2021, we examine more recent impact index immigrants. That is to say, we examine the trends for those who have arrived in the U.S. during the reference year or the year prior.
Of course, there is nothing immutable about the fact that impact index immigrants improve the federal budget but put pressures on sub-national governments. As we previously proposed and return to in the conclusion below, the federal government should fund localities with a high proportion (which we define as over 0.5 percent) of impact index immigrants through transparent funding streams targeted at health and education.
What does recent impact index immigration look like in 2023?
As we discuss in our earlier analysis, total immigration has surged since 2021. We analyzed the aggregate economic effects of net immigration of 2.6 million and 3.3 million immigrants in 2022 and 2023, respectively, which is roughly triple the average influx between 2010 and 2019.
Here, we use the Current Population Survey (CPS) to estimate where recent impact index immigrants are living and how the location of recent arrivals has changed from the pre-pandemic era. Our earlier analysis suggests that the most recent data in the CPS are likely underestimating immigration levels as well as overall population levels. Nevertheless, the CPS offers some useful information regarding the distribution of where recent migrants are surveyed and migrants’ estimated population shares by state. (The American Community Survey offers a much larger and more reliable sample but is not yet available for 2023. However, our analysis of data from 2018 suggests a reasonably high degree of correlation between estimated state-level inflows across the two data sources.)
More specifically, we define “recent impact index immigrants” as:
- A non-citizen or naturalized citizen who immigrated to the U.S. during the reference year or the year prior;
- A non-dependent adult, meaning adults except those both between ages 18 and 22 and in school; and,
- An individual who has not attained at least a bachelor’s degree.
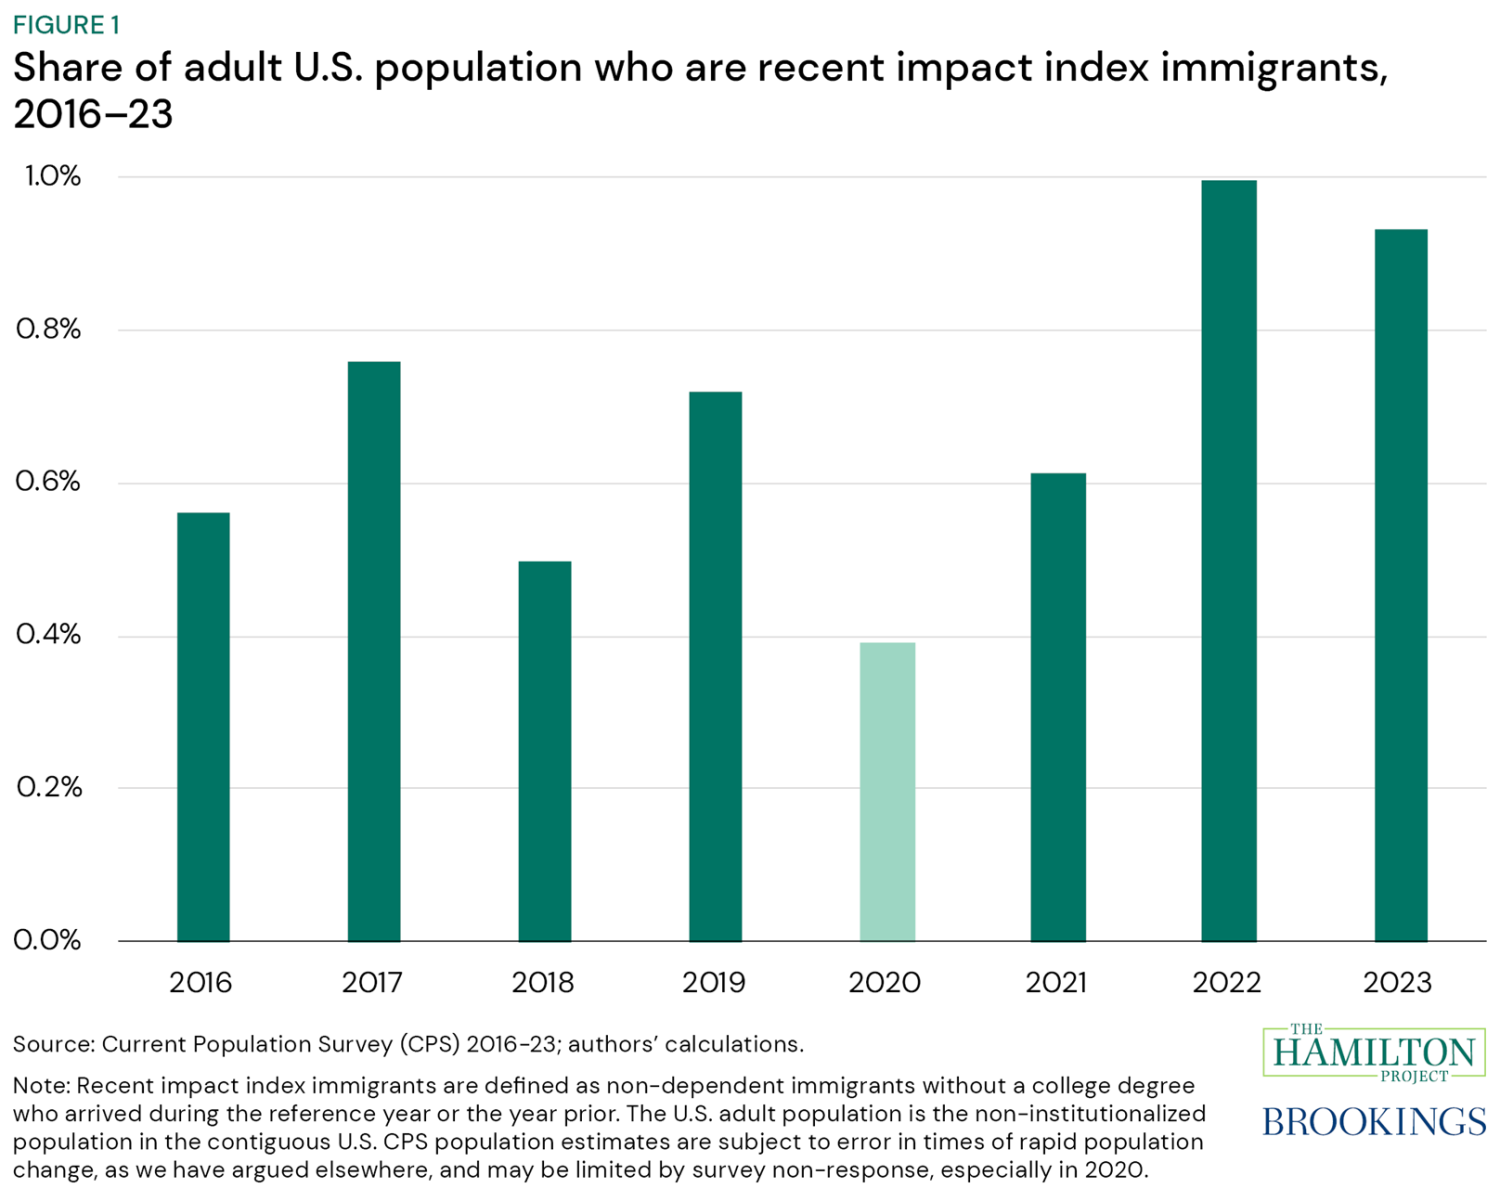
According to analysis of CPS data, recent impact index immigrants are a larger share of the population than before the pandemic (figure 1). Between 2016 and 2019, recent impact index immigrants as a share of the adult U.S. population ranged from 0.5 percent to 0.8 percent. The share jumped to 1.0 percent in 2022 and then remained high in 2023. Though the CPS offers an imperfect measure, the elevated share of the population comprised of recent impact index immigrants is consistent with Congressional Budget Office (CBO) estimates that immigration inflows substantially increased in recent years.
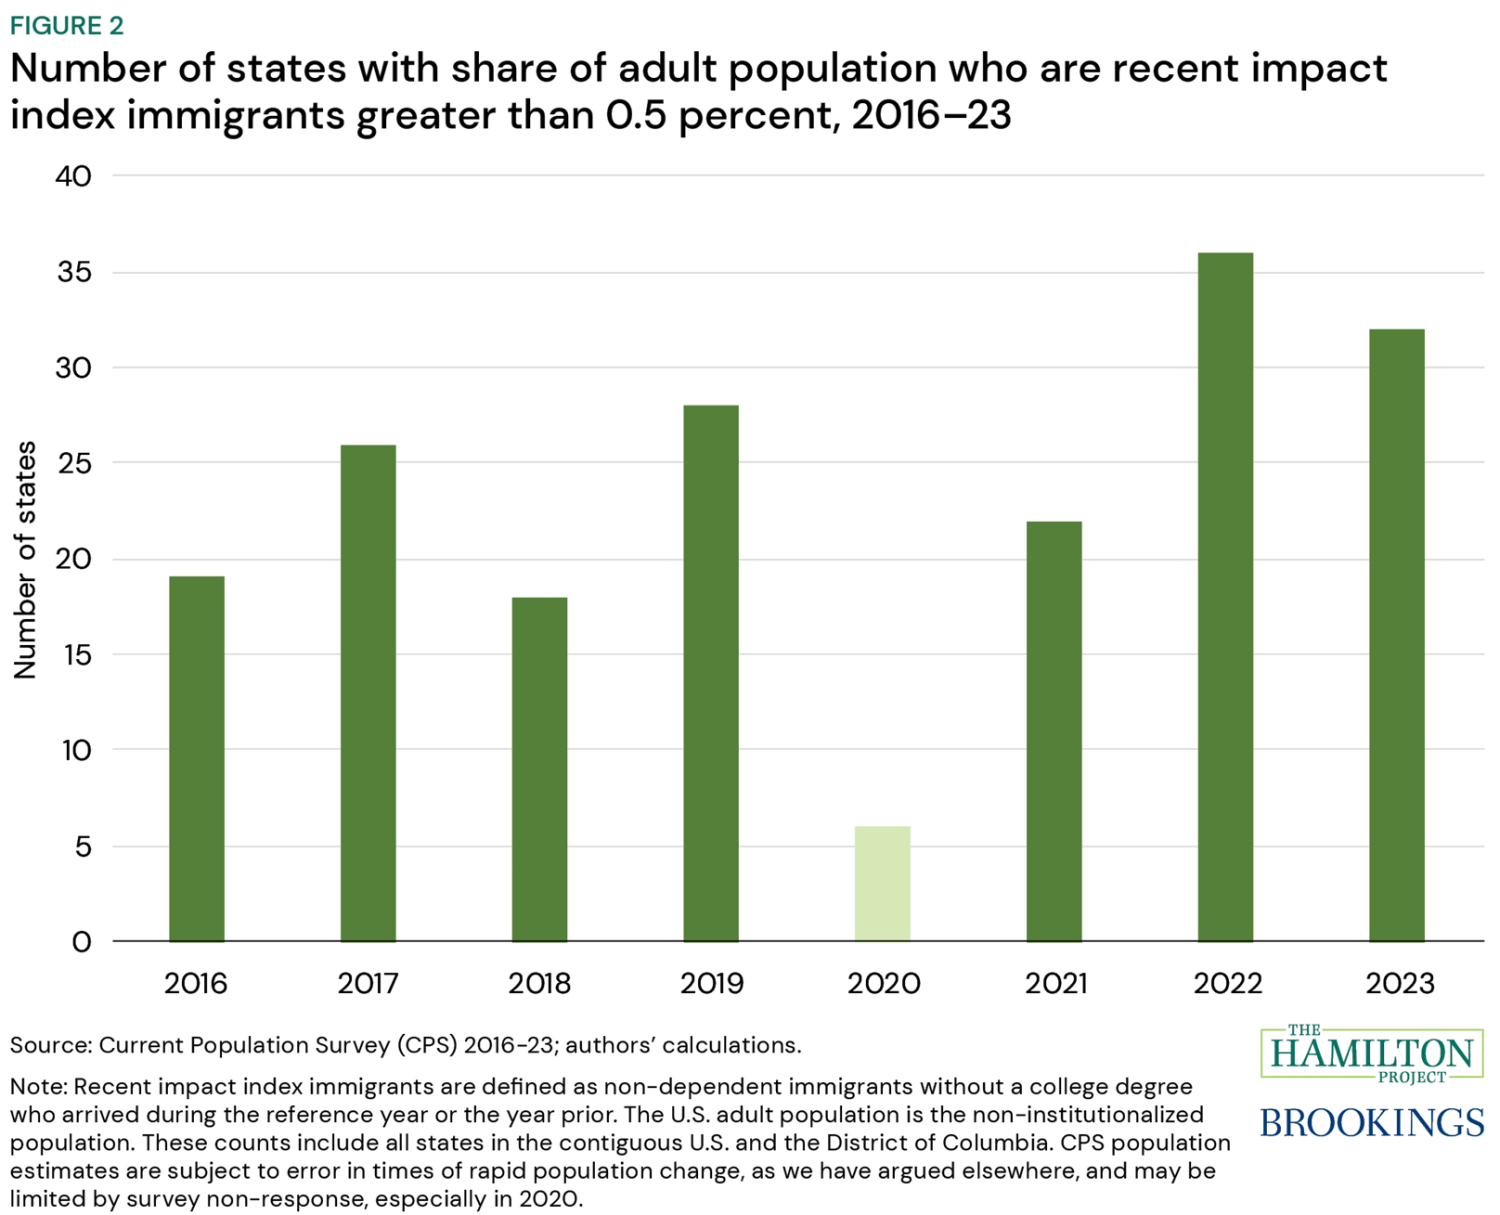
The number of states with significant shares of recent impact index immigrants also increased: Between 2018 and 2023, the number of states with a share of recent impact index immigrants greater than 0.5 percent of the adult population rose by 14 states (figure 2). Edelberg and Watson (2022) proposed 0.5 percent as the share of impact index immigrants that should trigger some amount of fiscal support from the federal government. That threshold usefully separated areas with a substantial share of impact index immigrants from those with a de minimus share. Mechanically, the threshold should be lower when examining recent impact index immigrants, because they are a subset of impact index immigrants, but we maintain the 0.5 percent cutoff for comparability. Between 2018 to 2023, Alabama, Georgia, Idaho, Indiana, Iowa, Kansas, Kentucky, Louisiana, Missouri, New Mexico, North Carolina, Oregon, Rhode Island, South Dakota, Utah, and Virginia all rose above the 0.5 percent threshold. (At the same time, two states fell below the threshold.) Altogether, 42 states in the contiguous U.S. saw share increases.
The degree to which shares increased is also revealing. Between 2018 and 2023, the share of recent impact index immigrants increased substantially (by more than 0.5 percentage points) in 10 states: Arizona, California, Florida, Georgia, Kentucky, Massachusetts, New Jersey, New Mexico, Texas, and Utah.
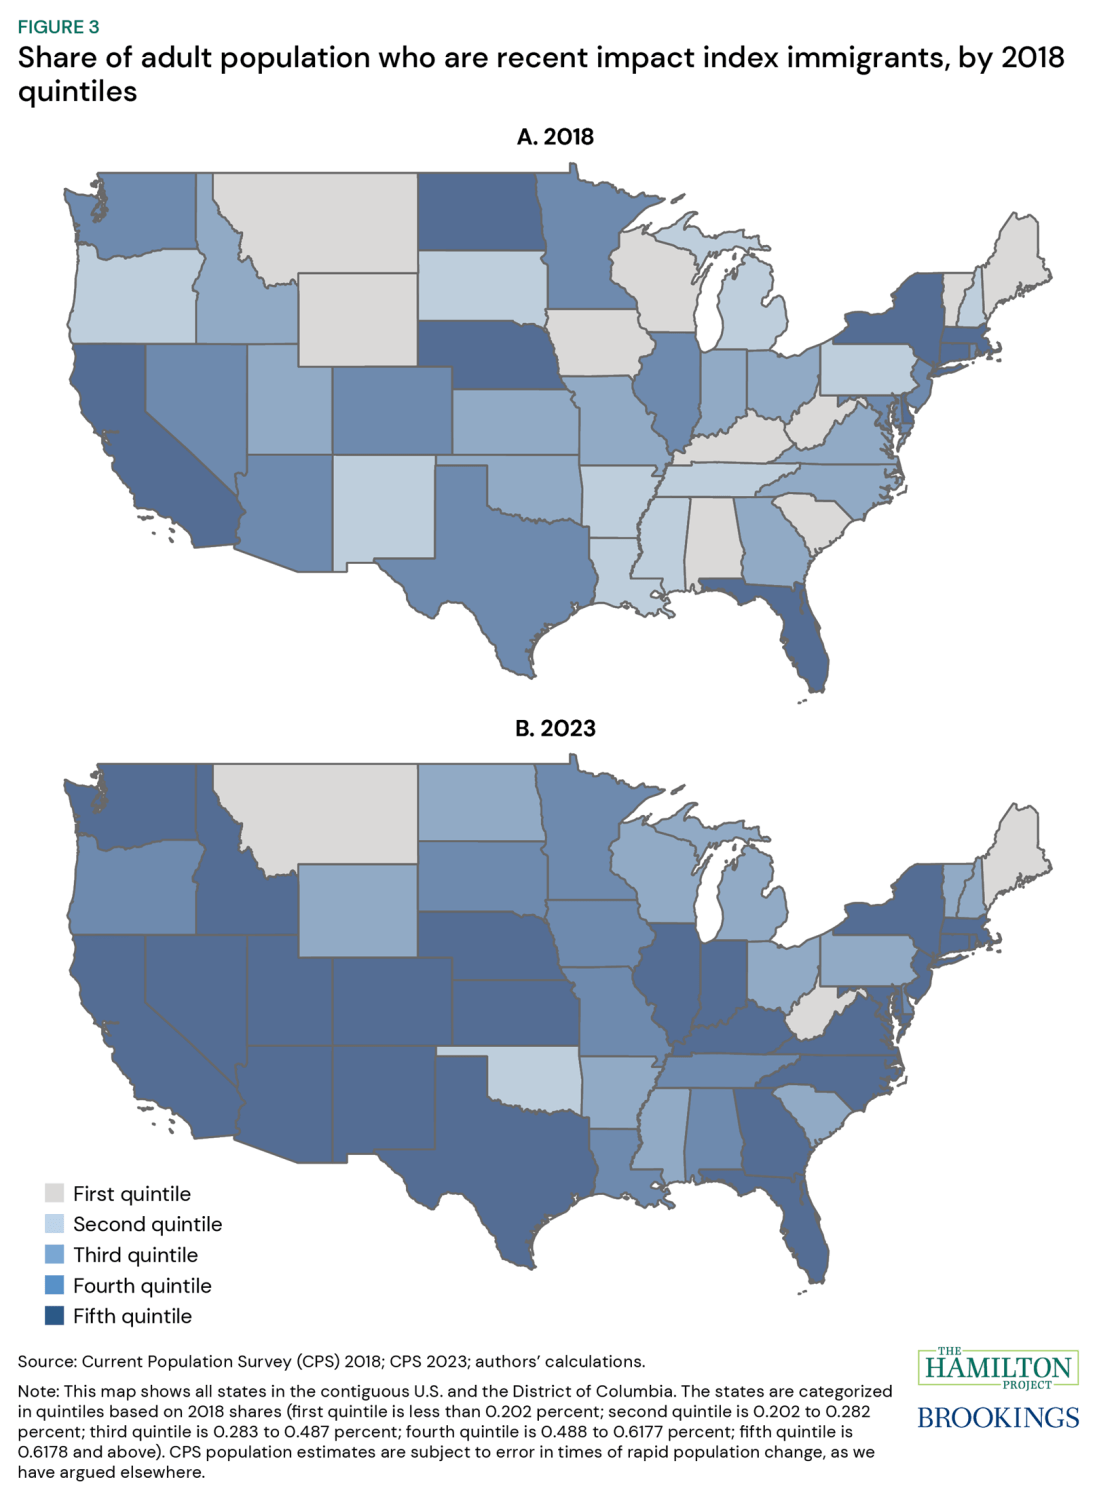
Figure 3 illustrates the increase in shares, benchmarking to quintiles in the 2018 data. Figure 3a shows the 2018 shares in states across five quintiles of the share distribution. Ten states have roughly 0.2 percent or less (the first quintile) of their adult population comprised of recent impact index immigrants, and 19 states have a share of roughly 0.5 percent and above (the fourth and fifth quintiles). Figure 3b shows the 2023 state shares, using the 2018 quintile cutoffs to facilitate comparison. For example, Kentucky was in the lowest quintile in 2018 but by 2023 had a share that would have put it in the top quintile in 2018.
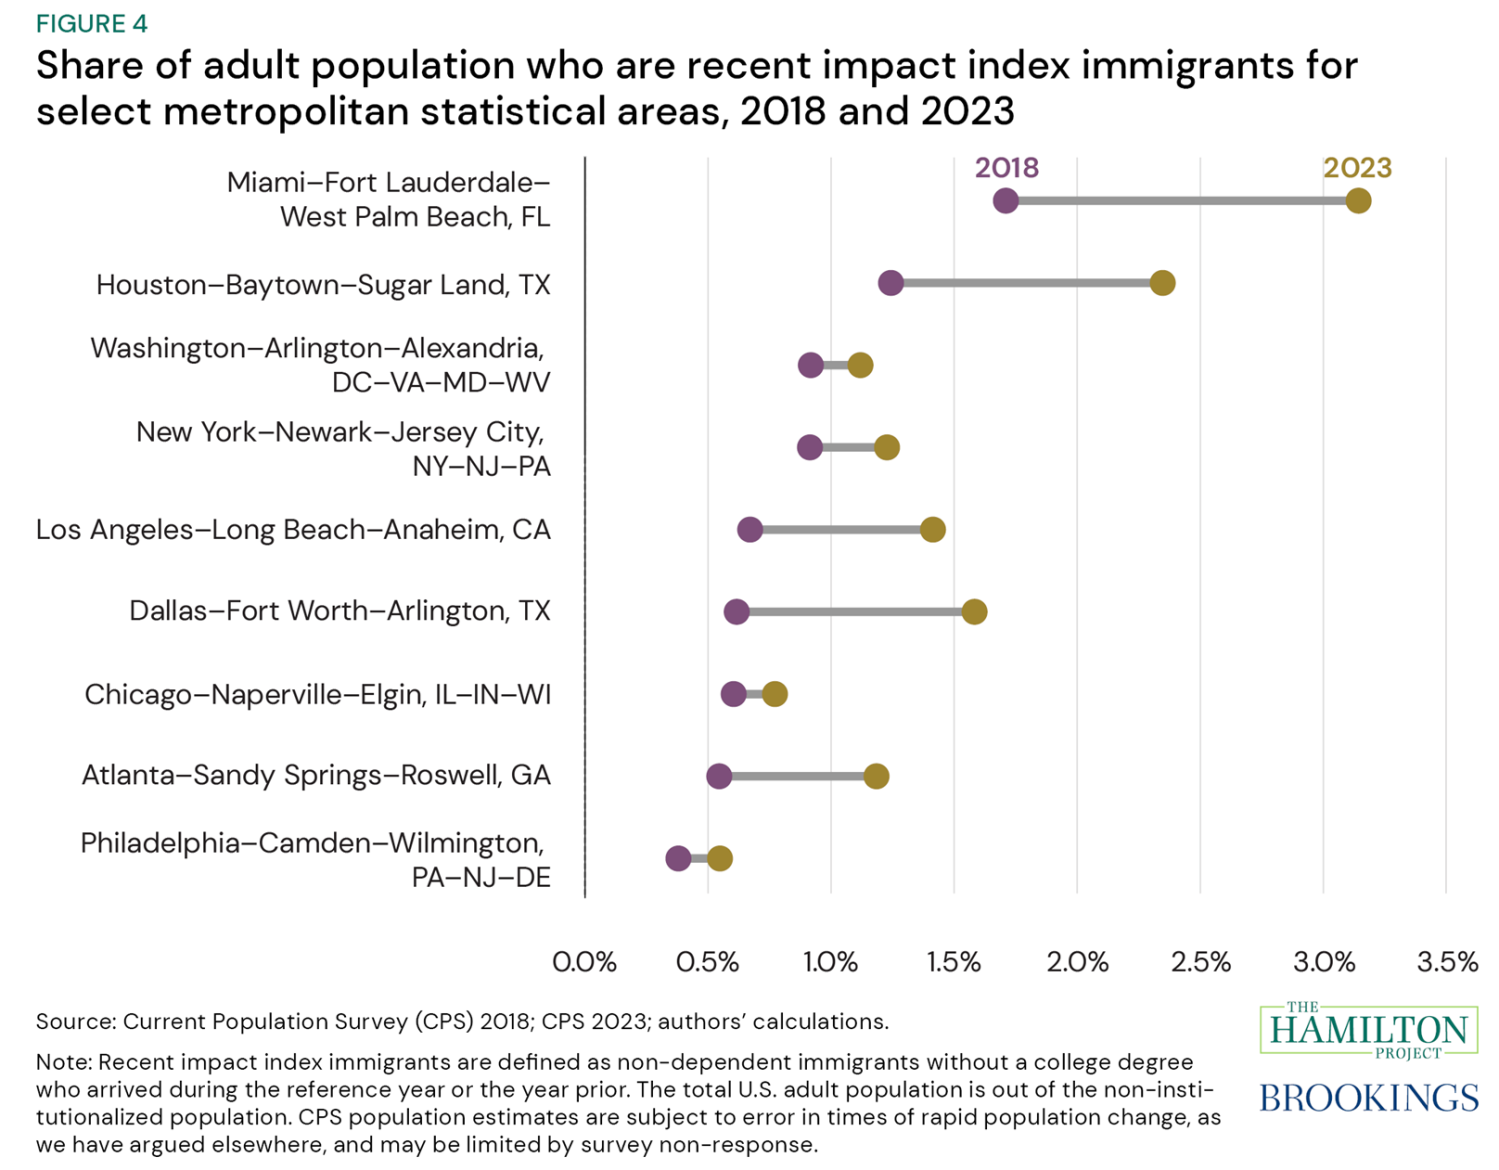
Although recent data for immigration trends at the sub-state level are subject to significant uncertainty, we examine patterns for metropolitan statistical areas (MSAs) with at least 5 million people in 2023 and find that all nine of these areas experienced rising shares of recent impact index immigrants between 2018 and 2023 (see figure 4). Data for the Miami MSA, for example, shows an increase from 1.7 percent in 2018 to 3.2 percent in 2023.
Policy responses
Even as the strong immigration flows provide substantial benefits for the aggregate economy, the flows increase fiscal strain on state and local governments. In December 2022, Wendy Edelberg and Tara Watson published a policy proposal outlining these challenges and what to do about it.
The authors recommend the federal government should transparently fund localities with a high proportion (over 0.5 percent) of impact index immigrants, compared to the adult non-institutionalized population. They justify a $2,603 (in 2023 dollars) subsidy per impact index immigrant for education and health services through the already-established Impact Aid program and Federally Qualified Health Centers. These channels will reduce bureaucratic costs and prioritize community-level needs. Compared to the population on which the $2,603 estimates were based, today’s new migrants are more likely to be asylum-seekers and parolees arriving from countries in crisis, and thus are likely to need more initial support.
Though the 2022 proposal has not been adopted, the federal government has responded in other ways to address the short-term local fiscal burden associated with the recent surge in migration. For example, in fiscal year 2023, $800 million was made available through Federal Emergency Management Agency programs to support shelter and other humanitarian needs provided by local governments, non-profits, and faith-based organizations. Though helpful to offset local government expenditures, this figure amounts to much less than our proposed amount, which would have totaled $6.2 billion annually just for the 2.4 million impact index immigrants arriving since 2022, which is what we estimate using the 2023 CPS.
Conclusion
For now, the influx of immigrants in 2022 and 2023 will bring substantial aggregate economic and fiscal gains, as detailed in Edelberg and Watson (2022) and Edelberg and Watson (2024). Looking ahead, immigration flows for 2024 remain uncertain. The number of border encounters, and the subset allowed to enter the U.S. while waiting for immigration proceedings, fell in April 2024, relative to the extremely high levels earlier in the year. Border flows remain similar to the fairly high level seen in April 2023, however, and it is unclear how the border situation will evolve.
Regardless, long-term economic growth in the U.S. will continue to depend on immigration. At the same time, immigrants will continue to seek economic opportunity in this country. The fiscal benefits of migration largely accrue at the federal level, however, with short-term costs borne at the local level. Federal support to localities should not be limited to emergency response, but instead should recognize that ongoing local health and education investment supports the broadly shared economic benefit of immigration.
Authors


References
Congressional Budget Office (CBO). 2024. “The Demographic Outlook: 2024 to 2054.” https://www.cbo.gov/publication/59697.
Congressional Research Service. 2023b, August 31. “Migrant Assistance Through the FEMA Emergency Food and Shelter Program (EFSP).” Authored by Elizabeth M. Webster and Audrey Singer. Report R47681. Congressional Research Service, Washington, DC.
Edelberg, Wendy and Tara Watson. 2022. “A more equitable distribution of the positive fiscal benefits of immigration.” The Hamilton Project, Brookings Institution, Washington, DC.
Edelberg, Wendy and Tara Watson. 2024. “New immigration estimates help make sense of the pace of employment.” The Hamilton Project, Brookings Institution, Washington, DC.
National Academies of Sciences, Engineering, and Medicine (NASEM). 2017. The Economic and Fiscal Consequences of Immigration. Washington, DC.
U.S. Bureau of Labor Statistics (BLS). 2016-23. “Current Population Survey.” Bureau of Labor Statistics, U.S. Department of Labor, Washington, DC.
U.S. Bureau of Labor Statistics (BLS). 2018. “Current Population Survey.” Bureau of Labor Statistics, U.S. Department of Labor, Washington, DC.
U.S. Bureau of Labor Statistics (BLS). 2023. “Current Population Survey.” Bureau of Labor Statistics, U.S. Department of Labor, Washington, DC.
U.S. Customs and Border Protection (CBP). 2024, May 15. “Nationwide Encounters.” U.S. Department of Homeland Security, Washington, DC. https://www.cbp.gov/newsroom/stats/nationwide-encounters.
U.S. Customs and Border Protection (CBP). 2024, May 28. “Custody and Transfer Statistics.” U.S. Department of Homeland Security, Washington, DC. https://www.cbp.gov/newsroom/stats/custody-and-transfer-statistics.
-
Acknowledgements and disclosures
Acknowledgements
The authors are grateful to Lauren Bauer for her insightful comments. Gabriela Goodman, Simon Hodson, Noadia Steinmetz-Silber, and Jimmy Zheng provided excellent research support. The authors would also like to thank Jeanine Rees for her graphic design and layout contributions.
The Brookings Institution is financed through the support of a diverse array of foundations, corporations, governments, individuals, as well as an endowment. A list of donors can be found in our annual reports published online here. The findings, interpretations, and conclusions in this report are solely those of its author(s) and are not influenced by any donation.
The Brookings Institution is committed to quality, independence, and impact.
We are supported by a diverse array of funders. In line with our values and policies, each Brookings publication represents the sole views of its author(s).