
Learning empowers individuals to pursue their dreams and reach their potential in a wide range of measurable ways. As an economic elevator, quality education fuels pathways to greater opportunity and progress. Higher educational attainment is associated with higher earnings, longer productive lives, better physical and mental health, resilience and adaptability, and personal development and fulfillment. For the macroeconomy, education is a catalyst for human and social capital development, driving long-term economic growth.
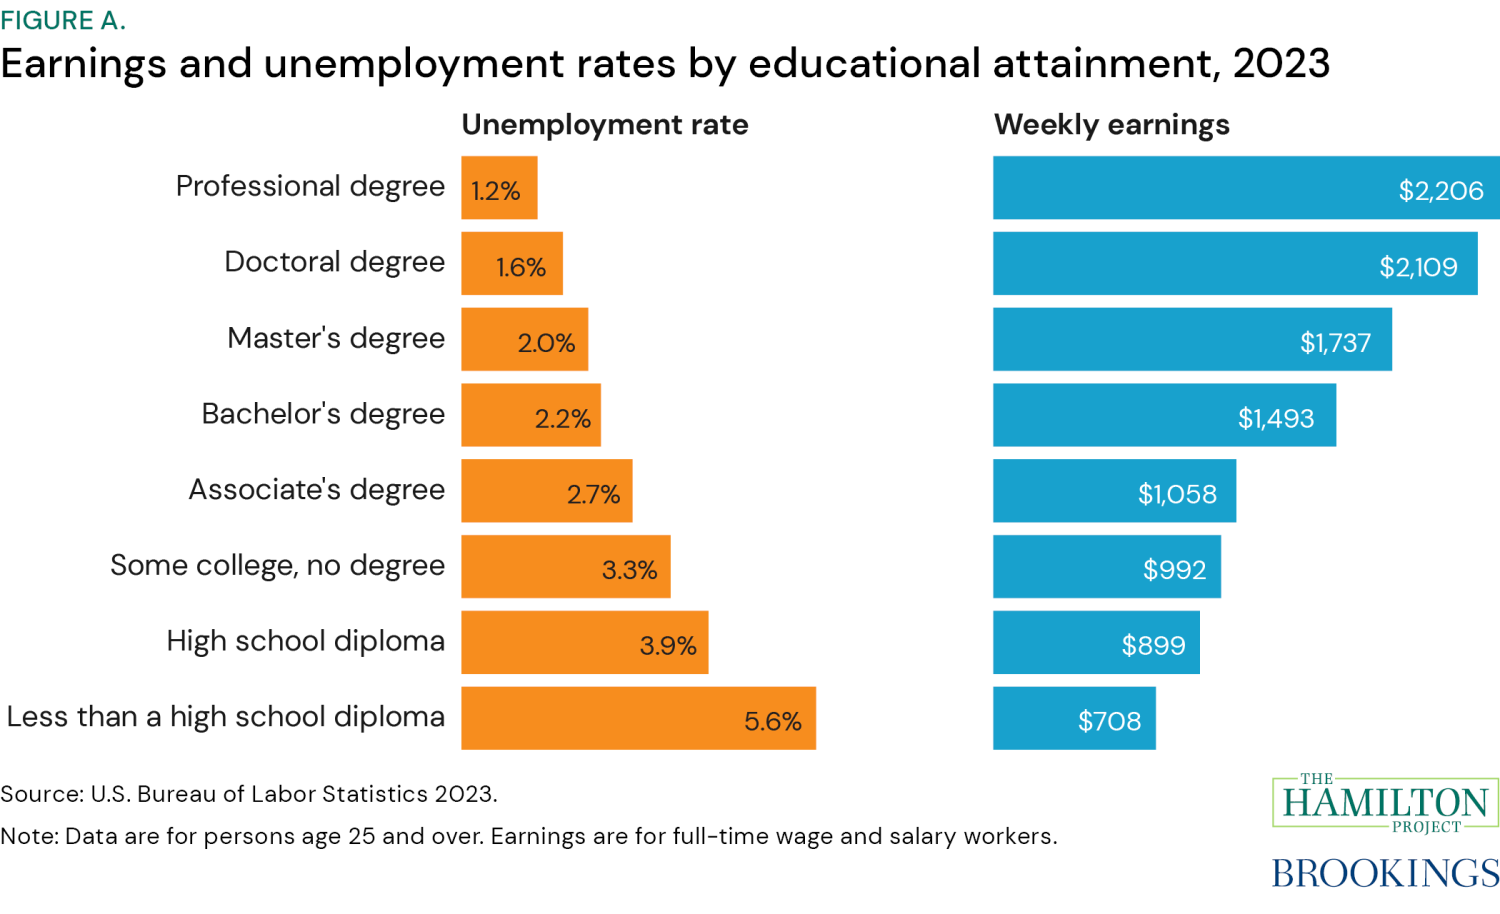
Education plays an instrumental role in succeeding in today’s labor market, as illustrated in figure A. Bachelor’s degree holders face less than half the unemployment rate and earn more than double the income of high school dropouts, on average. Professional degree holders earn 48 percent more ($2,206 vs. $1,493 per week) and face 45 percent lower unemployment (1.2 vs. 2.2 percent) relative to bachelor’s degree holders. The following 12 facts take stock of secondary and postsecondary education in the U.S., discuss the economic opportunities education provides, and outline efforts to foster innovation in public education.
Where does secondary U.S. education stand? Results from the National Assessment of Educational Progress (NAEP) reveal that grade 8 math student performance in the U.S. shows some gains over the past two decades, before a steep decline between 2019 and 2022 (fact 1). Internationally, among the 38 OECD countries, the U.S. ranks 7th in reading and 29th in mathematics (fact 2). These statistics indicate that there is significant room for improvement in student performance, especially in mathematics. Although high school graduation rates for all racial groups are increasing, reflecting a positive trend toward decreasing academic inequality, gaps persist. In 2022, Black and Hispanic high school students were still 9 and 7 percentage points less likely to graduate than their white peers, respectively (fact 3). The flat overall performance trends and the persistent disparities underscore the need for innovative approaches and the scaling up of evidence-based solutions to enhance educational outcomes for all students.
In terms of postsecondary education, the share of people aged 25 years and over with a bachelor’s degree and a master’s degree increased by roughly 6 and 5 percentage points, respectively, over the past two decades (fact 4). At the same time, racial gaps persist and are larger at higher levels of educational attainment. In 2022, Black individuals aged 25 and over were 11.6 percent less likely to hold at least a high school diploma and 34.0 percent less likely to hold at least a bachelor’s degree compared to white people. Hispanics were 22.5 percent less likely to hold at least a high school diploma and 50.4 percent less likely to have higher education compared to white people (fact 4). As online higher education becomes more common (fact 5), people from a wider range of learning goals may acquire college credentials. Attaining more education costs money, and even though the net inflation-adjusted cost of college attendance is lower than the sticker price, Black and Hispanic students are 29.4 and 20.6 percent, respectively, more likely to face unmet financial needs in college than white students (fact 6). Inequalities also exist within the same level of educational attainment. Even though returns to advanced education have increased more for women than for men over time (fact 7), men continue to earn more than women with the same education level (fact 8).
In the context of overall flat school performance over the past two decades (fact 1), some charter schools are getting good results. The regulations governing charter schools vary by state, but in general charter schools are given more flexibility in how to operate, compared to traditional public schools, creating room for innovation. This operational, financial, and program autonomy is provided in exchange for performance-based accountability (Manno et al. 2000). Not all charter schools outperform local traditional public schools, but a recent study found more than 1,000 charter schools across the nation have eliminated achievement gaps for their students and moved their students ahead of their states’ average achievement (fact 10). Charter schools may help mitigate overall racial and economic gaps in student achievement for those who enroll, as they are more likely to serve Black, Hispanic, and economically disadvantaged students than traditional public schools (fact 9).
Looking ahead, the use of technology in education is likely to increase, but it is hard to tell which tools and approaches will prevail. The spike in venture capital investment in education technology (EdTech) during the COVID-19 pandemic has not been sustained after 2021 (fact 11). The tightening of funding opportunities for EdTech ventures increases the pressure to go beyond hype and deliver evidence of educational effectiveness. In terms of public investment in education innovation, real average annual funds awarded after 2016 through the Education, Research, and Innovation fund are 28.8 percent lower than those awarded under the preceding program, the Investing in Innovation (i3) fund (fact 12). In a moment of declining enrollment and declining family confidence in traditional public schools (Goulas 2024; Goulas and Pula 2024), the need to invest in education innovation and proven strategies is stronger than ever.
Chapter 1: Where we stand in secondary education
The COVID-19 pandemic significantly affected student performance in the U.S., reversing some gains made over the past two decades. While proficiency levels in reading and mathematics had been gradually increasing, recent years have seen a decline, particularly affecting white students. Despite these setbacks, there has been a slight narrowing of the racial achievement gap, with the difference in proficiency levels between white and Black students showing a modest decrease.
Compared to many other countries, U.S. students experienced relatively less severe learning losses during the pandemic. In global assessments, U.S. rankings in reading improved, while the decline in mathematics performance was less pronounced than in many other nations. Additionally, high school graduation rates have shown improvement across all racial groups, especially for Black and Hispanic students, signaling progress toward closing educational disparities. Nonetheless, there remains a need for continued efforts to address persistent inequalities and enhance overall academic standards.
-
Fact 1: Student performance dropped after COVID-19.
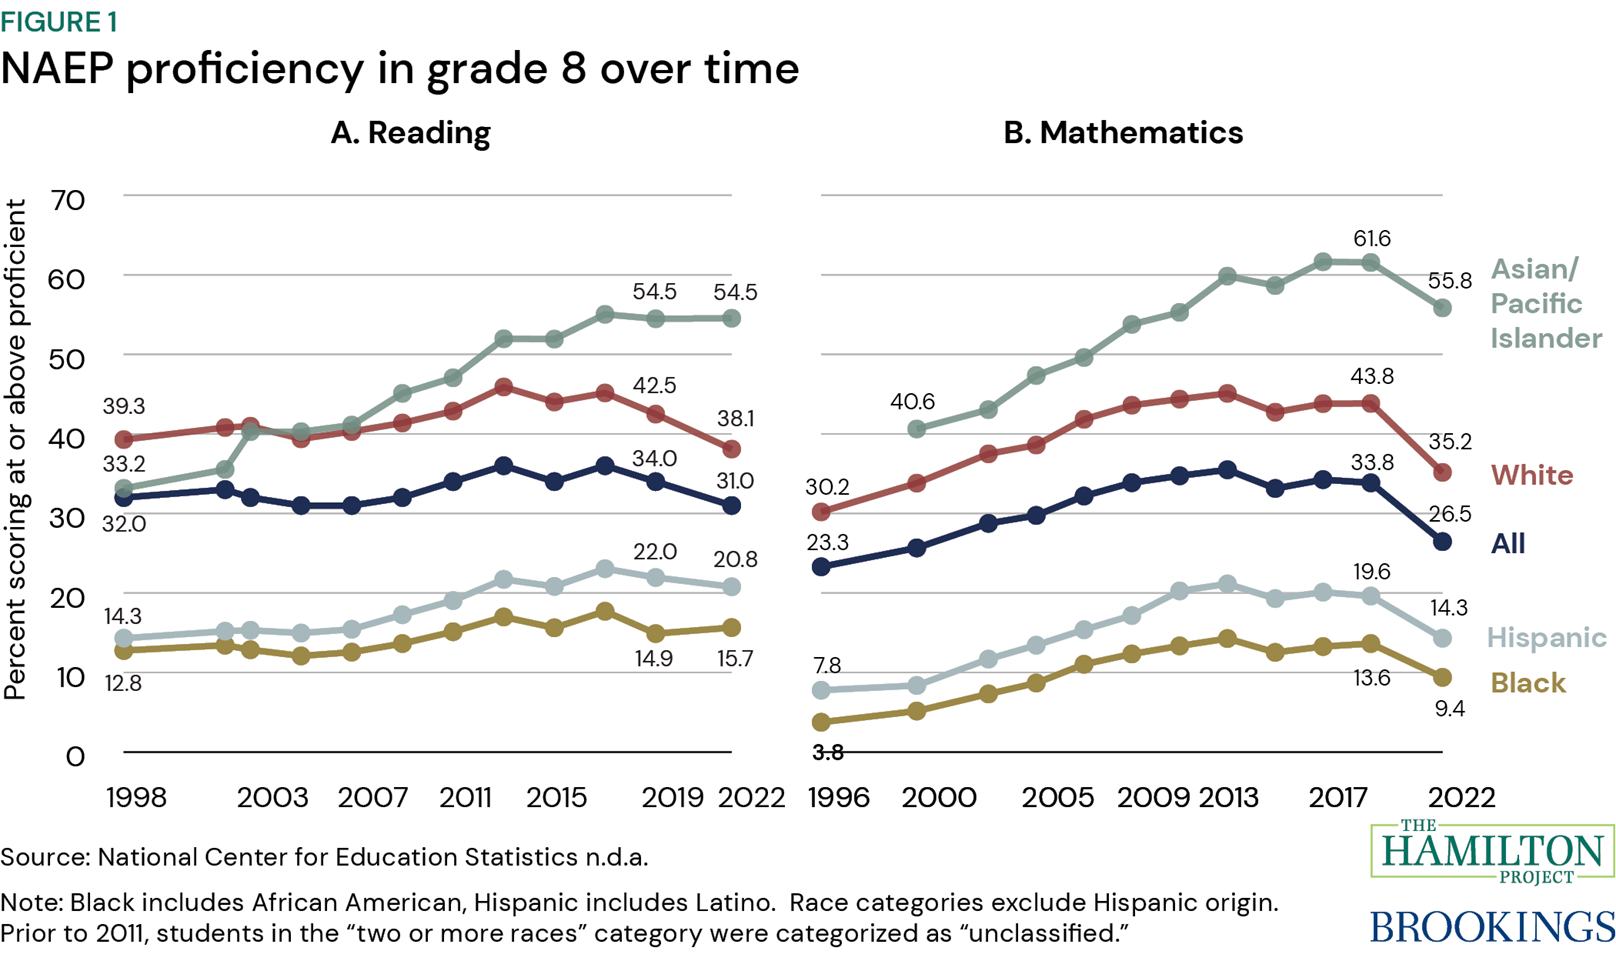
Figure 1 shows the share of grade 8 students scoring at or above proficiency levels in NAEP reading and math overall and by race/ethnicity since the late 1990s. The share of proficient grade 8 students increased more in math than in reading over most of this period. Specifically, the overall share of grade 8 students scoring at proficiency levels (i.e., the share of students showing an adequate or strong grasp of the subject matter for their grade level) in reading increased from 32.0 to 34.0 percent between 1998 and 2019, and it increased from 23.3 to 33.8 percent in mathematics between 1996 and 2019.
Racial gaps in student performance are persistent. The difference between the share of white and Black students who are proficient in reading decreased from 26.5 percentage points in 1998 to 22.4 percentage points in 2022. The corresponding gap in math decreased from 26.4 percentage points in 1998 to 25.8 percentage points in 2022.
The COVID-19 pandemic has harmed student achievement (CREDO 2020, Hanushek and Strauss 2024). Between 2019 and 2022, the share of grade 8 students who are proficient decreased by 3 percentage points in reading and by 7 percentage points in math. White students lost the most ground in academic performance during this period. In particular, the share of white grade 8 students who are proficient in reading decreased by 4 percentage points between 2019 and 2022, while the corresponding share of Black students increased by 1 percentage point. In mathematics, the share of proficient grade 8 students decreased by 9 percentage points among white students and by 4 percentage points among Black students. The share of Asian/Pacific Islander grade 8 students who are proficient stayed the same in reading but decreased by roughly 6 percentage points between 2018 and 2022.
These results indicate that the current status of grade 8 student performance is not too different from what it was 24 years ago in both reading and mathematics. This result, combined with the persistent racial gaps in student performance, underscores the need for innovative approaches in education and the scaling up of evidence-based solutions that improve outcomes for all students.
-
Fact 2: Pandemic-related learning losses of US students were not as severe as those in other countries.
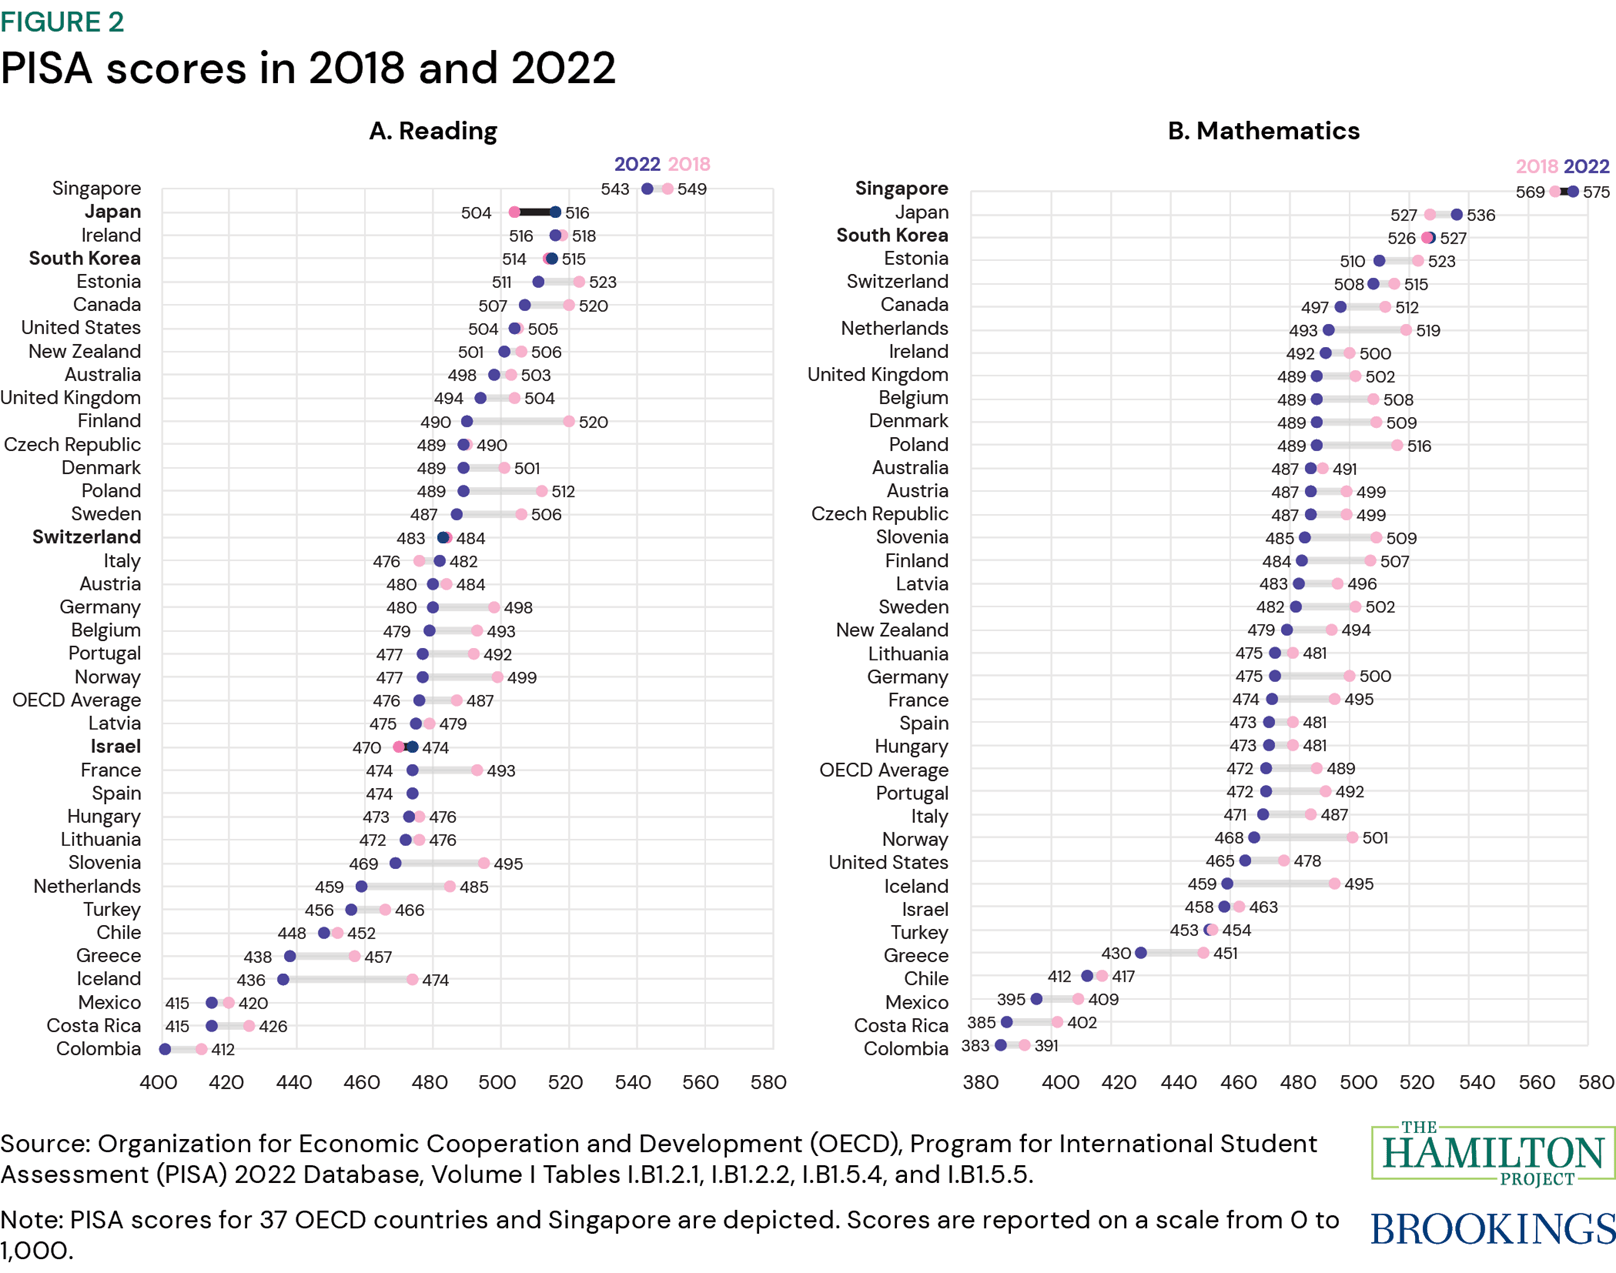
The Programme for International Student Assessment (PISA) is a worldwide study conducted by the Organisation for Economic Co-operation and Development (OECD) to evaluate educational systems by measuring 15-year-old students’ performance in reading, mathematics, and science. PISA serves as a critical tool for understanding and enhancing global education systems. Figure 2 compares PISA scores in reading and mathematics of students across 37 OECD countries and Singapore in 2018 and 2022.1 Singapore scored the highest in both subjects in 2018 and 2022. Among the 38 countries investigated, the U.S. ranked 7th in reading and 29th in mathematics in 2022. The U.S. scores close to the OECD average in mathematics and higher than the OECD average in reading. These results suggest that student performance in the U.S. has room for improvement, particularly in mathematics.
The difference in scores between 2018 and 2022 for each country includes the effect of COVID-19 on student performance in this country. Learning losses during this period were widespread across countries. Except for Japan and South Korea, which showed a positive change in reading and math between 2018 and 2022, all other countries in the analysis showed a negative change in student performance in reading or math. Between 2018 and 2022, student performance declined significantly in 19 countries in reading and in 27 countries in mathematics. The learning loss U.S. students suffered during the same period is less than seen in other countries (Hanushek and Strauss 2024). The difference in average U.S. scores in reading between 2018 and 2022 are not statistically distinguishable from zero. With other countries losing ground in reading scores over this period, the U.S. climbed from the 10th position in 2018 to the 7th in 2022. In mathematics, U.S. students lost some academic footing between 2018 and 2022 (13 points) but not as much as students in other countries. Specifically, the U.S. ranks 18th in learning loss severity in mathematics over this period. As a result, the U.S. moved from the 30th place in mathematics scores in 2018 to the 29th place in 2022.
-
Fact 3: Racial gaps in high school graduation rates are closing.
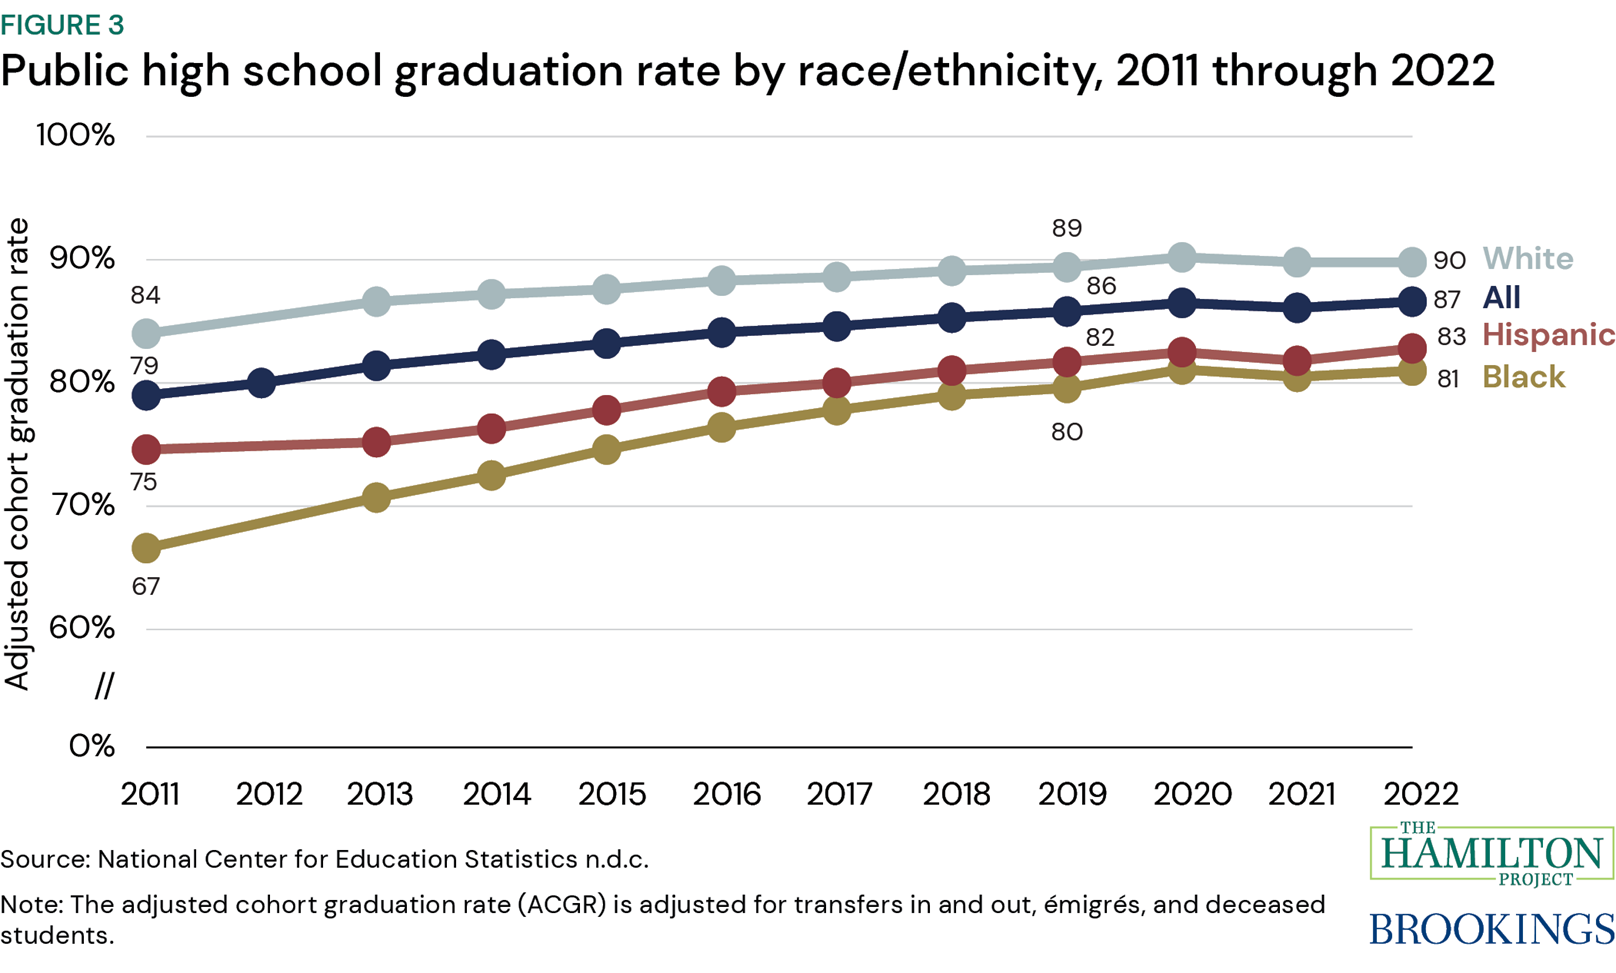
Figure 3 shows the public high school four-year adjusted cohort graduation rate (ACGR) for each race/ethnic group between 2011 and 2022. This rate is calculated as the number of students who graduate in four years with a regular high school diploma divided by the number of students who entered high school four years earlier. The overall graduation rate has increased from 79.0 percent in 2011 to 86.6 percent in 2022 (i.e., 8 percentage points). Over this period, the high school graduation rate has increased the most for Black (14 percentage points) and Hispanic students (8 percentage points).
The upward trajectory of high school graduation rates of all racial groups is a hopeful sign of improved upward mobility for all. The convergence of high school graduation rates of different racial groups also highlights declining academic inequality over time. Despite this improvement, substantial gaps remain. In 2022, Black and Hispanic high school students were 9 and 7 percentage points less likely to graduate than white students, respectively.
One may worry that the upward time trend of the overall graduation rate might to some extent reflect declining academic standards (Barnum 2022; The Economist 2024). “A Nation at Risk,” the landmark report published in 1983 by the National Commission on Excellence in Education underscored the importance of high academic expectations (NCEE 1983). Metrics such as high school graduation rates can be misleading if not accompanied by genuine scholastic achievement.
Chapter 2: Where we stand in postsecondary education
While the share of people with college education in the U.S. has increased over the past two decades, significant racial gaps remain. College education is widely recognized as a key pathway to better job prospects, with most employers agreeing that it prepares graduates for workforce success. The population with a bachelor’s degree and advanced degrees has grown, reflecting a more formally educated workforce. However, racial disparities are evident: Black and Hispanic individuals are significantly less likely than white individuals to attain higher education, while Asian/Pacific Islanders show higher levels of educational attainment compared to other racial groups.
The COVID-19 pandemic has also led to a significant increase in online higher education. More students are participating in distance learning, with over half attending some online classes and nearly a quarter exclusively online in the 2022–23 academic year. Although the prevalence of online education has decreased since its peak during the pandemic, it remains substantially higher than pre-pandemic levels. This shift reflects expanded online offerings from accredited institutions and improvements in the quality and efficacy of online education.
Despite rising costs of college attendance, the net cost after accounting for grant aid is lower than the published sticker price. Many undergraduate students, particularly Black and Hispanic students, do not have enough funds to cover their financial needs, leading them to rely on work or loans to cover their expenses. Additionally, the earnings of workers with higher education have increased over time, though the gains are not equally distributed. Men generally earn more than women across all education levels, with the gender pay gap widening at higher levels of educational attainment. This disparity highlights ongoing gender inequalities in the labor market, despite women being more likely than men to hold a college degree.
-
Fact 4: The share of people with college education has increased, but racial gaps remain.
College education remains for many a key pathway to economic prosperity, as shown in figure A. Figure 4 shows educational attainment in the U.S. over time (panel A) and by race/ethnicity (panel B). The share of the population aged 25 or older with a bachelor’s degree increased from 17.7 percent in 2002 to 23.4 percent in 2022 (i.e., 5.7 percentage points). Moreover, the share of advanced degree holders increased by more than 5 percentage points over the same period, reaching 14.2 percent. The increase in the share of people with postsecondary education is reflected in the decline in the share of people with a high school diploma as their highest credential from 32.1 percent in 2002 to 28.5 percent in 2022. This result suggests that the U.S. workforce has become more formally educated over time, which may translate to increased labor productivity but also a race among workers for more credentials to remain competitive in the labor market.
Fact 3 showed that even though racial gaps in high school graduation rates have declined over the past decade, they have not closed. These racial gaps are larger at higher levels of educational attainment. In 2022, among individuals aged 25 or older, Black individuals were 11.6 percent less likely to hold at least a high school diploma and 34.0 percent less likely to hold at least a bachelor’s degree than white individuals. Hispanics were 22.5 percent less likely to hold at least a high school diploma and 50.4 percent less likely to have higher education than white people. Postsecondary education was 41.9 percent more common among Asian/Pacific Islanders than among white individuals in 2022. In the same year, advanced higher education was starkly higher among Asian or Pacific Islanders (at 26.7 percent) than among other racial groups.

-
Fact 5: Online higher education is more common after COVID-19 than before.
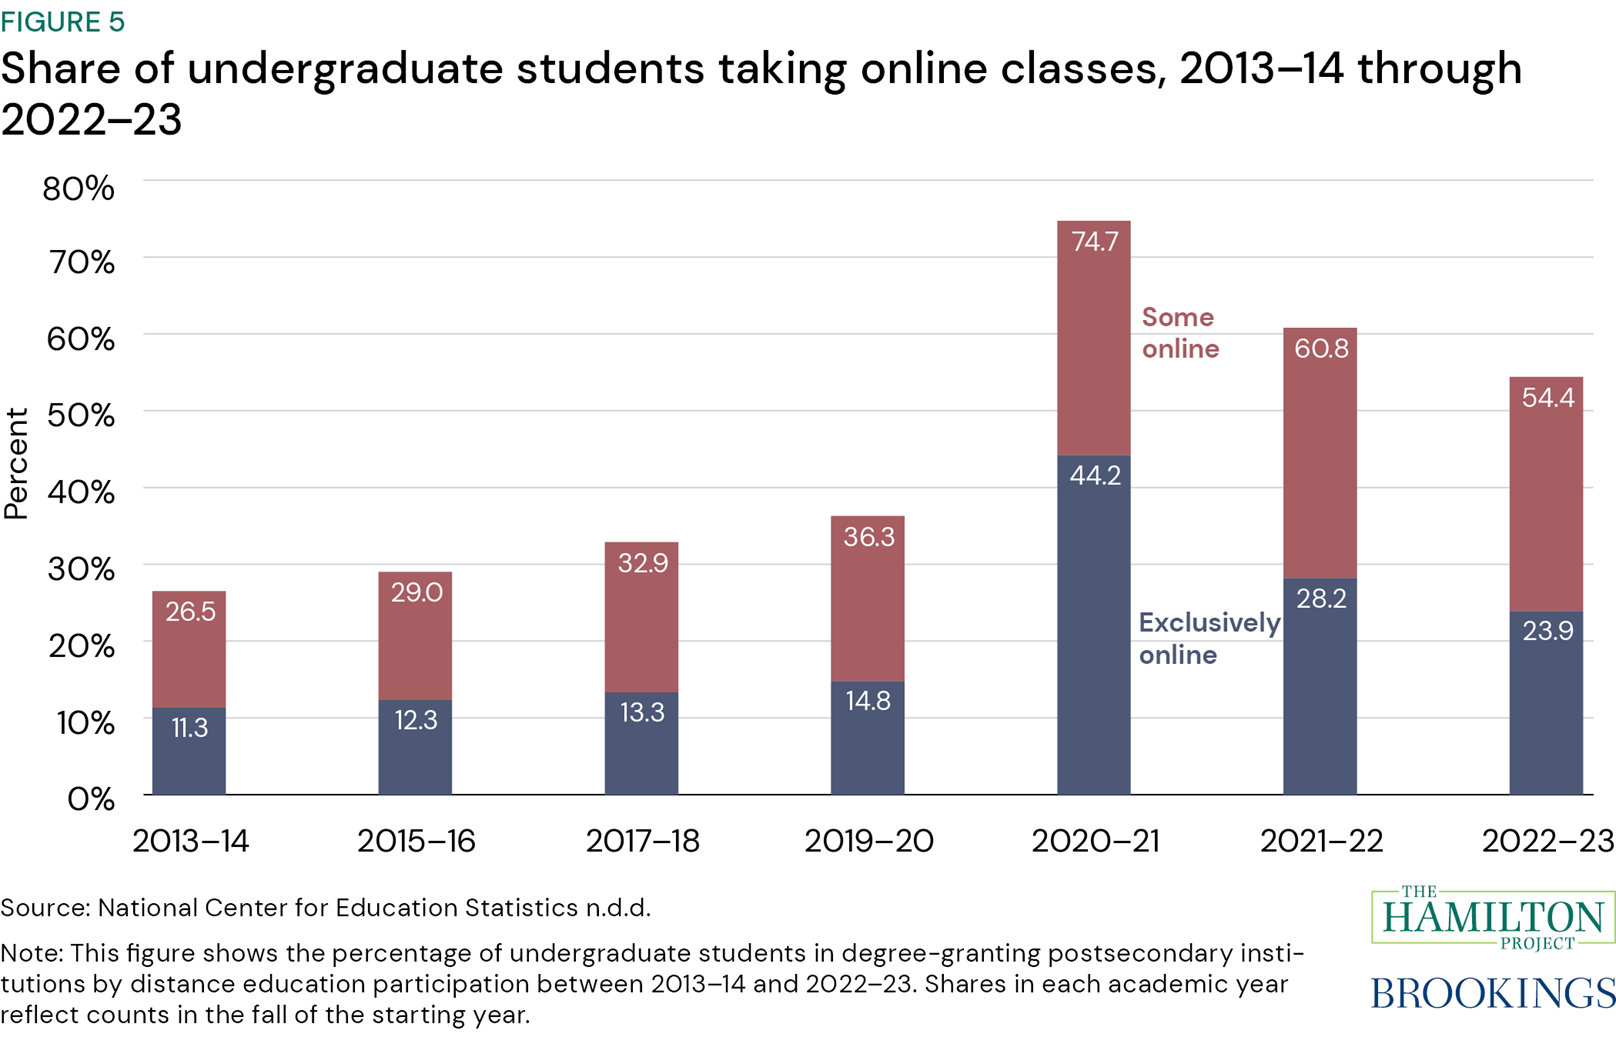
Figure 5 plots the share of students enrolled in degree-granting postsecondary institutions by distance education participation. The share of postsecondary education students who attend any distance education course climbed from 26.5 percent in 2013–14 to 54.4 percent in 2022–23. The share of postsecondary education students who attend classes exclusively online increased from 11.3 percent in 2013–14 to 23.9 percent in 2022–23. This means that in the most recent period (i.e., 2022–23), more than half of the postsecondary education students attend some online classes, while nearly a quarter of the students attend all their classes online.
In 2020–21, during the COVID-19 pandemic, 74.7 and 44.2 percent of postsecondary education students attended some portion or all their classes online, respectively. When the pandemic started, in 2019–20, 36.3 and 14.8 percent of students attended some or all their classes online, respectively. In the most recent period, 2022–23, the share of students attending some or all their classes online is roughly 18 and 9 percentage points, respectively, above their pre-pandemic (i.e., 2019–20) levels. This suggests that even though the prevalence of distance learning in postsecondary education decreased since the pandemic, it remains well above the pre-pandemic levels.
These results may reflect that online education post-COVID-19 looks very different from before. Online classes allow people with a wider set of learning goals to pursue further higher education (Villasenor 2022). At the same time, as more accredited institutions expand their distance learning options (Hamilton and Beagle 2024), the average quality of online programs may increase. Finally, the learning efficacy of higher education hybrid programs may also be higher after COVID-19 as pandemic-seasoned instructors and learners are more familiar with what works best in online versus in-person education (Sato et al. 2024).
-
Fact 6: The net cost of college attendance is lower than the published sticker price.
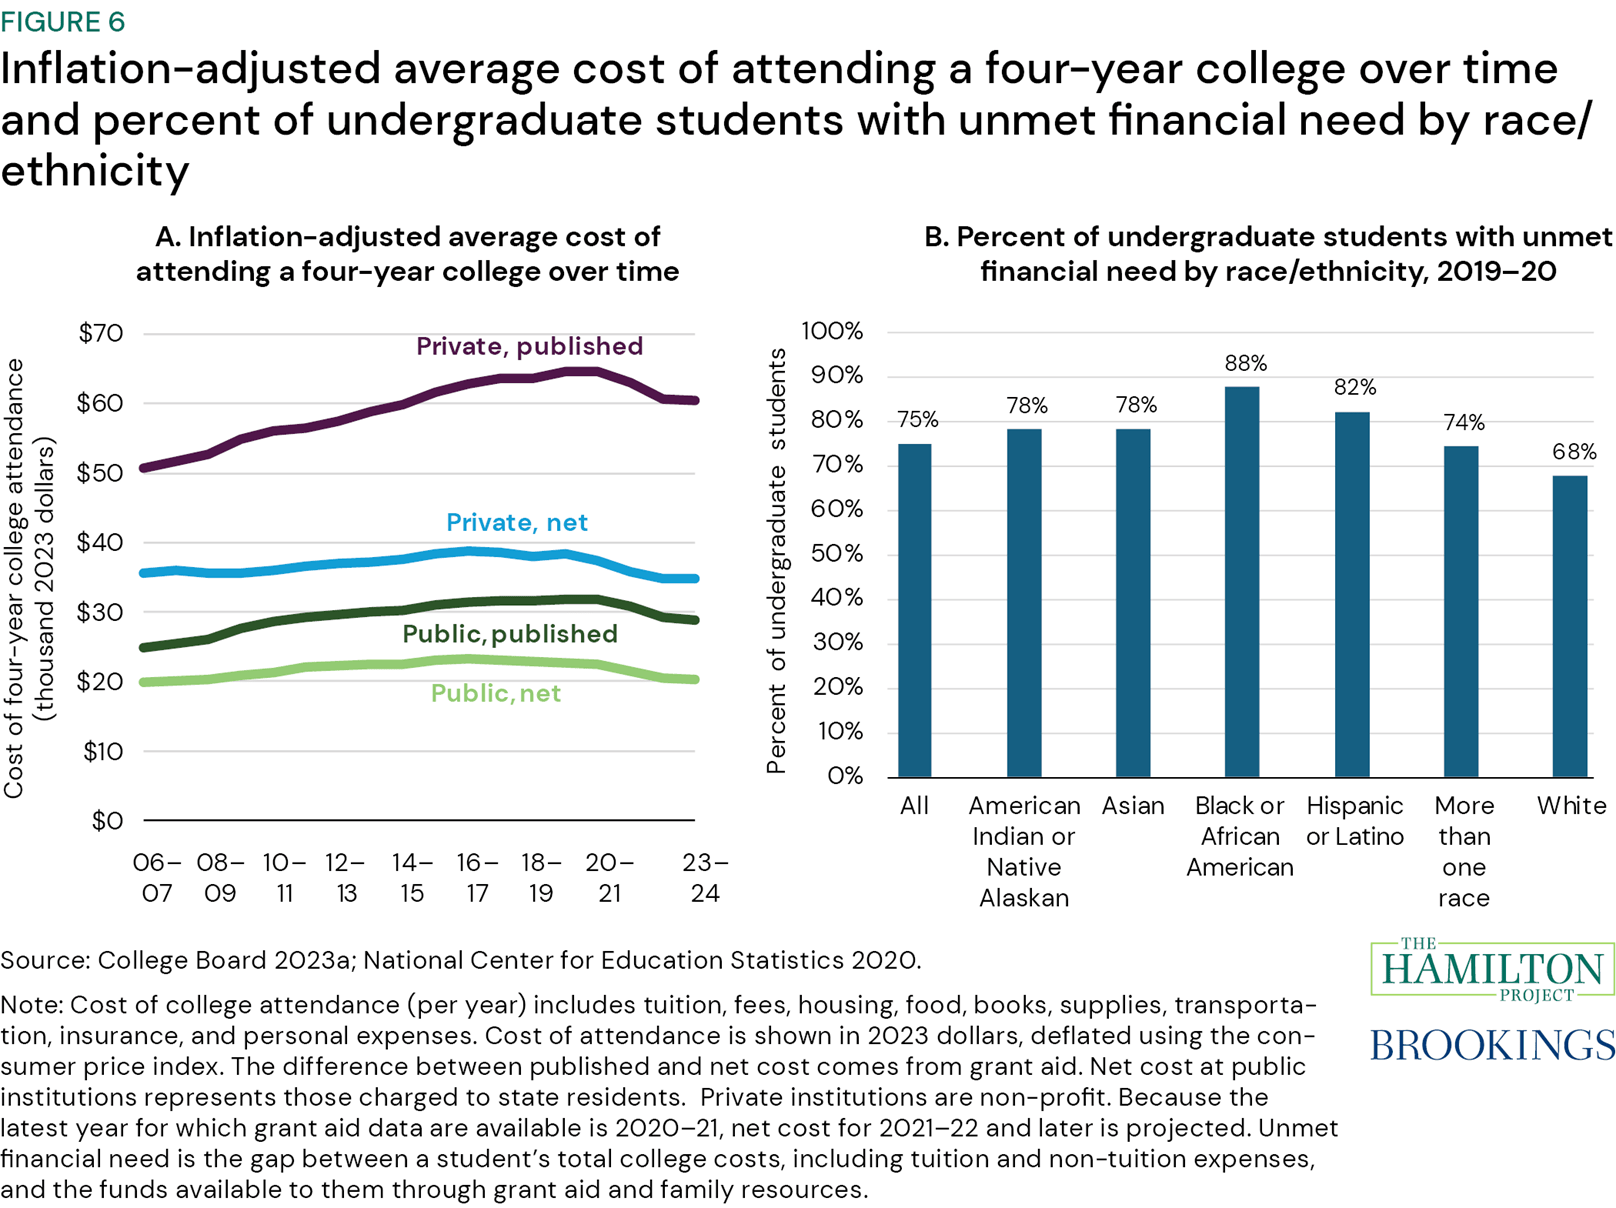
Public discussions on the cost of college attendance often focus on the listed cost of attendance (sticker price) without accounting for grant aid (Levine 2024). Grant aid comes in the form of grants, scholarships, and work-study programs and does not need to be paid back. In 2022–23, 64 percent of undergraduate students received grant aid (College Board 2023a). The average sticker price of attending a public or private four-year college in 2023–24 reached $28,840 or $60,420, respectively. When accounting for grant aid, the annual estimated average cost of attending a public or private four-year college goes down to $20,310 or $34,790, respectively.
Panel A of figure 6 shows that between 2006–07 and 2023–24, the published cost of attendance in a four-year public institution in 2023 dollars has increased by 15.9 percent, but when we account for grant aid, the net cost in real terms has increased by only 2.0 percent, on average. At private four-year colleges, the published inflation-adjusted cost has increased by 19.1 percent, while the average net inflation-adjusted cost has declined slightly by 2.5 percent over the same period.
Attending college is not equally affordable for all students. Limited access to scholarships and grants, and the lack of family financial resources, mean that many students do not have enough funds to cover their college bill. These students usually have to come with the extra cash on their own by picking up some work while studying or by taking out loans. Panel B of figure 6 shows the share of undergraduate students whose grant aid and expected family contributions fall short of total college costs (i.e., they face unmet financial need) by race/ethnicity in 2019–20. Black and Hispanic students are 29.4 and 20.6 percent, respectively, more likely to face unmet financial need than white students.
-
Fact 7: Earnings among those with more education have increased more over time.
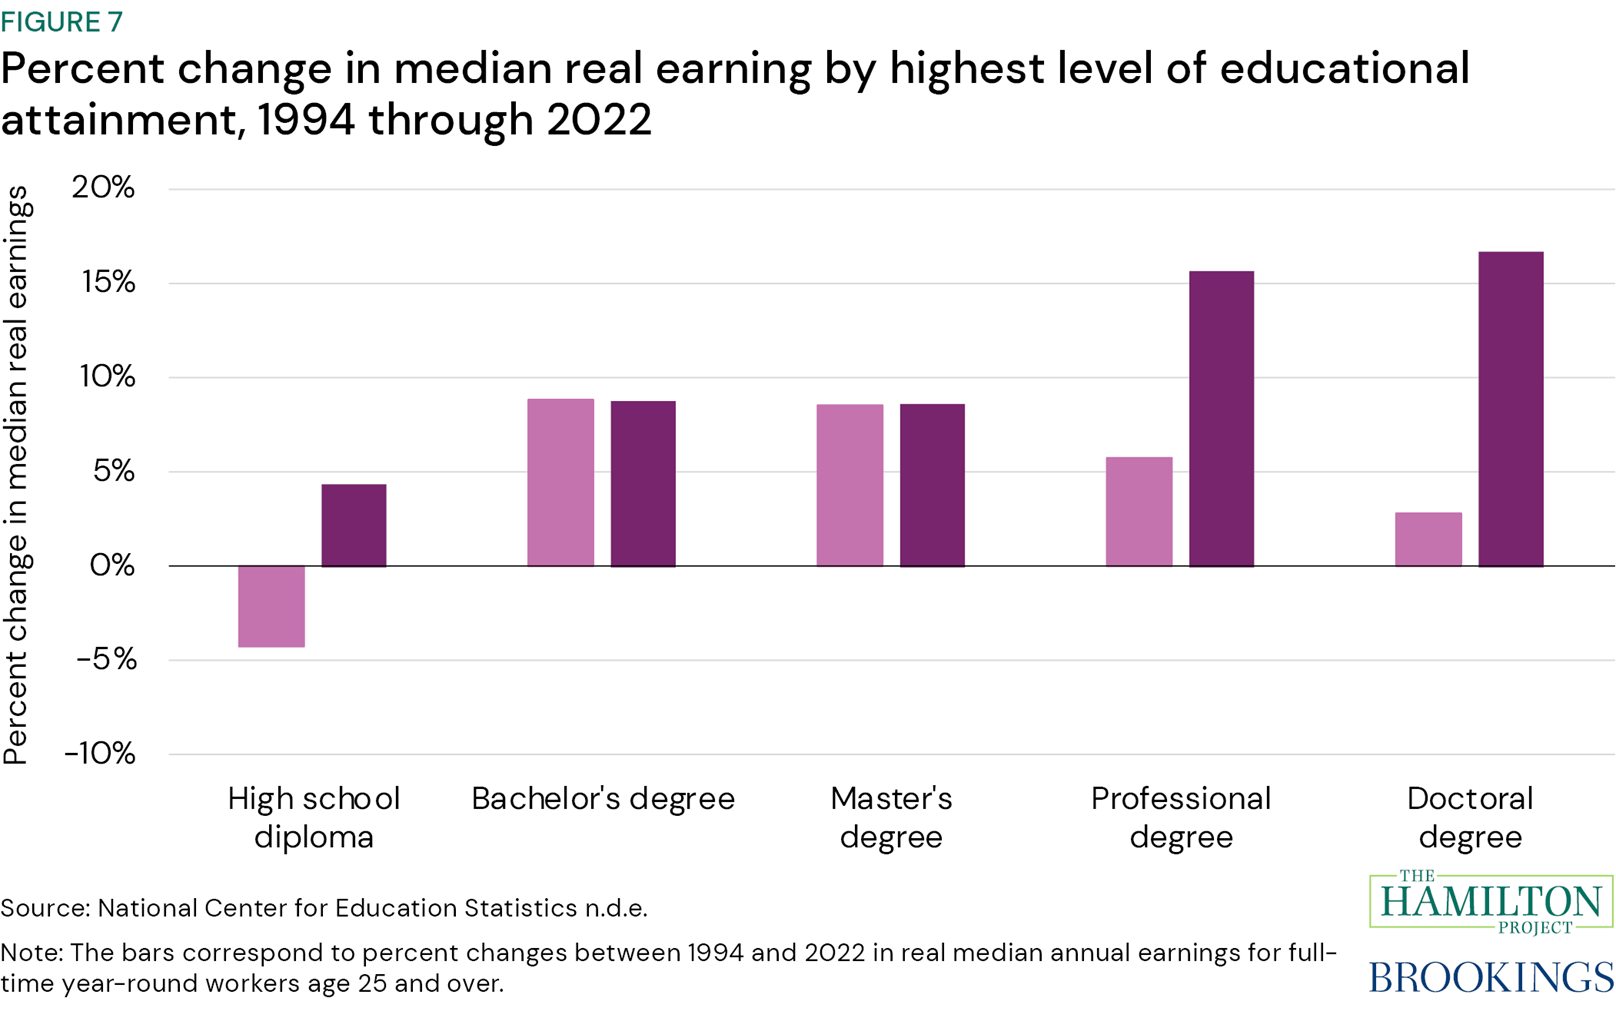
Figure 7 shows that since the mid-1990s, earnings for workers with higher education attainment have grown considerably. Among men, median real earnings increased only for those with college or advanced degrees. Men with a bachelor’s degree saw their earnings increase by 8.8 percent between 1994 and 2022, while men with a professional degree saw their real earnings increase by 5.7 percent over the same period. Men without higher education degrees have seen their real earnings decline. In contrast, women have seen their real median earnings increase across all education levels, with these increases being even higher at higher levels of educational attainment (4.3 percent for women with a high school diploma vs. 15.6 percent for women with a professional degree, such as a medical school degree). Note that those estimates of median real earnings take into account propensity to be in the labor force and numbers of hours worked.
Not all education is valued the same in the labor market (Broady and Hershbein 2020). For example, employed 35-to-44-year-olds with bachelor’s degrees in engineering or computer science and mathematics enjoy median earnings above $75,000 per year, while those with a major in education or psychology earn a little over $40,000 at the median (Urban Institute n.d.). The Hamilton Project provides an interactive about college graduates’ earnings by major and career stage.
Getting a degree in a specific field is not the only way to access high-paying jobs. Many technology companies, for example, do not require a bachelor’s degree but have a rigorous screening process to assess candidate skills (Lohr 2022). Coding boot camps, certificate programs, or freely available content online may suffice to prepare for these assessments.
Moreover, programs that promote work-based learning can help participants build connections in the labor market and provide opportunities to showcase one’s skills (Hoffman 2016). By acquiring skills valued by potential employers, candidates without degrees can compete for positions.
-
Fact 8: Education pays more for men than for women.
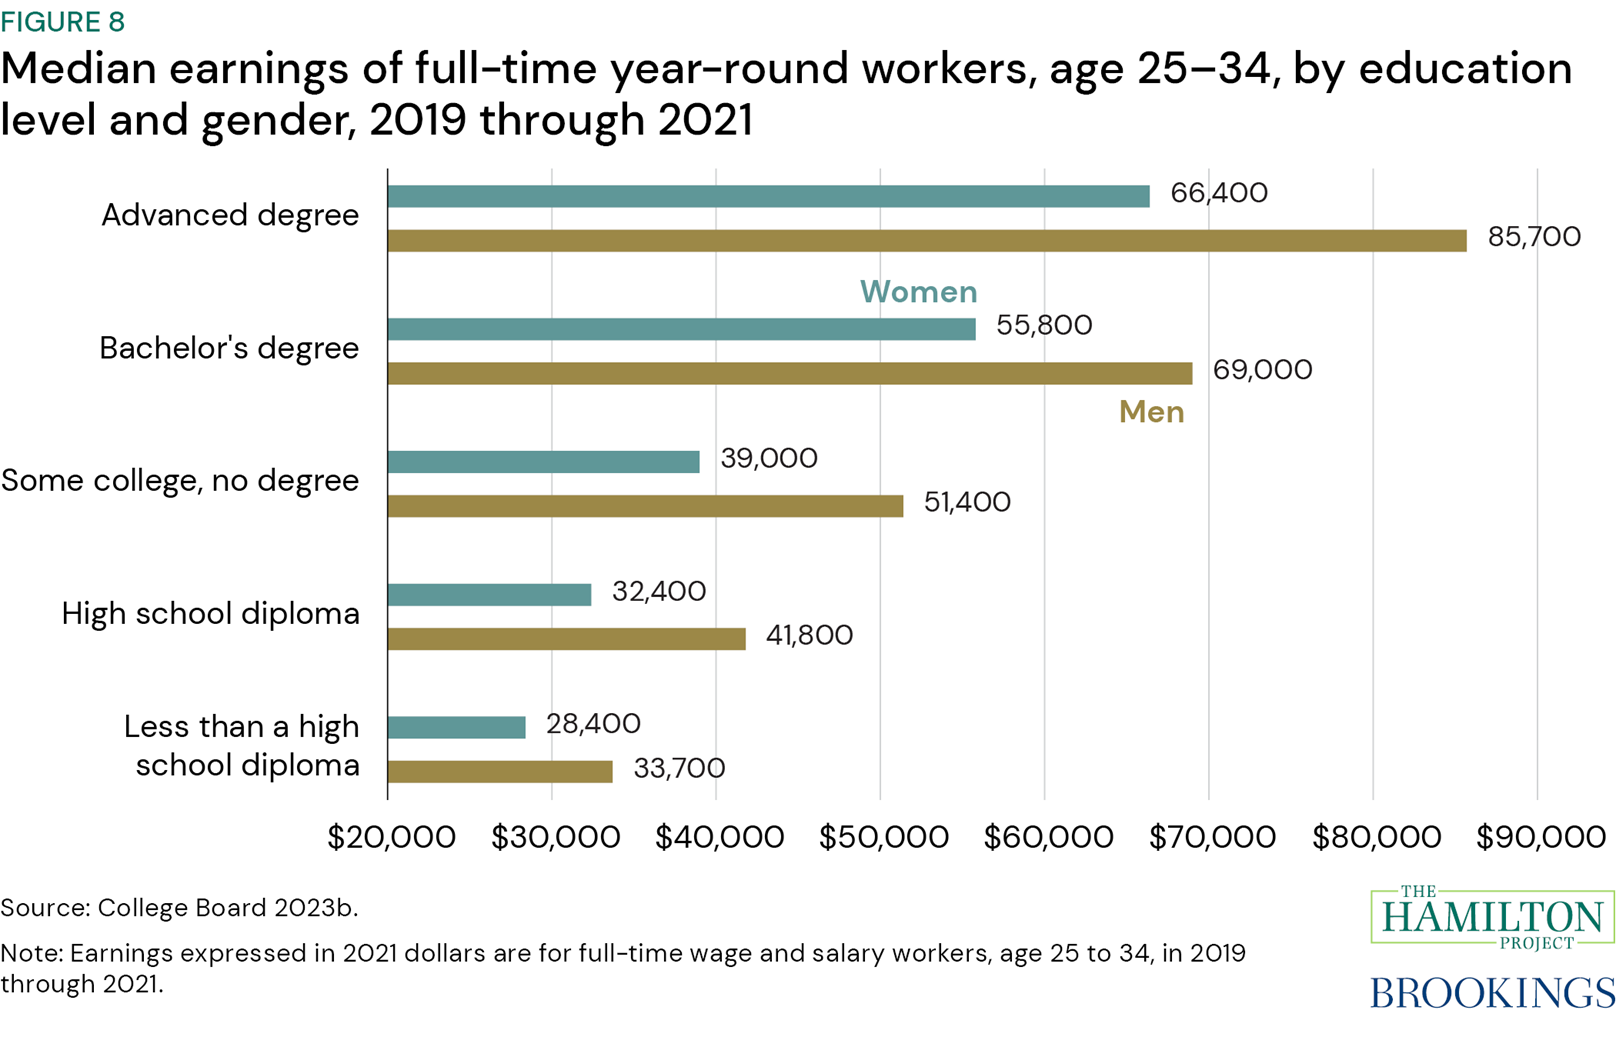
Figure A showed that higher education attainment is associated with a lower unemployment rate and higher earnings. However, not all groups experience the same increase in earnings related to greater education. Figure 8 compares median earnings for full-time male and female employees aged 25–34 by education level. Men earn more than women across all education levels. What is more, the gender pay gap increases as education attainment increases. Men with less than a high school diploma earn on average $5,300 per year more than their female counterparts. At the same time, men with a bachelor’s degree earn an average of $13,200 per year more than women with the same education level. The gender pay gap is the largest among advanced degree holders with men earning per year $19,300 more than women, on average.
These results suggest that access to education may not be sufficient to address gender inequalities in the labor market. In fact, women are more likely to have a bachelor’s degree than men (41.7 vs. 36.2 percent; Cheeseman Day 2019). To some extent, men and women concentrate in different fields of study and consequently occupations, which may pay differently. These differences may reflect preferences or different comparative advantages across fields (Goulas, Griselda, and Megalokonomou 2022). Even within the same occupations though, earning gaps between men and women exist. For example, women engineers earn around 90 cents for every dollar men engineers make (Cheeseman Day 2019). At the same time, in certain occupations, such as musicians, phlebotomists, electricians, and social workers, the earnings gap virtually disappears.
The need for temporal flexibility is a key driver of the gender pay gap. This gap may be larger in occupations where the renumeration structure benefits those who work long hours and particular hours (Goldin 2014). Because having children requires taking time off work, parenthood is associated with a labor market “penalty” (Binder et al. 2023; Petrongolo and Ronchi 2020). Gender differences in confidence may also play a key role in pay inequalities among science and technology graduates (Sterling et al. 2020).
Chapter 3: Innovation efforts in education
The flexibility of charter schools to choose curriculum, programs, and instructional methods, involve the community and parents, and offer specialized programs provides room for innovation in these areas. Charter schools tend to serve a higher proportion of Black, Hispanic, and economically disadvantaged students compared to traditional public schools. Over time, the representation of Black and Hispanic students in charter schools has increased, reinforcing their role in catering to marginalized communities. In terms of performance, charter schools have shown significant improvement. Charter Management Organizations (CMOs), which run multiple charter schools, have been particularly effective in accelerating student achievement. However, there remains variability in performance, with some charter schools excelling while others lag behind traditional public schools.
The COVID-19 pandemic led to a substantial increase in investment in education technology (EdTech) to support remote learning. This surge reflected high expectations for EdTech to provide flexible and effective learning solutions. However, challenges in demonstrating the impact of EdTech applications on learning outcomes have led to declines in EdTech investment after the pandemic. This trend suggests that sustained investment will require more robust evidence of EdTech’s effectiveness.
Investment in educational research and development (R&D) is crucial for fostering innovation and improving student outcomes. Programs like the Investing in Innovation (i3) and the Education Innovation and Research (EIR) Program have funded numerous projects aimed at developing, validating, and scaling effective educational practices.
-
Fact 9: Charter schools are more likely to serve Black, Hispanic, and economically disadvantaged students than traditional public schools.
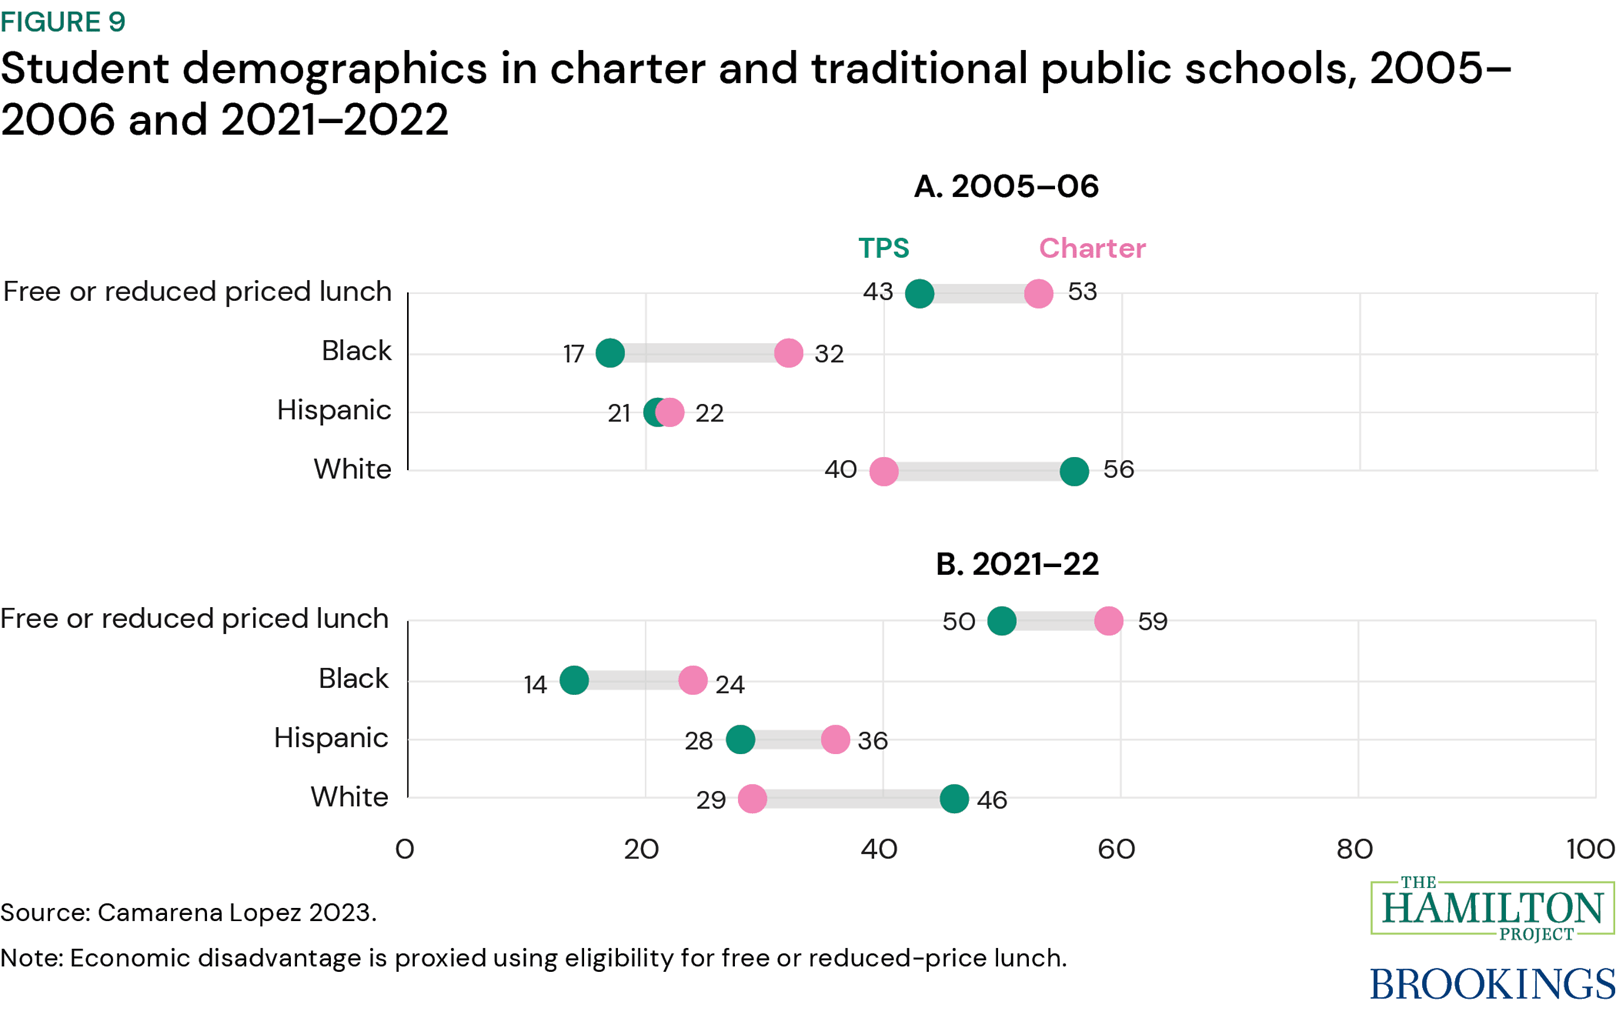
Figure 9 reports demographic characteristics of students in charter and traditional public schools in 2005–06 and 2021–22. In 2021–22, 59 and 50 percent of students in charter and traditional public schools, respectively, are economically disadvantaged (i.e., eligible for free or reduced priced lunch).
In 2021–22, charter schools served a greater share of Black students than traditional public schools (24 vs. 14 percent), but the difference used to be even larger in 2005–06. The share of Black students between 2005–06 and 2021–22 decreased in charter schools by 8 percentage points, while it increased in traditional public schools by 3 percentage points.
Charter schools also served a greater share of Hispanic students than traditional public schools did in 2021–22 (36 vs. 28 percent). This difference has widened over time. Between 2005–06 and 2021–22, the share of Hispanic students increased by 14 percentage points in charter schools and by 7 percentage points in traditional public schools.
These results point to charter schools serving a greater share of Black or Hispanic and economically disadvantaged students than traditional public schools did in 2021–22. The gap between charter and traditional public schools in the Black or Hispanic student representation is slightly wider in 2021–22 than it was in 2005–06 (18 vs. 16 percentage points). At the same time, the difference between charter and traditional public schools in their shares of economically disadvantaged students in 2021–22 is similar to that in 2005–06 (9 vs. 10 percentage points).
This fact explores the demographics of students served by charter schools. Fact 10 shows that charter schools hold the promise for improved educational outcomes for their students in certain contexts.
-
Fact 10: The learning gains of charter school students have increased over time.
Charter schools’ operational, financial, and program autonomy is provided in exchange for performance-based accountability (Manno et al. 2000, Goulas 2019a, 2019b, 2020). This allows them a greater scope to innovate on curriculum, instructional methods, community and parental involvement, and to offer specialized programs. Many charter schools have longer school days and school years. Enrollment in charter schools has grown over the past 23 years from 340,000 students in 1999–2000 to 3.7 million students in 2022–23 (NCES n.d.b). Charter schools are more common in some states than others (Reber and Gordon 2023).
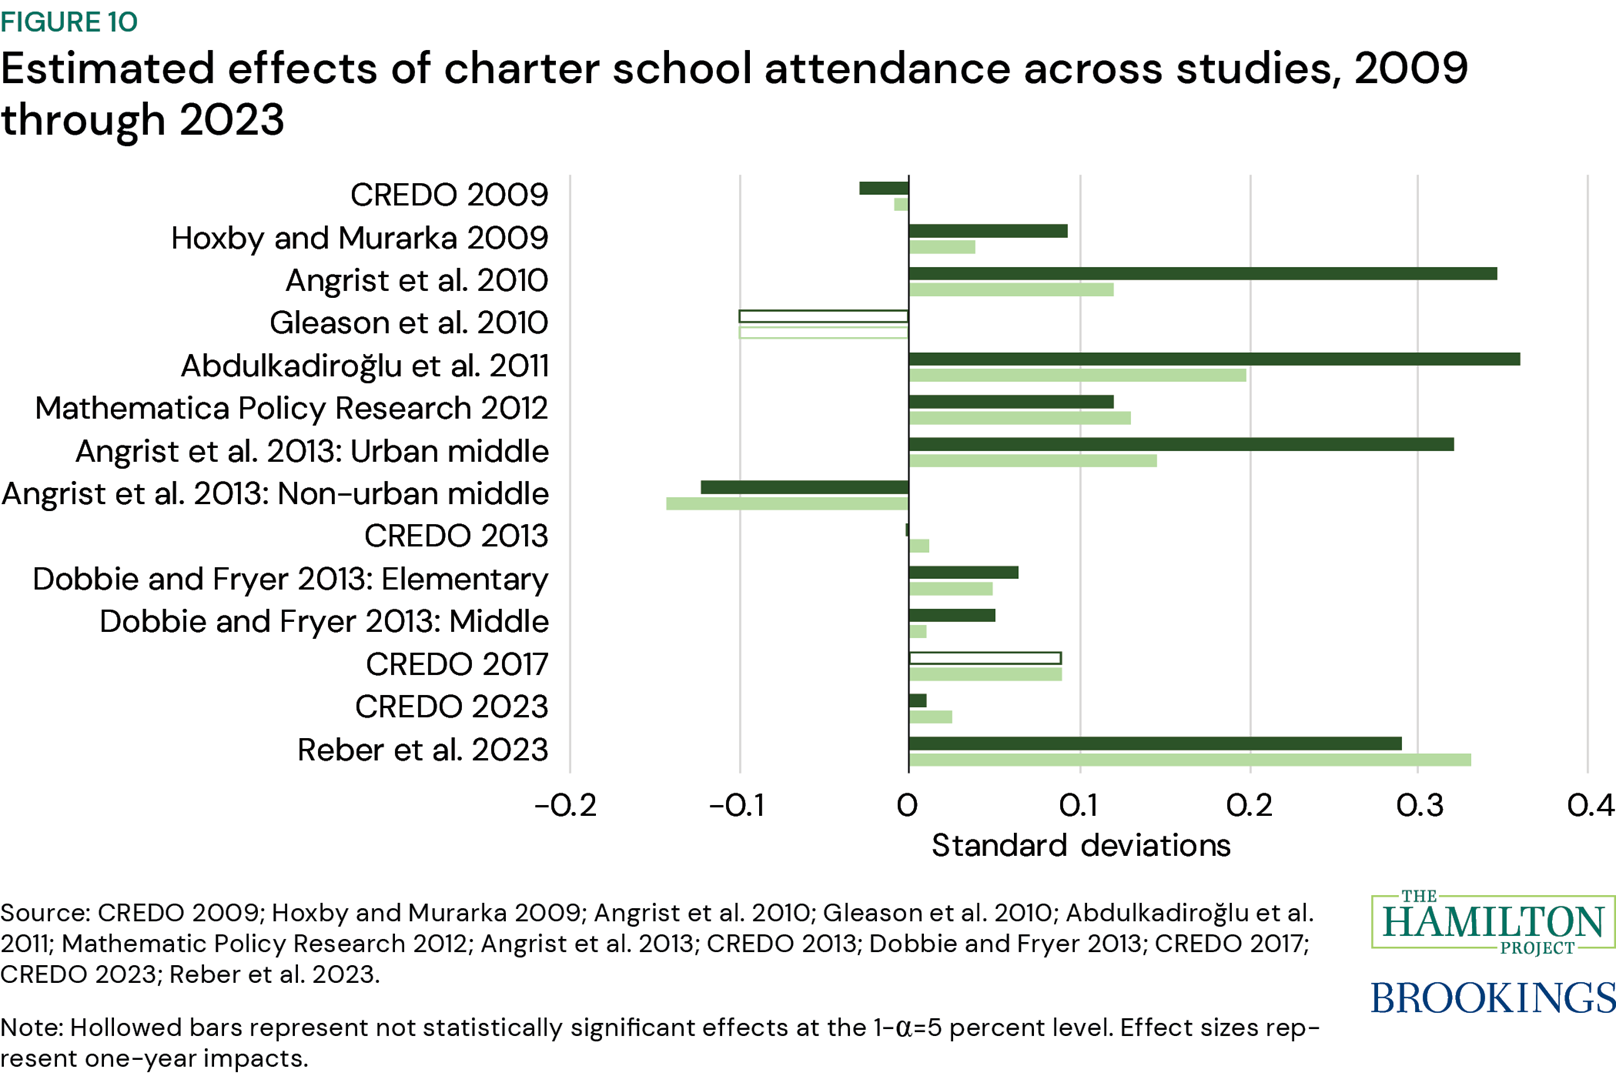
Charter school performance has evolved over time. As shown in figure 10, studies until the early 2010s showed that even though urban charter schools were able to significantly improve test scores for their students, nationwide evaluations reported that charters performed no better than traditional public schools (CREDO 2009; Gleason et al. 2010). A 2013 national charter school evaluation found that charters slightly bested traditional public schools in reading but were still lagging in math (CREDO 2013).
In a 2023 nationwide charter school evaluation, which included over 80 percent of tested public-school students, charter school students posted an average of 16 additional days of learning in reading and six additional days of learning in mathematics compared to similar peers in traditional public schools (CREDO 2023). Charter Management Organizations (CMOs) are particularly effective at accelerating student reading achievement. CMOs are organizations that establish and run multiple charter schools. Relative to stand-alone charter schools, CMO-affiliated schools advance reading by 17 additional days of learning. These results point to an improvement in charter school performance over time. Since the 2009 CREDO national charter school study, annual charter student learning in reading and mathematics has risen by 22 and 23 days, respectively.
The 2023 CREDO national charter school study shows that not all charter schools create strong learning gains for their students. Roughly 38 and 46 percent of charter schools post lower academic growth in reading and math, respectively, than their local traditional public schools. At the same time, more than 1,000 charter schools across the nation have managed to eliminate achievement gaps for their students and moved their students ahead of their respective state’s average achievement. Dozens of CMOs have created these results, suggesting that it is possible to scale equitable education that can change lives.
-
Fact 11: Investment in education technology (EdTech) spiked during COVID-19.
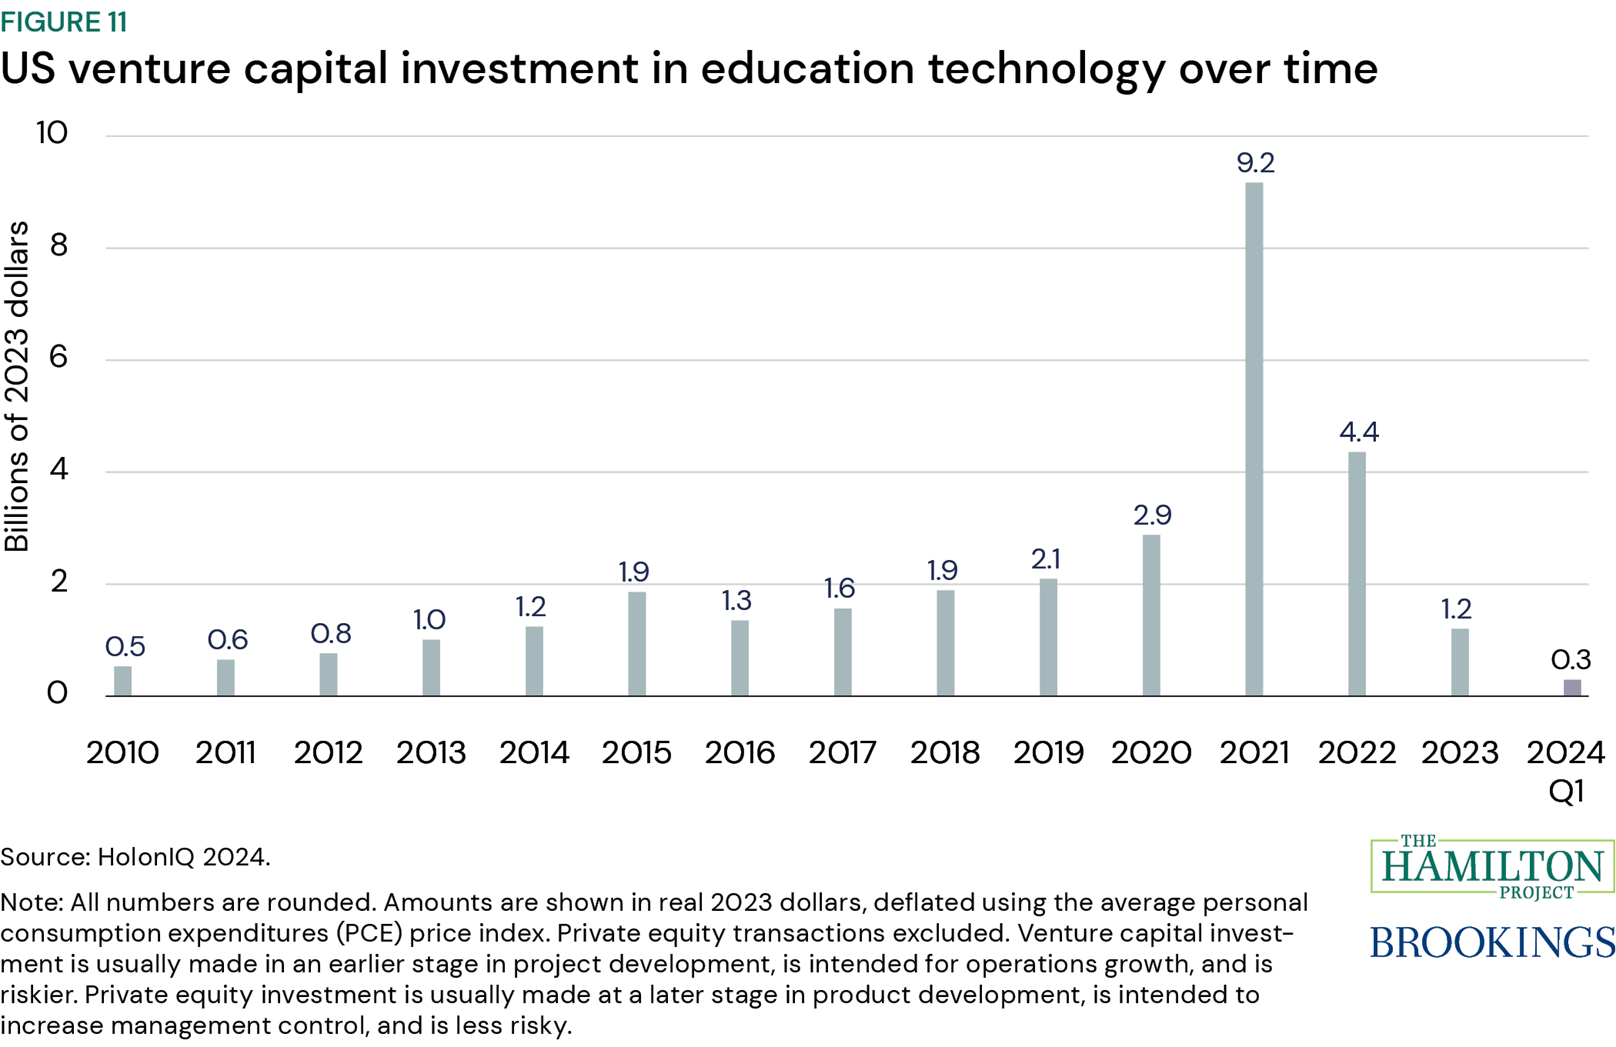
The COVID-19 pandemic saw an increase in remote learning across all age groups. The combination of a pandemic-induced spike in demand for technology that supports remote learning and advancements in technologies that allowed online learning journeys to be more adjustable to learner needs painted a promising picture for the EdTech sector. This translated to substantial investments in new ventures. Figure 11 shows that the investment by U.S. venture capital (VC) firms in EdTech increased by 37.4 percent in 2020, relative to 2019, and more than tripled in 2021, relative to 2020. In 2021, U.S. VCs invested $9.2 billion in 2023 dollars in EdTech. During the same period, international VCs also invested a lot in EdTech. The combined amount global VCs invested in EdTech in 2020 and 2021 in 2023 dollars is 6.4 percent larger than their cumulative investment in EdTech in the prior ten years. To put in context the level of investment in 2020 and 2021, over the same two-year period global VCs invested roughly twice as much on climate technology (HolonIQ 2023).
The EdTech hype during the pandemic reflected hopes that it would provide an effective yet economical way for upskilling. In a swiftly evolving job market, traditional higher education may not always suffice for workers to acquire cutting-edge skills, leading to an increased need for accessible and flexible learning solutions. The advancements in artificial intelligence that coincided with the pandemic also heralded a revolution in education with personalized and efficient learning experiences. However, as Patrick Brothers, co-CEO and co-founder of HolonIQ, notes, “EdTech has enjoyed a long run now of quite bold and ambitious venture capital supporting education innovation. And that’s not where we are today” (Saleh Rauf 2024).
Difficulties in crystallizing the impact of EdTech on learning outcomes have precluded many innovative ideas from maintaining investors’ interest. Potentially, some of these ideas were ahead of pedagogical research that would support a theory of change in learning outcomes. At the same time, the constant changes in EdTech products often made it difficult to consistently measure their impact on users. Regardless, VC investment collapsed after COVID-19. In 2022, global VC investment in EdTech dropped to $11 billion. In the same year, global VCs invested close to 7 times that amount ($73.9 billion in 2023 dollars) in climate technology (HolonIQ 2023). In 2023, EdTech ventures raised only $3 billion in investment.
Looking ahead, it is possible that as the digital revolution accelerates, EdTech will play an important role in the educational journeys of school-age learners and working professionals who want to freshen their skills. It is hard though to tell which tools and approaches will prevail in a context of increased pressure for EdTech ventures to go beyond hype and deliver evidence of actual educational effectiveness.
-
Fact 12: Investment in education research and development is crucial for innovation.
Given largely stagnant student performance (fact 1), a decline in public school enrollment (Burtis and Goulas 2023; Goulas 2024), and persistent gaps in high school graduation rates by race and ethnicity (fact 3), investment in a broad spectrum of education research and development is vital. This includes not only EdTech but also research on scalable implementation, school organization, and curriculum development. Effective scheduling and teacher assignments are crucial technologies that significantly affect learning, yet schools often struggle to implement these best practices. Fifteen years ago, the Obama administration launched the Investing in Innovation (i3) grant program under the American Recovery and Reinvestment Act of 2009 to stimulate research and innovation in education. The goal was to identify effective approaches and scale them (Department of Education n.d.c).
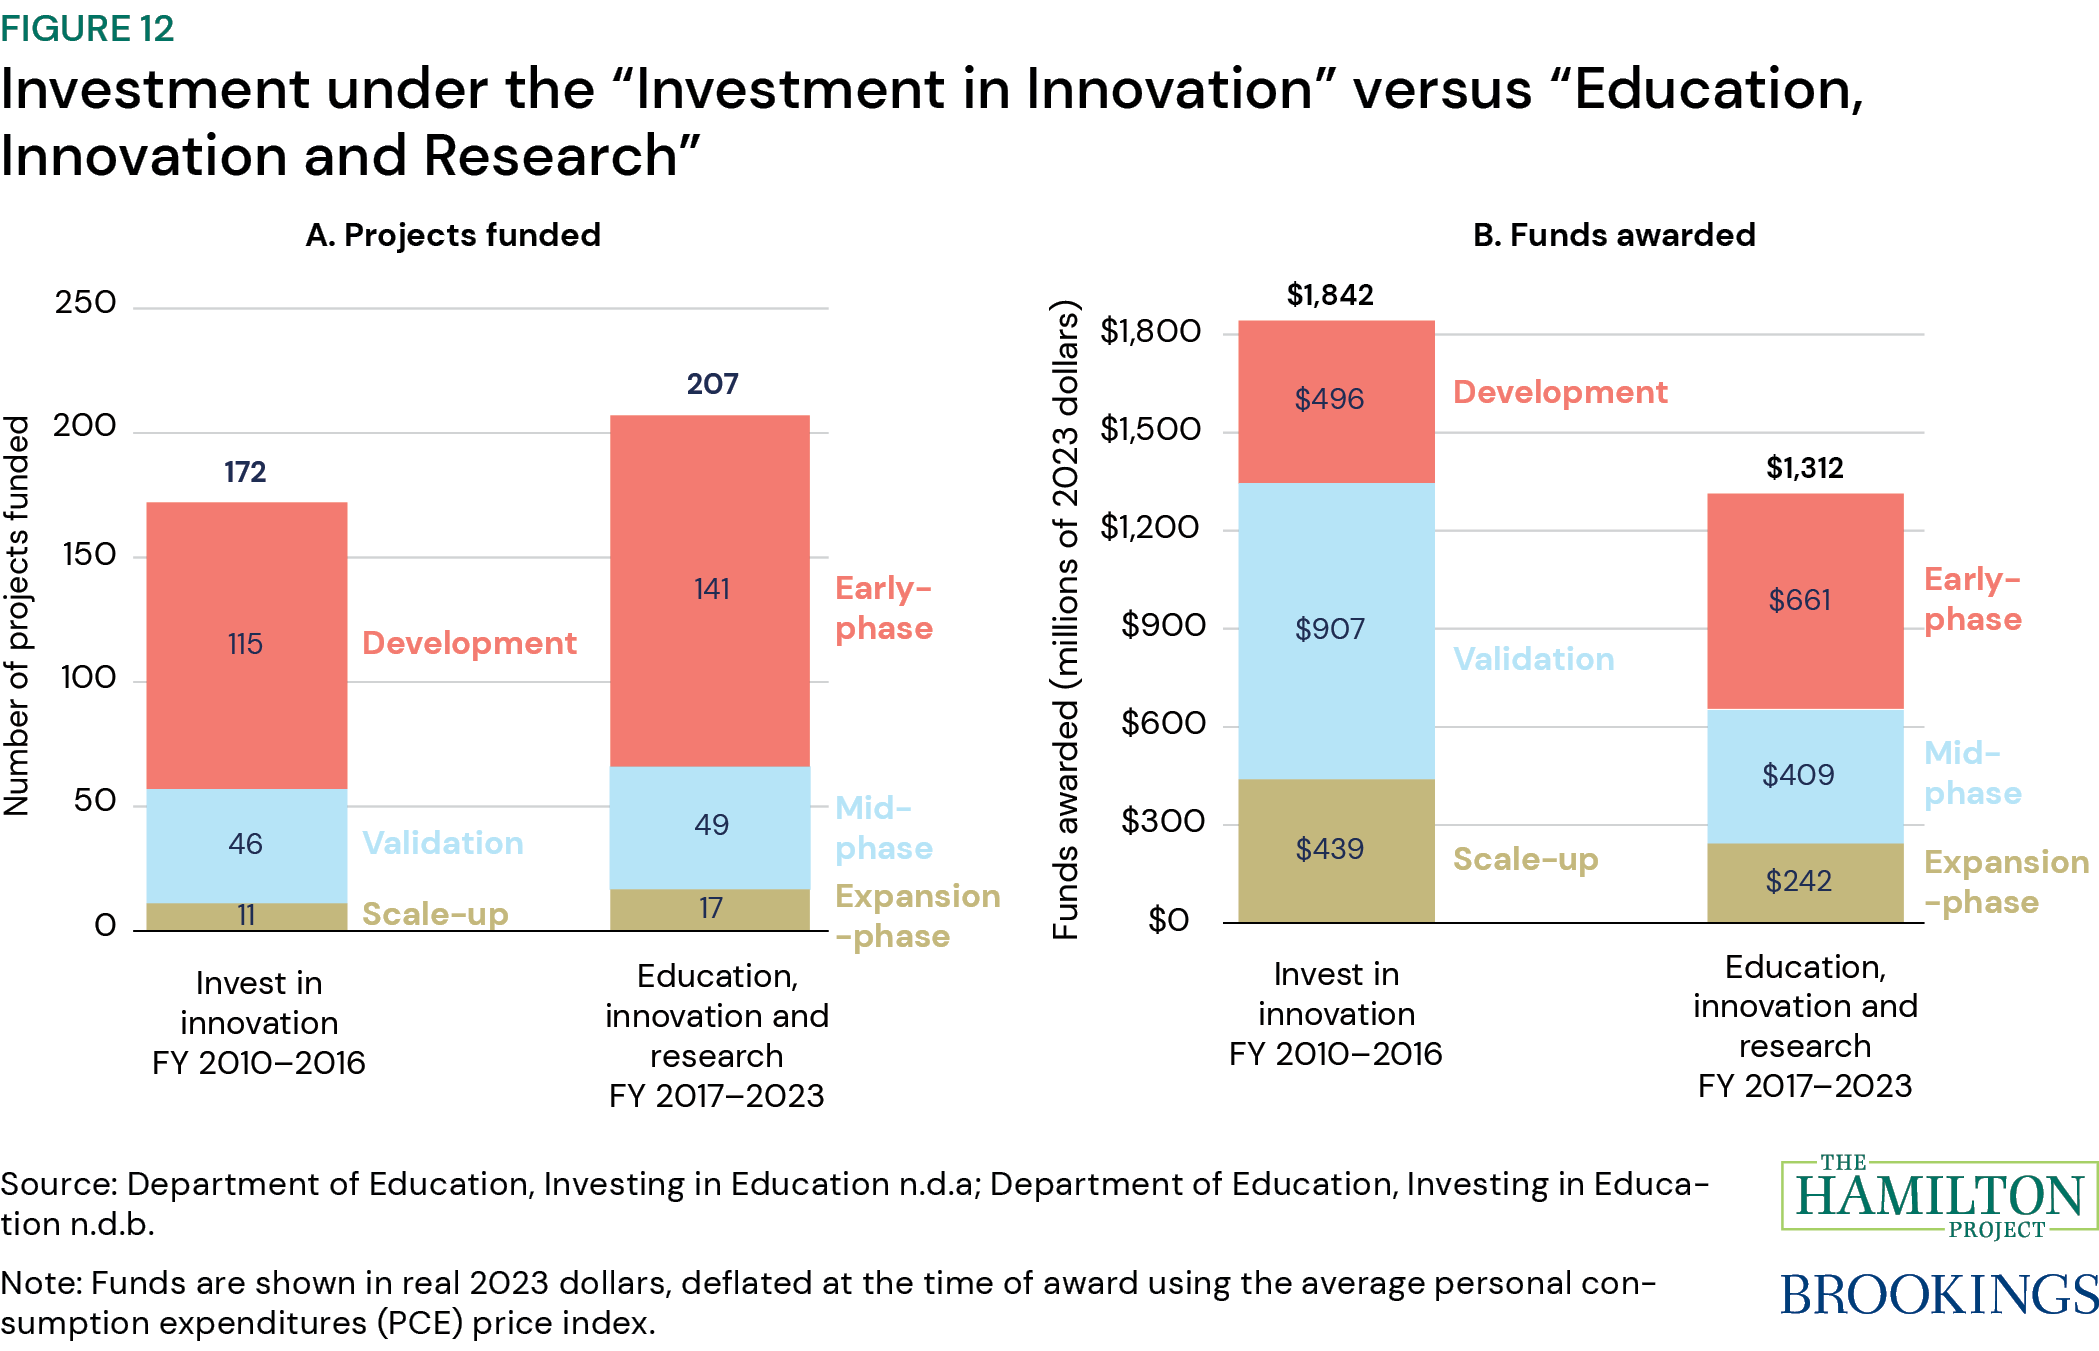
Between 2010 and 2016, 172 projects received an i3 grant. Of these, 115 were Development grants, which implemented and tested new ideas; 46 were Validation grants, which tested, refined, and expanded ideas supported by existing evidence; and 11 were Scale-up grants, which explored the feasibility of certain strategies to become national paradigms. Over the seven fiscal years between 2017 and 2023, 207 projects received funding through i3’s successor, the Education Innovation and Research Program (EIR). Of those, 141 focus on the development of new ideas (Early-phase grants), 49 focus on the implementation and rigorous evaluation of existing approaches (Mid-phase grants), and 17 focus on the scaling of proven practices (Expansion-phase grants).
A little over $1.8 billion in 2023 dollars were invested through i3 grants between 2010 and 2016. Under EIR, roughly $1.3 billion has been invested between 2017 and 2023, representing a decline of 16.5 percent in nominal terms and 28.8 percent in real terms compared to the seven fiscal years until 2016. The expansion of funded projects of all types and the decline in total funds provided under EIR relative to i3 indicate an increase in the ratio of innovative approaches pursued per dollar, as the average Mid-phase and Expansion-phase grant is smaller.
Developing new ideas is difficult and success is far from guaranteed. Among 148 i3 grants evaluated until the release of a 2023 report by the Department of Education, 26 percent or 39 of them (15 Development, 19 Validation, and five Scale-up grants) found at least one positive and statistically significant effect on student achievement (Department of Education 2024). Given how complex education is, a success rate of 26 percent is arguably high. For comparison purposes, around 90 percent of potential drugs that enter Phase I trials are destined to fail (Smietana et al. 2016). In that sense, identifying 39 evidence-based programs is a good start (Dinkes and Boulay 2024). Nonetheless, in a moment of declining confidence in public education (Goulas and Pula 2024), the need to fund education innovation and develop evidence-based strategies is stronger than ever.
-
Selected Hamilton Project papers on education
Why did schools lose students after COVID-19?
Sofoklis Goulas and Isabelle Pula | 2024
Public school enrollment losses post-pandemic cannot be fully attributed to changes in population, or shifts towards charter or private school enrollments, pointing to a rise in homeschooling among families. This trend raises questions about the motivations behind the increased interest in homeschooling. Targeted interviews reveal that these motivations have evolved since pre-pandemic times. This paper discusses the factors driving the decline in public school enrollment, highlighting that dissatisfaction with public schools after COVID-19 may have prompted families to consider alternatives such as homeschooling. However, the relationship between family satisfaction and public-school enrollment has become more complex after the pandemic, suggesting that additional factors are influencing enrollment decisions in the current K–12 education landscape.
Breaking down enrollment declines in public schools
Sofoklis Goulas | 2024
The newly released enrollment data from the National Center on Education Statistics for the 2022–23 school year point to moderate enrollment gains for traditional public schools. The recent enrollment gains though are smaller than the cumulative enrollment losses since 2019–20 and are not uniform. This paper takes stock of enrollment losses today by comparing the distribution of changes in public school enrollment since the COVID-19 pandemic to the distribution of pre-pandemic changes across the nation. Roughly 59, 69, and 69 percent of small, medium-sized, and large schools, respectively, saw their enrollment decline between 2019–20 and 2022–23. One third of small, medium-sized, and large schools with enrollment declines lost 26, 54, and 96 students or more, respectively (i.e., top third). The share of schools experiencing such declines after COVID-19 is larger than what would be expected based on historical variation for medium sized and large schools. Urban schools and middle schools are disproportionately represented among schools with enrollment losses in the top third.
Declining school enrollment since the pandemic
Eloise Burtis and Sofoklis Goulas | 2023
This paper investigates how student enrollment in public schools is different after the COVID-19 pandemic. Over the pandemic—between the 2018–19 and 2021–22 school years—about 12 percent of public elementary schools and 9 percent of middle schools experienced more than a 20 percent decline. This is a significant change from before the pandemic, when about 5 percent of elementary and middle schools saw a 20 percent enrollment decline between 2015–16 and 2018–19. Enrollment declines are widespread but differ substantially across types of schools, locales, and socioeconomic status. The analysis finds that urban districts and high poverty districts saw larger declines in school enrollment.
Increasing federal investment in children’s early care and education to raise quality, access, and affordability
Elizabeth E. Davis and Aaron Sojourner | 2021
The core challenge this proposal seeks to address is how to ensure that every American family and child has access to high-quality, affordable early childhood care and education (ECE) services in a critical period of human development, breaking a shortage of investment in young children. America’s status quo asks the most of parents when they have the least. The public invests only about $1,500 per child annually in care and education in children’s first 5 years of life, when parents have the least earning and borrowing power, and then invests $12,800 per child annually for the next 13 years, when parents have more. Under this proposal, every family can choose to access affordable ECE services at qualified, high-quality center-, home-, and school-based providers using either a slot that providers have been contracted to provide or a scholarship. Families in poverty can choose Early Head Start and Head Start with the option of full-time, full-year services. Total family financial payments are capped and depend on family income-to-poverty ratio. The combination of family and public payments to providers will adjust to be sufficient to cover the local costs of efficiently producing high-quality care and services. Competition focuses in three domains: procurement competitions for local service contracts that reveal information about local production costs, competition between providers about how best to use a localized sufficient care-labor budget to attract, develop, motivate, and retain care talent, and competition between providers to serve local families better.
Building tomorrow’s workforce today: Twin proposals for the future of learning, opportunity, and work
Richard Arum and Mitchell L. Stevens | 2020
The authors propose twin federal government initiatives to incentivize innovation in instructional delivery throughout the national postsecondary ecology, to bridge the divide between academia and the workforce system, and to accrete a cumulative science of adult learning. Under the first initiative, the federal government issues Learning Opportunity Credits (LOCs) to all U.S. adults who are either unemployed or who receive the Earned Income Tax Credit (EITC). LOCs will promote ongoing workforce training as well as the expansion of high-quality hybrid learning opportunities. Under the second initiative, the federal government establishes a national project on the Future of Learning, Opportunity, and Work (FLOW), a distributed collaboration between existing federal agencies and a network of competitively selected U.S. universities and their partners. FLOW will accumulate knowledge and inform policy on adult learning to serve the national interest moving forward. Packaged as dual initiatives and linked through data sharing and interoperability protocols, LOCs and FLOW are joint ventures.
Major decisions: What graduates earn over their lifetimes
Kristen E. Broady and Brad Hershbein | 2020
The authors provide two updated economic analyses and interactives on the earnings of college graduates by major: one set that shows career earnings profiles and lifetime earnings and another that shows an undergraduate student loan repayment calculator.
Employment, education, and the time use of American youth
Lauren Bauer, Emily Moss, Ryan Nunn, and Jay Shambaugh | 2019
The labor force participation rate is a key measure of economic health. While the decline in prime-age workers’ labor force participation receives much attention from policymakers, it is far outpaced by the decline in participation among younger workers. This analysis shows how changing employment and school enrollment patterns have contributed to declining labor force participation among youth, aged 16 to 24. Youth today are not disengaged; rather, declines in youth labor force participation primarily reflect a long-term but accelerating shift toward schooling and spending more time on education-related activities.
Reducing chronic absenteeism under the Every Student Succeeds Act
Lauren Bauer, Patrick Liu, Diane Whitmore Schanzenbach, and Jay Shambaugh | 2018
The Every Student Succeeds Act (ESSA; 2015) requires states to broaden school accountability beyond achievement on standardized tests and high school graduation rates. In this Hamilton Project strategy paper, the authors articulate a framework for states as they oversee implementation of statewide accountability plans under ESSA and describe how states differ in their approaches. The authors review the literature and present novel analyses of the factors at the school and student levels that relate to chronic absenteeism. Our analysis shows that health problems and socioeconomic status predict poor attendance, and that chronic absenteeism among students and schools is strongly persistent over time. The authors describe evidence-based strategies for schools as they work to reduce rates of chronic absence among students.
-
References
Abdulkadiroğlu, Atila, Joshua D. Angrist, Susan M. Dynarski, Thomas J. Kane, and Parag A. Pathak. 2011. “Accountability and Flexibility in Public Schools: Evidence from Boston’s Charters and Pilots.” Quarterly Journal of Economics 126 (2): 699–748.
Angrist, Joshua D., Susan M. Dynarski, Thomas J. Kane, Parag A. Pathak, and Christopher R. Walters. 2010. “Input and Impacts in Charter Schools: KIPP Lynn.” American Economic Review: Papers & Proceedings 100 (May 2010): 1–5.
Angrist, Joshua D., Pathak, P. A., & Walters, C. R. 2013. “Explaining Charter School Effectiveness.” American Economic Journal: Applied Economics 5 (4): 1–27.
Barnum, Matt. 2022. “High School Grades Are Up, but Test Scores Aren’t. Why?” Chalkbeat, March 16, 2022. https://www.chalkbeat.org/2022/3/16/22979947/high-school-grades-inflation-federal-naep-test-scores
Binder, Ariel J., Amanda Eng, Kendall Houghton, and Andrew Foote. 2023. “The Gender Pay Gap and Its Determinants across the Human Capital Distribution.” CES Working Paper 23–31.
Broady, Kristen E., and Brad Hershbein. 2020. “Major Decisions: What Graduates Earn Over Their Lifetimes.” The Hamilton Project, Brookings Institution, Washington, DC.
Burtis, Eloise, and Sofoklis Goulas. 2023. “Declining School Enrollment Since the Pandemic.” The Hamilton Project, Brookings Institution, Washington, DC.
Camarena Lopez, Natalie. 2023. “Who Attends Charter Schools?” National Alliance for Public Charter Schools, Washington, DC.
Center for Research on Education Outcomes (CREDO). 2009. “National Charter School Study II.” Center for Research on Education Outcomes, Stanford University, Stanford, CA.
Cheeseman Day, Jennifer. 2019. “Among the Educated, Women Earn 74 Cents for Every Dollar Men Make.” U.S. Census Bureau, Suitland, MD.
College Board. 2023a. “Trends in College Pricing and Student Aid 2023.” College Board, New York, NY.
College Board. 2023b. “Education Pays 2023: The Benefits of Higher Education for Individuals and Society.” College Board, New York, NY.
Cremata, Edward, Devora Davis, Kathleen Dickey, Kristina Lawyer, Yohannes Negassi, Margaret E. Raymond, and James L. Woodworth (CREDO). 2013. “National Charter School Study II.” Center for Research on Education Outcomes, Stanford University, Stanford, CA.
Department of Education. n.d.a. “Investing in Education: i3 Awards.” Department of Education, Washington, DC.
Department of Education. n.d.b. “Investing in Education: Education, Innovation and Research Awards.” Department of Education, Washington, DC.
Department of Education. n.d.c. “Investing in Education (i3).” Department of Education, Washington, DC.
Department of Education. 2024. “Federal Efforts Towards Investing in Innovation in Education Through the i3 Fund: A Summary of Grantmaking and Evidence-Building.” Department of Education, Washington, DC.
Dinkes, Rachel, and Beth Boulay. 2024. “Investing in Education R&D is Essential—and It’s Not Just About Numbers.” The 74, May 20, 2024.
Dobbie, Will, and Roland G. Fryer Jr. 2013. “Getting Beneath the Veil of Effective Schools: Evidence from New York City.” American Economic Journal: Applied Economics 5 (4): 28–60.
Gleason, Philip, Melissa Clark, Christina Clark Tuttle, Emily Dwoyer, and Marsha Silverberg. 2010. “The Evaluation of Charter School Impacts: Final Report.” NCEE 2010-4029, National Center for Education Evaluation and Regional Assistance, Institute of Education Sciences, U.S. Department of Education, Washington, DC.
Goldin, Claudia. 2014. “A Grand Gender Convergence: Its Last Chapter.” American Economic Review 104 (4): 1091–119.
Goulas, Sofoklis, Margaret E. Raymond, Lauren Bierbaum, Lindsay Bell, Meghan Cotter Mazzola, and Will Snow (CREDO). 2017. “The Impact of Scaling the New Orleans Charter Restart Model on Student Performance: Final Impact Analysis.” Center for Research on Education Outcomes, Stanford University, Stanford, CA.
Goulas, Sofoklis. 2019a. “Charter School Performance in Washington State.” Center for Research on Education Outcomes, Stanford University, Stanford, CA.
Goulas, Sofoklis. 2019b. “Charter School Performance in South Carolina.” Center for Research on Education Outcomes, Stanford University, Stanford, CA.
Goulas, Sofoklis. 2020. “Charter School Performance in Washington State: An Update.” Center for Research on Education Outcomes, Stanford University, Stanford, CA.
Goulas, Sofoklis. 2024. “Breaking Down Enrollment Declines in Public Schools.” The Hamilton Project, Brookings Institution, Washington, DC.
Goulas, Sofoklis, Silvia Griselda, and Rigissa Megalokonomou. 2022. “Comparative Advantage and Gender Gap in STEM.” Journal of Human Resources 0320-10781R2.
Goulas, Sofoklis, and Isabelle Pula. 2024. “Why Did Schools Lose Students After COVID-19?” The Hamilton Project, Brookings Institution, Washington, DC.
Hamilton, Ilana, and Veronica Beagle. 2024. “By the Numbers: The Rise of Online Learning in the U.S.” Forbes Advisor, Jersey City, NJ.
Hanushek, Eric A., and Bradley Strauss. 2024. “A Global Perspective of US Learning Losses.” Hoover Institution, Stanford University, Stanford, CA.
Hoffman, Nancy. 2016. “It’s Whom You Know: Work-based Learning Helps Build Labor Market Connections.” The Brookings Institution, Washington, DC.
HolonIQ. 2023. “$19.5B of Climate Tech VC Funding for Q3 2023, Now $40B YTD. Upgrading Our 2023 FY Forecast to $46.7B.” HolonIQ, New York, NY. https://www.holoniq.com/notes/19-5b-of-climate-tech-vc-funding-for-q3-2023-now-40b-ytd-upgrading-our-2023-fy-forecast-to-46-7b
HolonIQ. 2024. “EdTech VC Collapse at $850M for Q1. Not Even an AI Tailwind Could Hold Up This 10 Year Low.” HolonIQ, New York, NY. https://www.holoniq.com/notes/edtech-vc-collapse-at-580m-for-q1-not-even-an-ai-tailwind-could-hold-up-the-10-year-low
Hoxby, Caroline M., and Sonali Murarka. 2009. “Charter Schools in New York City: Who Enrolls and How They Affect Their Students’ Achievement.” Working Paper 14852, National Bureau of Economic Research, Cambridge, MA.
Levine, Phillip. 2024. “Ignore the Sticker Price: How Have College Prices Really Changed?” The Brookings Institution, Washington, DC.
Lohr, Steve. 2022. “A 4-Year Degree Isn’t Quite the Job Requirement It Used to Be.” The New York Times, April 8, 2022. https://www.nytimes.com/2022/04/08/business/hiring-without-college-degree.html
Manno, Brunno V., Chester E. Finn Jr., and Gregg Vanourek. 2000. “Charter School Accountability: Problems and Prospects.” Educational Policy 14 (4): 473–93.
Mathematica Policy Research. 2012. “Charter-School Management Organizations: Diverse Strategies and Diverse Student Impacts.” Mathematica Policy Research, Washington, DC.
National Center for Education Statistics (NCES). n.d.a. “National Assessment of Educational Progress (NAEP).” U.S. Department of Education, National Center for Education Statistics, Washington, DC.
National Center for Education Statistics (NCES). n.d.b. “Digest of Education Statistics: Table 216:90.” U.S. Department of Education, National Center for Education Statistics, Washington, DC.
National Center for Education Statistics (NCES). n.d.c. “Digest of Education Statistics: Table 219:46.” U.S. Department of Education, National Center for Education Statistics, Washington, DC.
National Center for Education Statistics (NCES). n.d.d. “Digest of Education Statistics: Table 311:15.” U.S. Department of Education, National Center for Education Statistics, Washington, DC.
National Center for Education Statistics (NCES). n.d.e. “Digest of Education Statistics: Table 502:20.” U.S. Department of Education, National Center for Education Statistics, Washington, DC.
National Center for Education Statistics (NCES). 2020. “National Postsecondary Student Aid Study: 2020 Undergraduate Students.” U.S. Department of Education, National Center for Education Statistics, Washington, DC.
National Commission on Excellence in Education (NCEE). 1983. “A Nation at Risk: The imperative for Educational Reform.” The Elementary School Journal 84 (2): 113–30.
Organization for Economic Cooperation and Development (OECD). n.d. “Program for International Student Assessment (PISA) 2022 Database, Volume I Tables I.B1.2.1, I.B1.2.2, I.B1.5.4, and I.B1.5.5.” Organization for Economic Cooperation and Development, Paris, France.
Petrongolo, Barbara, and Maddalena Ronchi. 2020. “Gender Gaps and the Structure of Local Labor Markets.” Labour Economics 64: 101819.
Raymond, M. E., Chunping Han, Sofoklis Goulas, Won Fy Lee, and Charla Waeiss (CREDO). 2020. “Estimates of Learning Loss in the 2019-20 School Year.” Center for Research on Education Outcomes, Stanford University, Stanford, CA.
Raymond, Margaret E., James L. Woodworth, Won Fy Lee, and Sally Bachofer (CREDO). 2023. “As a Matter of Fact: National Charter School Study III.” Center for Research on Education Outcomes, Stanford University, Stanford, CA.
Reber, Sarah, and Nora Gordon. 2023. “A Primer on Elementary and Secondary Education in the United States: Who Does What and How Do We Pay for It?” The Brookings Institution, Washington, DC.
Reber, Sarah, Dennis Rünger, and Mitchell D. Wong. 2023. “The Effects of Charter High Schools on Academic Achievement and College Enrollment: Evidence from Los Angeles.” Education Finance and Policy 1–19.
Saleh Rauf, David. 2024. “An Ed-Tech Venture Funding ‘Collapse’ During Q1 of 2024.” EdWeek Market Brief, April 25, 2024. https://marketbrief.edweek.org/financing-investment/an-ed-tech-venture-funding-collapse-during-q1-of-2024/2024/04
Sato, Simone N., Condes Moreno, E., Rubio-Zarapuz, A., Dalamitros, A. A., Yañez-Sepulveda, R., Tornero-Aguilera, J. F., and Clemente-Suárez, V. J. 2023. “Navigating the New Normal: Adapting Online and Distance Learning in the Post-Pandemic Era.” Education Sciences 14 (1): 19.
Smietana, Katarzyna, Marcin Siatkowski, and Martin Møller. 2016. “Trends in Clinical Success Rates.” Nature Reviews Drug Discovery 15 (6): 379–80.
Sterling, Adina D., Marissa E. Thompson, Shiya Wang, Abisola Kusimo, Shannon Gilmartin, and Sheri Sheppard. 2020. “The Confidence Gap Predicts the Gender Pay Gap Among STEM Graduates.” Proceedings of the National Academy of Sciences 117 (48): 30303–8.
The Economist. 2024. “New Numbers Show Falling Standards in American High Schools.” The Economist, March 10, 2024. https://www.economist.com/united-states/2024/03/10/new-numbers-show-falling-standards-in-american-high-schools
Villasenor, John, 2022. “Online College Classes Can Be Better Than In-Person Ones. The Implications for Higher Ed Are Profound.” The Brookings Institution, Washington, DC.
Urban Institute. n.d. “Understanding College Affordability: Variation in Earnings After College.” Urban Institute, Washington, DC.
U.S. Bureau of Labor Statistics. 2023. “Earnings and Unemployment Rates by Educational Attainment, 2023.” U.S. Bureau of Labor Statistics, Washington, DC.
U.S. Census Bureau. n.d. “Current Population Survey, Annual Social and Economic Supplement.” U.S. Census Bureau, Suitland, MD.
Author

Related Content


-
Acknowledgements and disclosures
The author is grateful to Lauren Bauer, Wendy Edelberg, and Sarah Reber for their generous feedback. Victoria Yan and Zhengtai Zheng provided excellent research support.
The Brookings Institution is financed through the support of a diverse array of foundations, corporations, governments, individuals, as well as an endowment. A list of donors can be found in our annual reports published online here. The findings, interpretations, and conclusions in this report are solely those of its author(s) and are not influenced by any donation.
-
Footnotes
- Luxembourg, which is a member country of the OECD, did not participate in the PISA 2022 study and is excluded.
The Brookings Institution is committed to quality, independence, and impact.
We are supported by a diverse array of funders. In line with our values and policies, each Brookings publication represents the sole views of its author(s).