The U.S. social safety net is a collection of programs designed to support families experiencing financial hardship. The design of some of the programs is largely determined by the states, while others have structures and benefits largely determined at the federal level. State and federal policies interact to determine benefit levels—for example, state-directed cash transfers reduce eligibility for federally-directed food assistance. As a result, similar families are eligible for substantially different benefit packages depending on where they live.
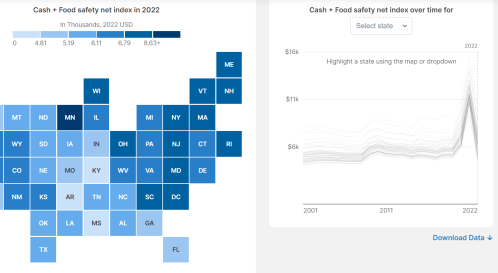
Explore the State Safety Net Interactive
One might expect that “blue states”—defined here as those that voted for Biden in 2020— have more generous safety net benefits. We explore benefit variation by state political leaning and find that this is true for programs under state control—blue states generally have higher average state-directed benefit levels. However, “red states”—defined as those that voted for Trump in 2020—generally have higher average federally-directed benefit levels. Although total benefit levels are higher in blue states, federally-directed benefits narrow the gap (and close the gap after adjusting for state cost-of-living differences). In other words, the federal government is providing more assistance to residents of less generous states, which largely offsets disparities in state-directed benefit generosity.
Background
While the federal government provides some social safety net support to eligible low-income Americans, states play a major role in structuring certain support programs for their residents. For instance, the Temporary Assistance for Needy Families (TANF) program is partially funded through federal block grants, but states have wide leeway in how the money is spent. States also often use state Earned Income Tax Credits (EITCs) to bolster support for low-income families. However, state-level benefit generosity variation isn’t solely determined based on state-directed benefits. The Supplemental Nutrition Assistance Program (SNAP), which is funded and directed by the federal government, is partially dependent on how much cash assistance a household is receiving from programs like TANF.
We analyze how state choices for the programs they most directly control—TANF and the state EITC—vary based on a state’s political leaning and impact overall benefit generosity. We focus on 2019 generosity because it excludes pandemic-related safety net expansions that have since expired.
To investigate state-level variation in benefit generosity, we calculate the benefits theoretically available to a fixed group of single-parent families if they lived in different states. Through this approach (described in our data appendix), we hold constant differences in demographic factors and earnings across states. We aggregate average values of food and cash benefits available to this fixed group of single-parent families into an index of generosity reported in 2022 dollars. Therefore, any state-level differences in average benefit amounts can be attributed to differences in benefit rules.
State-directed benefit generosity is higher among blue states
Our benefit index incorporates two state-directed benefit programs: TANF and the state EITC. Both programs provide benefits in the form of cash assistance.
TANF provides cash assistance to low-income families with children, in addition to funding a variety of other initiatives that are excluded from our benefit index. It is jointly funded through federal block grants and state contributions, but states have discretion over how the money is spent. State EITCs are tax credits available to individuals with earnings. Credit amounts are dependent on factors such as marital status, number of dependents, and income. As of Spring 2024, 31 states and the District of Columbia have their own EITC. All but four of the 31 state EITCs are refundable, meaning low-income recipients can actually receive “cash back” if their tax credit benefits exceed their income taxes owed. As of 2019, the year this analysis focuses on, 29 states had their own EITC.
Figures 1 and 2 show that there’s a direct relationship between Biden vote share and state-directed benefit generosity, regardless of whether adjusting for differences in cost-of-living across states (although the relationship is less steep after adjusting for cost-of-living). In other words, state benefit generosity tends to increase with Democratic leaning.
On average, states that voted for Biden provide 50% more in benefits than states that voted for Trump ($1,971 compared to $1,318). This difference narrows slightly after adjusting for cost-of-living differences between states, but blue states still provide 36% more in benefits. It is important to note that not every state follows this pattern—for example, Ohio has a more generous combined state-directed benefit than Delaware.
Notably, blue states are more likely to have a state EITC than red states. Among states with a state EITC, blue states tend to be more generous in terms of both their TANF and state EITC benefits.
There’s been a recent movement among states to implement a state child tax credit (CTC) in addition to other state-directed benefits. Currently, fifteen states offer their own CTC and eleven of these CTCs are refundable. Only three states with their own CTC are red, with all three restricting their CTC to non-refundable credit.1 We exclude state CTCs from our analysis because of data limitations, but disproportionate adoption of state CTCs by blue states further exacerbates the partisan gap in state-directed benefit generosity.2
Federally-directed benefit generosity is higher among red states
Our benefit index incorporates three federally-directed benefit programs: SNAP, the federal EITC, and the federal refundable CTC.
SNAP—previously called the Food Stamp Program—provides financial assistance for food purchases. The federal EITC is the largest cash transfer program in the U.S. and is structured similarly to state EITCs, although all federal EITC tax credits are refundable (meaning, they can more than offset tax liability to generate a negative income tax). The federal CTC is another type of tax credit. It is provided to low- and middle-income households for each dependent child under 17. The federal CTC credit is not fully refundable, and our index only incorporates the refundable portion.
Eligibility for federal EITC and the federal refundable CTC is the same across states for a comparable population. However, cash welfare assistance income is considered in determining SNAP eligibility, so SNAP benefits tend to be higher in states with weaker TANF cash supports (red states). This means households in red states tend to receive a lower portion of their total benefits in the form of cash. The cash share of benefits is about four percentage points higher in states that voted for Biden than states that voted for Trump (74% cash share compared to 70% cash share).
Figures 3 and 4 show that there is an inverse relationship between Biden vote share and federal benefit generosity, meaning higher Biden vote share generally corresponds with lower average federal benefit eligibility. This gap is more evident after adjusting for state cost of living differences, reflecting the higher average cost of living in blue states.
Prior to adjusting for cost-of-living differences, the federal government provides 1% less in benefits to states that voted for Biden than states that voted for Trump. This stems from the fact that more SNAP benefits go to places with weaker TANF programs. After adjusting for cost-of-living, the federal government provides 10% less to blue states, which translates to $518 less for a typical non-immigrant, non-disabled single parent family ($4,477 compared to $4,995).
Does overall benefit generosity vary by state political leaning?
After adding together both state- and federally-directed benefits, people in blue states still tend to be eligible for more benefits than their counterparts in red states—but this gap disappears after accounting for cost-of-living differences. Prior to adjusting for cost-of-living, people living in states that voted for Biden are eligible for $595 (10%) more in benefits on average than people in states that voted for Trump. However, after adjusting for cost-of-living, generosity in blue states is $10 (or 0.16%) lower than generosity in red states.
Importantly, there are exceptions to this pattern—for instance, there are red states that provide more generous benefits than some blue states. Additionally, there is incomplete take-up: Not all families access programs for which they are eligible and participation may vary by state, which isn’t captured in our generosity index.
Takeaways
While blue states generally provide more benefits to their residents through TANF and state tax credits, the federal government is partially offsetting state benefit differences through food assistance payments. Additionally, red and blue state benefit generosity is more equal than it might appear at first glance because less generous states tend to have lower costs of living. This means both that the federal government is providing more support to residents of less generous states, and that residents in less generous states are receiving a higher percentage of their benefits in the form of food assistance rather than cash transfers.
Check out our State Safety Net Interactive to further explore state-level differences in safety net generosity.
Authors


Related Content


-
Acknowledgements and disclosures
The Brookings Institution is financed through the support of a diverse array of foundations, corporations, governments, individuals, as well as an endowment. A list of donors can be found in our annual reports published online here. The findings, interpretations, and conclusions in this report are solely those of its author(s) and are not influenced by any donation.
-
Footnotes
- The states with a state-directed CTC that voted for Trump are Idaho, Oklahoma, and Utah.
- We use the National Bureau of Economic Research Taxsim program (https://taxsim.nber.org/taxsim35/) to calculate generosity for the federal EITC, state EITC, and the refundable portion of the federal Child Tax Credit. The Taxsim program does not yet include the most recent years of state tax information and does not separately report state CTC amounts.
The Brookings Institution is committed to quality, independence, and impact.
We are supported by a diverse array of funders. In line with our values and policies, each Brookings publication represents the sole views of its author(s).