During the last two decades, it has become commonplace for presidential candidates on both sides of the aisle to pledge to not raise taxes on at least some income groups. For example, in 2008 John McCain promised to not raise taxes on any income group, whereas Barack Obama pledged to not raise taxes on individuals earning less than $200,000 and on families earning less than $250,000. Likewise, in 2016 Donald Trump pledged to reduce taxes for the middle class, and Hillary Clinton pledged to not raise taxes on individuals earning less than $250,000. Most recently, in 2020 Joe Biden pledged to not raise taxes on anyone making less than $400,000, and in 2024 Kamala Harris re-affirmed this commitment.
These pledges are clearly made to insulate “middle-class” households (and middle-class voters!) from increases in their taxes. Therefore, they are also a statement about who should bear the burden of financing federal spending and how progressive the tax system should be.
But these pledges also complicate the development and implementation of good tax policy. By design, they place a large share of the tax base “off the table,” making it harder to raise revenue. Less obviously, these pledges also make it harder to raise revenue from higher-income households because they effectively exempt a portion of higher-income households’ income from taxation. This makes it harder to increase the progressivity of the income tax. Finally, these pledges can make it politically or practically difficult to enact and implement new tax or spending programs. This has caused some awkward episodes in the past and could make it difficult to negotiate a future deficit reduction deal by taking certain policies off the table before the discussion even starts.
To illustrate the revenue and distributional effects of these types of pledges, we estimate the effect of increasing statutory income tax rates by 10% under different income exemption thresholds using the Urban-Brookings Tax Policy Center microsimulation model. We consider the effect of five salient thresholds: $0; $100,000; $250,000; $400,000; and $1,000,000. In this exercise, the function of the pledge is to exempt taxpayers under the threshold from the tax increase. Specifically, we assume the threshold applies to married couples filing jointly based on adjusted gross income. The threshold for non-married filers is set to be half as large as that of married filers.
We apply the 10% tax increase to all individual income tax rates, including those that apply to capital gains and under the Alternative Minimum Tax (but not other taxes, like payroll taxes or the net investment income tax). In each simulation that we estimate, the change in tax rate for any group over the threshold is exactly the same—a 10% increase in all rates over the threshold. In other words, the only differences in revenues and tax rates across simulations arise from the change in thresholds. (To focus on the main points of this paper, we are assuming there is no change in behavior under alternative tax regimes.)
We assume these tax rate increases affect the 2025 tax year. We choose this base to ensure that the lower individual tax rates provisioned by the Tax Cuts and Jobs Act are still in effect. The TPC microsimulation model predicts that total tax receipts will be $4.8 trillion in 2025 and that the average federal tax rate paid by Americans will be 19.8%.
Note that our policy example, even without a threshold, would increase tax rates more in absolute terms for higher-income taxpayers because it is a proportional increase in tax rates within a system already characterized by steeply progressive tax rates. For example, under this policy the lowest bracket tax rate rises by just one percentage point (from 10 to 11%), whereas the rate facing those in the top bracket increases by 3.7 percentage points (from 37 to 40.7%).
Figure 1 illustrates the change in revenue from this policy example based on different thresholds. If there were no threshold—i.e., there were no pledge to exempt certain groups from income tax increases—and taxes increased by 10% across the board, this policy would raise $221 billion in additional tax revenue in 2025 (illustrated by the orange bar) and would increase the average federal tax rate paid by Americans by 1.1 percentage points (the blue line).
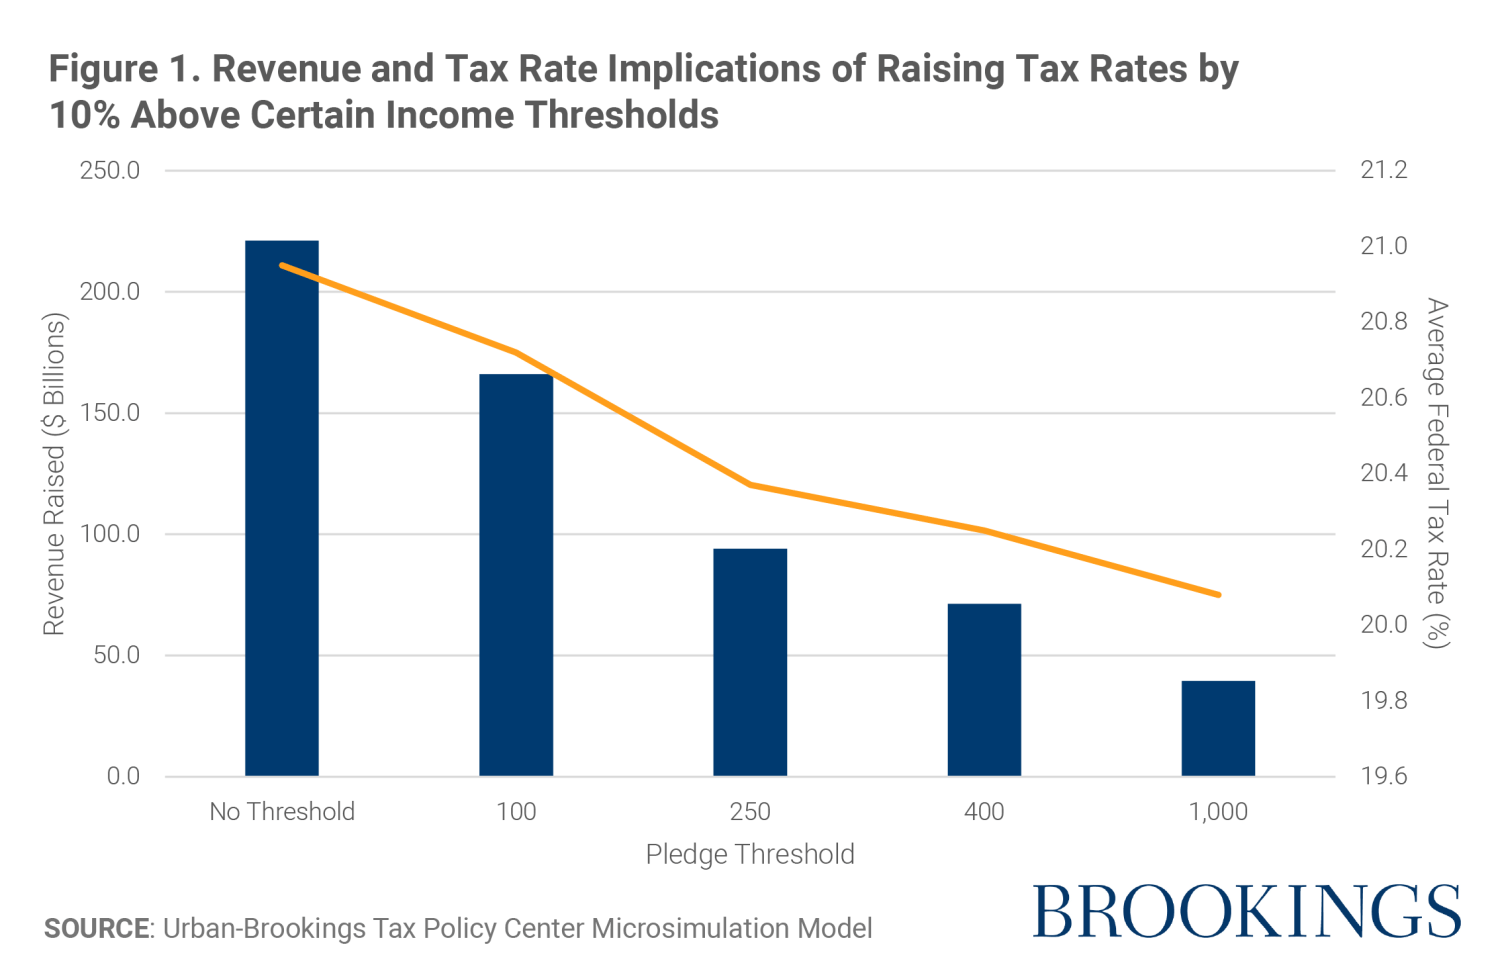
Were the threshold no-tax-increase pledge set to be $100,000, this policy would instead raise $166 billion, a 25% reduction in new revenue relative to the no threshold scenario. At $400,000, this policy would raise $71 billion, and at $1 million, this policy would raise just $39.4 billion, or an 82% reduction in new revenue. In short, exempting large portions of the tax base constrains the ability of this policy to raise revenue.
The steep decline in revenue reflects the fact that each increase in the threshold eliminates a larger share of taxpayers, and therefore income, from the tax base. For example, the $400,000 threshold excludes more than 95% of tax units.
Figure 2 shows how average tax rates change for each group as the threshold for the no-tax-increase pledge increases. With no threshold, the progressivity of 10% tax increase is clear: The average tax rate increases by just 0.3 percentage points for households earning less than $100,000, by 0.9 percentage points for households earning between $100,000 and $200,000, by 1.3 percentage points for households earning between $250,000 and $400,000, by 1.7 percentage points for households with earnings between $400,000 and $1 million, and by 2.4 percentage points for households earning more than $1 million. In other words, the increase in the average tax rate for the wealthiest households is eight times larger than for those earning the least.
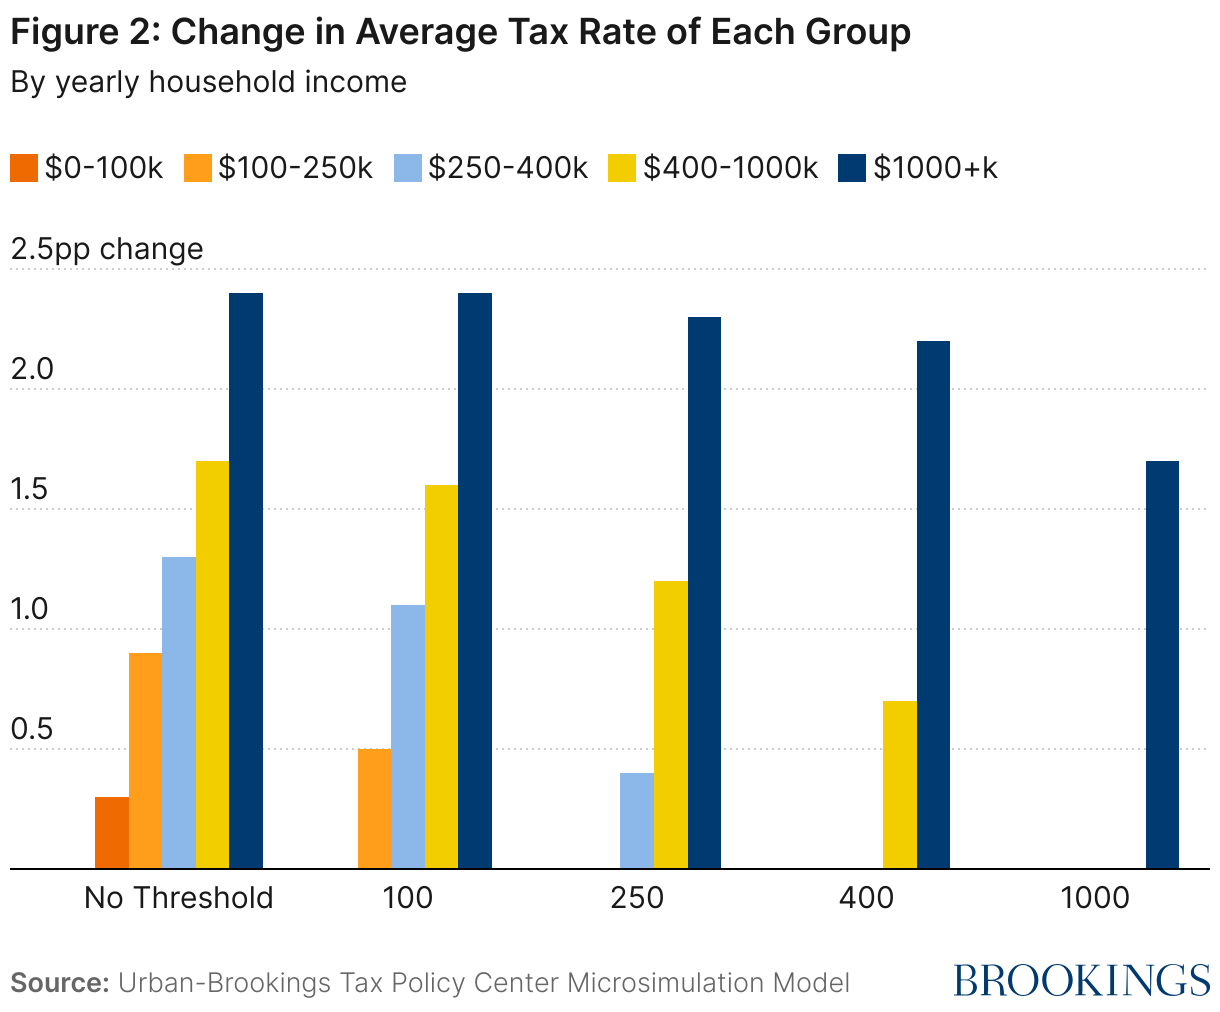
As the threshold for the no-tax-increase pledge rises, the effect on the average tax rate for affected households falls. For example, if the threshold were set to be $100,000, the increase in the average tax rate for households earning between $100,000 and $250,000 would fall from 0.9 to 0.5 percentage points, a 44% reduction compared to a no-threshold policy. Likewise, if the threshold were set to be $400,000, the increase in the average tax rate for households earning between $400,000 and $1 million would fall from 1.7 to 0.7 percentage points, a 59% reduction.
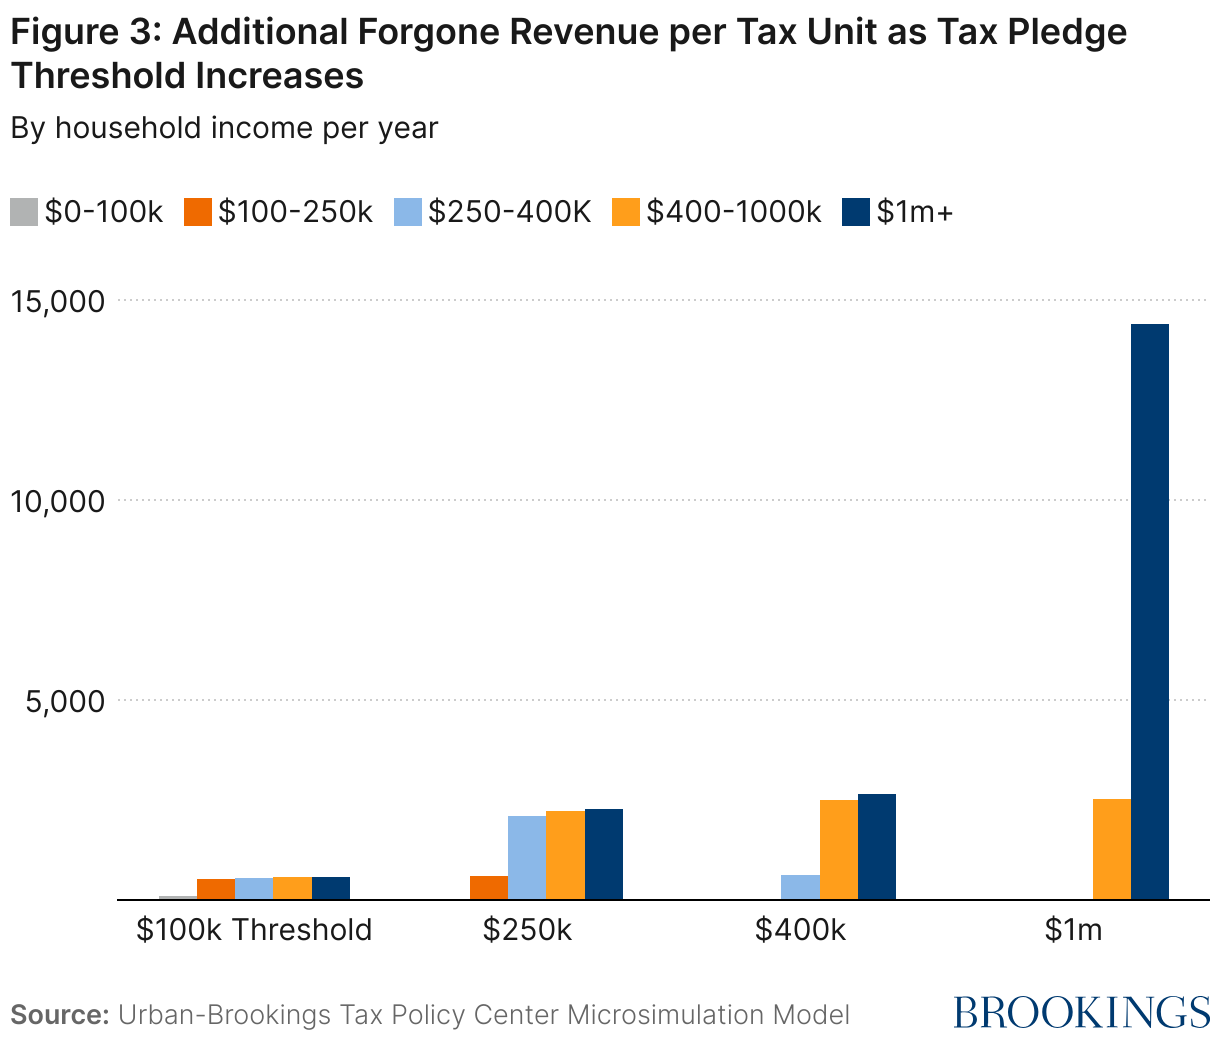
Note, however, that the groups who benefit the most from increasing the threshold aren’t necessarily the taxpayers who appear to be directly affected. Figure 3 illustrates the average revenue loss per taxpayer from successive increases in the pledged tax threshold. Increasing the threshold from $250,000 to $400,000, for example, doesn’t reduce the taxes of anyone earning less than $250,000. Among taxpayers earning between $250,000 and $400,000, the average savings is about $640. But the savings are even larger for wealthier households under this threshold: Taxpayers earning between $400,000 and $1 million save about $2,500, and taxpayers earning over $1 million save almost $2,700.1
Beyond limiting revenue and muting progressivity, these pledges make it harder to develop, reform, and implement tax policy. Without a doubt, the biggest tax policy choice facing the next Congress and Administration will be whether and how to extend the provisions of the Tax Cuts and Jobs Act (TCJA) that expire after December 31, 2025. Many of these provisions reduce various individual income taxes. The Congressional Budget Office estimates that a full extension of the TCJA would cost nearly $5 trillion over the relevant ten-year window. Some have proposed a more nuanced extension of the TCJA that maintains the individual income tax cuts but only for households under $400,000. Strictly adhering to this pledge, however, will introduce design complexities and behavioral distortions that are counter to central tenants of optimal tax policy.
For example, the TCJA not only lowered tax rates for most taxpayers but also changed a wide variety of provisions to simplify taxes and change the tax base, like nearly doubling the standard deduction, eliminating personal exemptions, increasing the child tax credit, limiting certain tax deductions, and reducing the impact of the Alternative Minimum Tax (AMT). Nearly three-quarters of the cost of extending the TCJA comes from extending the individual income tax provisions. Applying a no-tax-increase threshold into the negotiations over these expiring provisions will lock in not only the tax cuts below the threshold but also most of the tax cuts above the threshold because it will be difficult or unwieldy to apply one set of tax parameters (like the standard deduction or AMT relief) to taxpayers under the threshold but not to taxpayers over the threshold.
Likewise, the TCJA introduced a tax cut for individuals who earn pass-through income through the new Section 199A deduction. While the desirability of this tax policy has been questioned by economists, there is no doubt that this deduction provided a large tax cut for households that earn pass-through income, and a full extension of this tax cut would cost $700 billion over ten years. Limiting this tax cut to households earning less than $400,000 would introduce additional complexity to the tax code, especially for those taxpayers earning both wage and pass-through income, who will face trade-offs as their total income crosses the $400,000 threshold.
Beyond limiting revenue and distributional features, threshold pledges can introduce complexity in unexpected ways. For example, the latest estimate of unpaid taxes, or the net tax gap, totaled $625 billion in TY2020 and 2021. Fortunately, the Inflation Reduction Act provisioned $80 billion to the IRS to enhance its operations, and more than half of these funds were allocated to enforcement activities. However, some raised concerns that increased enforcement activity might yield tax revenue from households earning less than $400,000 per year. Consequently, the Biden administration pledged that there would be no change in audit rates among taxpayers earning less than $400,000. Why should tax cheats escape enhanced enforcement based on how much they report in adjusted-gross income (AGI) to the IRS?
These pledges can also make it hard to use the tax system to solve other social problems. President Obama was criticized for the Affordable Care Act (ACA), which expanded health insurance to millions of Americans, in part based on the argument that the ACA’s individual mandate violated his $250,000 pledge. The Social Security Trust Fund, which pays critical retirement benefits to millions of Americans, is funded by the Old-Age, Survivors, and Disability Insurance (OASDI) payroll taxes that apply to the first $168,600 in wages. The Trustees of the Social Security and Medicare trust funds recently estimated that the trust fund reserves will become depleted in 2035, after which there will only be sufficient income to pay roughly 80% of scheduled benefits. Many agree that an expansion of the OASDI payroll taxes may be necessary as part of the solution to shore up this critical U.S. safety net, but expanded payroll taxes would likely be viewed as a violation of a tax pledge. This restricts the ability of policymakers to rely on tax policy to address this looming crisis.
Finally, some progressive policymakers often point out that the U.S. is the only OCED country that does not mandate access to paid maternity leave all Americans, and they advocate for polices to offer paid family and medical leave. For example, the Family and Medical Insurance Leave (FAMILY) Act, recently re-introduced into the 118th Congress by Sen. Gillibrand (D-NY) and Rep. Rosa DeLauro (D-CT), would introduce a federal mandate for such benefits, funded by a payroll tax. This funding design is similar to the state-mandates that are currently in place in 13 states and the District of Columbia. Would implementing the FAMILY Act be a violation of the $400,000 pledge?
Ultimately, the trajectory of the U.S. federal debt cannot be ignored. The Congressional Budget Office projects that the deficit will total $2 trillion for the current fiscal year, and that the Federal debt held by the public will total 122% of GDP in 2034. And these projections were made under the assumption that the provisions of the TCJA will expire, as scheduled, after December 31, 2025. It is clear that new revenue will be needed to address this looming fiscal imbalance. It is also clear that while middle-class tax pledges may be good politics, they impose significant economic and practical disadvantages.
Authors


-
Acknowledgements and disclosures
The Brookings Institution is financed through the support of a diverse array of foundations, corporations, governments, individuals, as well as an endowment. A list of donors can be found in our annual reports published online here. The findings, interpretations, and conclusions in this report are solely those of its author(s) and are not influenced by any donation.
-
Footnotes
- These estimates are based on the change in revenue raised within each income group. This is similar to, but does not correspond precisely to, the measures of tax burden usually presented in TPC’s distributional estimates.


Commentary
The implications of pledging to exempt certain households from tax hikes
Unintended consequences and policy challenges
October 9, 2024