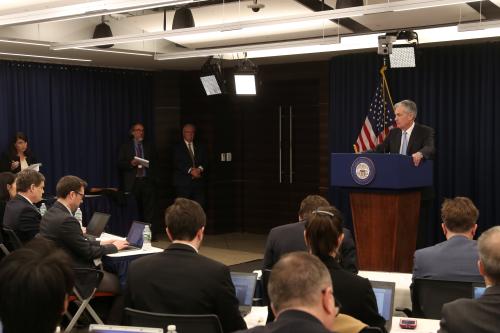
Four times a year, the members of the Federal Open Market Committee (FOMC)—the interest-rate-setting body comprised of Federal Reserve governors in Washington and presidents of the 12 regional Fed banks—share their individual forecasts for economic growth, unemployment, and inflation. Fed watchers scrutinize and often second-guess these forecasts. Indeed, the median forecast is often described as “the Fed forecast.” But there is a separate set of forecasts done by the Federal Reserve Board’s formidable staff. These, generally, aren’t made public for five years.
With all the attention to the FOMC’s quarterly Summary of Economic Projections (SEP), we wondered whether the median FOMC forecast is a good guide to what the Fed staff is thinking. So we looked at the history.
The short answer: The median forecasts of the Fed governors and bank presidents are usually pretty close to the staff’s forecasts, but the staff usually predicts lower inflation and a lower unemployment rate than the FOMC members’ SEP.
Here’s what we did. We took the median forecast for growth, unemployment, and inflation for each public FOMC forecast—the quarterly SEP—from 2007 to 2017. Then we compared the staff forecasts for GDP, unemployment, and Personal Consumption Expenditures (PCE) price index (core and headline) to the median SEP forecast for the year in which the forecast was made and the following one, two, and (where available) three years. The Fed releases the staff forecast with a five-year lag so 2017 is the last year for which we could do the comparison. In all, we had 142 observations. (GDP and Inflation forecasts are Q4/Q4; unemployment is the Q4 average).
This table shows the average absolute difference between the two forecasts. (Year zero is the forecast for the year in which the forecast is made. Year one is the following year and so on.) Not surprisingly, the forecasts are much closer together for the year in which they are made when both policymakers and staff often have hard data on how the economy is doing. The gap between the forecasts for GDP for the year following the FOMC meeting is 0.21 percentage points, and for the year after that it’s 0.20 percentage points. Pretty close.
Average absolute difference between median SEP and staff forecast, percentage points, 2007 to 2017.
| Year | GDP | Unemployment Rate | PCE Inflation | Core PCE Inflation |
| 0 | 0.13 | 0.07 | 0.07 | 0.05 |
| 1 | 0.21 | 0.12 | 0.24 | 0.16 |
| 2 | 0.20 | 0.25 | 0.27 | 0.23 |
| 3 | 0.28 | 0.26 | 0.24 | 0.21 |
An example: At the December 2015 FOMC meeting at which the Fed raised interest rates from zero after holding them there for seven years, the median SEP forecast predicted growth over the four quarters of 2016 to be 2.4%; the staff saw 2.5%. Both the FOMC and the Fed staff expected unemployment to end the year at 4.7%. The FOMC predicted the PCE price index (both headline and core) would rise 1.6% over the four quarters of 2016; the staff predicted 1.2% headline and 1.4% core.
The December 2015 forecasts turned out to be quite accurate. Actual real GDP growth from Q4 2015 to Q4 2016 was 2.2%—just under the FOMC and staff estimates. The unemployment rate at the end of 2016 was 4.7%, exactly as predicted by both forecasts. The FOMC and staff forecasts were both slightly low on headline and core PCE inflation, which rose 1.7% and 1.8%, respectively, from December 2015 to December 2016.
One interesting tidbit—the median SEP projections deviate from those of the staff in predictable ways. The table below shows the percent of observations for which the SEP projection is higher, lower, or the same as the Fed staff’s. Looking at headline inflation, the SEP projection was lower just twice out of 142 observations. The SEP also tended to project a higher unemployment rate—although to a much lesser extent. The projections for GDP growth don’t show a strong directional difference.
Comparing median SEP projection with staff ‘s for all 142 observations
| SEP Higher | SEP Lower | SEP Same as Staff | |
| Headline Inflation | 75% | 1% | 23% |
| Core Inflation | 68% | 5% | 27% |
| Unemployment Rate | 44% | 25% | 31% |
| GDP | 38% | 43% | 19% |
By monetary policy standards, the year 2007 through 2017 are ancient history, so it is possible that the patterns have changed, but we have some evidence that they haven’t. Occasionally, the minutes of an FOMC meeting, released with a lag of a few weeks, reveal some specifics of the Fed staff forecast, which allows us to make comparisons in close to real time. The minutes of the June 2023 meeting, for instance, say that the staff inflation forecast for 2023 was 3.0% for headline and 3.7% for core. The median FOMC member forecast was 3.2% for headline and 3.9% for core, consistent with the historical pattern.
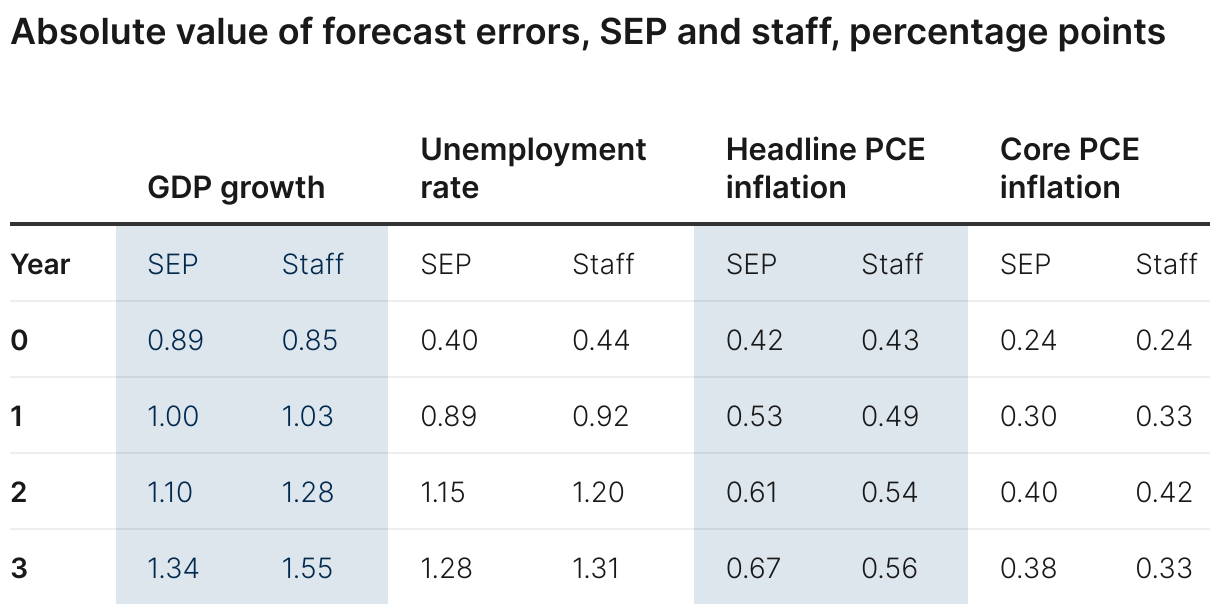
We also compared the accuracy of the forecasts of the FOMC members and Fed staff. Calculating the average absolute value of the difference between the forecasts and the actual outcomes as reported by federal statistical agencies, we find that the two forecasts performed almost identically. And the forecasting errors were highly correlated. In other words, the members of the FOMC and the staff were equally surprised by the economy.
The table shows the absolute differences between the actual values of GDP growth, inflation, and the unemployment rate and the SEP and staff forecasts. Not surprisingly, the forecasts were more accurate for year zero than for other years.
The Federal Reserve posts SEP and staff (Teal Book) forecasts here.
Since September 2015, the Fed has published the median FOMC forecast for each variable. For prior years, medians are available through Haver. The data on which this post is based are here.
Authors


-
Acknowledgements and disclosures
The Brookings Institution is financed through the support of a diverse array of foundations, corporations, governments, individuals, as well as an endowment. A list of donors can be found in our annual reports published online here. The findings, interpretations, and conclusions in this report are solely those of its author(s) and are not influenced by any donation.
The Brookings Institution is committed to quality, independence, and impact.
We are supported by a diverse array of funders. In line with our values and policies, each Brookings publication represents the sole views of its author(s).