In a previous post, I note that an alarmingly high fraction of U.S. families—somewhere between one-third and 43%—do not have resources sufficient to pay for basic needs. The proportions are significantly worse for families of color, exceeding one-half. This observation stems from data that carefully collects basic budget information by county and family structure from thousands of counties in the U.S. The simple fact is that it’s expensive to live in most places in the country, and incomes far too often fall short of local costs of living. The number of families that fall short is shocking.
That post highlighted the current shortfall of family resources relative to the cost of living. But it should be well known that inflation has systematically eroded the purchasing power of all families in recent decades. It turns out that the effects of rising prices have been even more pronounced for poorer families, and especially families of color. Why is that?
When assessing how the real purchasing power of lower-income families has changed over time, a key consideration is what basket of goods and services such families purchase. As Klick and Stockburger (2021) emphasize, the types of goods and services purchased by lower- and higher- income families differ significantly. They break households into income quartiles and find, not surprisingly, that lower-quartile households spend a larger fraction of their incomes on necessities—food at home, rent, medical care, and so on. Conversely, higher-income households spend considerably larger shares of income on food away from home, recreation, and vehicles than their lower-income counterparts.1
And the cost of living in poverty is exacerbated by the fact that low-income families often pay more for necessities. A leading case is the price of food, as documented for example by Kaufman et al. But the conundrum extends to other critical purchases such as insurance and other financial services, as highlighted by Bardaran. These effects are not included in the analysis below, which implies that the conclusions in this brief likely underestimate the high cost of being poor.
So, the basket of goods consumed clearly varies by income. But over time, so do the prices of the goods and services in these baskets. In this brief, I will focus on the prices of necessities (defined below). The prices of these goods and services have risen substantially faster than the prices of other goods and services.
Figure 1 shows the annual price indexes for personal consumption expenditures drawn from the National Income and Product Accounts from 1959 to 2023. The overall index, commonly referred to as the personal consumption expenditures (PCE) index, is indicated in orange. A set of “necessities” goods is indicated in the dark blue line, while all other goods are indicated in the light blue line. 2
Broadly speaking, necessities are defined to include food at home, rent, health care, transportation, child care, and “other necessities.” Categories excluded from necessities include food away from home, recreational goods and vehicles, other durable goods (jewelry and watches, educational books), recreational items, tobacco, magazines and newspapers, travel, air transportation, recreation services (club membership, audio-visual equipment, gambling), hotels and motels, professional services. Necessities account for about 56% of total expenditures in the PCE. The excluded categories account for the balance.
The figure shows that the prices of necessities have risen quite a bit faster than other goods and services—about 36% higher at the end of the sample (necessities increased by 8.9 times over those 60-plus years, versus 6.6 times for non-necessities). The prices of necessities rose about 13% faster than the rise in the conventional PCE price measure, which of course includes both necessities and other goods. Interestingly, during the COVID-19 period (2020 to 2023), while all prices rose unusually rapidly, the price of necessities rose a bit slower than the overall PCE or other goods and services (4.6 percent for necessities versus 4.8 and five percent for the PCE and other goods and services, respectively).3
This suggests that over the past six decades, using the increase in the overall consumer price index to deflate incomes for lower-income families overstates inflation-adjusted income, as it does not accurately reflect the rise in the cost of necessities that these families disproportionately consume. Because families of color are disproportionately lower-income families—more on this in the next section—they are disproportionately exposed to the rising cost of necessities, and thus their incomes on average imply even less purchasing power.
The effect of the rising cost of necessities on purchasing power for low-income families
Of particular interest are the implications of using more appropriate price measures to adjust low incomes for inflation, and particularly low incomes for families of color. Figure 2 shows that 20% of all family incomes in 2022 were at or below $42,000 (we use the shorthand that $42,000 is the “20th percentile” of incomes). But for Black families, 20% of family incomes were $30,000 or below; for Hispanic families, the 20th percentile is $30,100. Both are roughly equal to the poverty threshold for two-adult and two-child families in 2022. And while 40% of all incomes were $74,500 or below, the corresponding levels for both Black and Hispanic families were a bit below $54,000 (these are the “40th percentiles” for incomes for these families). These figures imply that the burden of the rising cost of necessities falls much more heavily on Black and Hispanic families, as there are far more (proportionally) whose incomes likely do not allow them to purchase much beyond necessities—in fact many of them cannot afford to buy all that they need, as my previous posting documents.
Figure 2 shows the history of 20th and 40th family income percentiles by race and ethnicity. Black and Hispanic incomes at the 20th and 40th percentile (the orange and dark blue solid and dashed lines, respectively) have always fallen well below those of the white population (the light blue lines). Indeed, the 40th percentile of Black and Hispanic incomes has only recently risen somewhat above the 20th percentile of white incomes.4
Figure 3 shows the evolution of inflation-adjusted median income for all families, along with the 20th and 40th percentile of inflation-adjusted incomes using the PCE and the “necessities” price indexes, by race and ethnicity. The median income for all families is included for reference.
Figure 3 reveals some important trends.
- As is well known, despite relative gains from 1995 to 2000 and from 2015 to 2022, inflation-adjusted incomes for Blacks and Hispanics remain well below their white counterparts.
- Incomes for the lowest one-fifth of incomes deflated by the necessities price index were stagnant or declining for most families for the quarter-century between 1972 and 1995.
- Black and Hispanic families fared worse than white families during this period, as white families’ inflation-adjusted incomes were essentially flat, while Black and Hispanic family incomes fell.
- Over the past eight years, all incomes have risen faster than historical averages, leading to a small decline in the gap between white and Black or Hispanic family incomes.
- Family incomes generally did not keep pace with inflation during the COVID-19 period (2020 to 2022), regardless of which inflation rate one compares incomes to (all the inflation-adjusted income estimates are falling over the last three years available).
The combination of low income for Black and Hispanic families (figures 2 and 3) and the rising cost of necessities (figure 1) has left these families with incomes that command far less purchasing power than their white counterparts.
Table 1 displays the extent to which the standard deflator overstates the growth in inflation-adjusted family incomes for the periods indicated. From 1972 to 2022 (the period for which white, Black, and Hispanic incomes are available for these percentiles), the standard PCE price index overstates the growth in 20th percentile families’ incomes by 18% to 25%, relative to the gains estimated using the necessities price index. The overstatement for the 40th percentile (shown in the bottom panel of Table 1) is a bit larger, but quite similar. Using an appropriate measure of inflation to deflate incomes matters a lot!
Conclusion
Inflation, especially when it entails rapid increases in the price of essentials, hits poor families particularly hard. That is true for the recent COVID-19 inflation period, but even more strikingly over the past 50 years, when increases in the prices of necessities have outstripped prices of other goods by more than 35%. Those price increases significantly reduce the purchasing power of the already low incomes earned by poorer families, disproportionately families of color, whose spending is more highly concentrated on necessities.
While the Federal Reserve is charged with maintaining low and stable inflation, it does not have the tools to separately influence the prices of necessities versus other goods and services. How to address the erosion of low incomes due to the rising price of necessities? While the SNAP program implicitly adjusts for food inflation as it adjusts the value of the “Thrifty” Food plan that SNAP is based on, TANF (Temporary Assistance for Needy Families) has not done as well. Appropriate indexation of TANF, preferably reflecting rises in the costs of necessities, would help low-income recipients’ benefits go further after adjusting for inflation.5
In this context, it is worth considering the merits of policies currently under debate in this presidential election season. Policies that exacerbate the effect of inflation on poor families—tariffs on imported necessities such as clothing or household appliances, or excessive restrictions on immigration that will create labor scarcities that will feed through into the prices of many necessities—will further stress low-income families. Policies that aim to reduce unnecessary price increases on necessities—such as limits on prescription drug prices—will disproportionately help the low-income families that rely on these goods and services to survive.
Even more important is to (a) recognize how low many family incomes truly are, especially after adjusting for inflation, and (b) put in place policies to build income and wealth over the long haul. I discuss many of these in “The Myth That Made Us.” They include early childhood education for all, reliable pathways from high school to stable employment, improved wages and benefits for low-wage workers, investment in affordable housing stock, and wealth-equalizing policies. All would be excellent investments that would widen economic opportunity and grow our economic pie.
More mundanely, when assessing the real purchasing power of incomes for lower-income families, it is essential to adjust these incomes using price indexes that better reflect the basket of goods that these families consume. This blog has provided a first-cut approach to implementing such improved measures.6 The results, both for current purchasing power and for assessing improvements over time, suggest proper deflation results in significant reductions in inflation-adjusted incomes for low-income minority families.
Appendix
Construction of the price indexes
Price indexes are computed from the expenditure-weighted average inflation rates for the corresponding goods, accumulated from 1959 to 2022 to form index levels. The initial index level is arbitrarily set to 100 in 1959. Denoting expenditure weights for expenditure category i as wi, and gross inflation rates for good i from period t-1 to t as pit, the weighted inflation rates for necessities and other goods are computed as
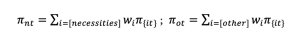
And the corresponding price index for necessities as
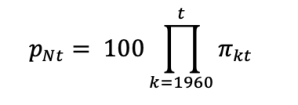
PN and PO are the necessities and other price indexes displayed in Figure 1.
Related Content

Author

-
Footnotes
- Data from the consumer expenditure survey for 2022 depict a very similar picture. The share of total expenditures accounted for by food at home or housing (including rent, utilities, and household operations) declines significantly from the lowest 10% of incomes to the highest. See Census Bureau, Table 1110, “Deciles of income before taxes,” here.
- The Bureau of Labor Statistics computes experimental consumer price indexes for each quintile of income, a very similar concept (here). The indexes begin in 2005, too late to make the kinds of comparisons that I am emphasizing in this note. These price indexes show that prices for the basket of goods and services consumed by the lowest one-fifth of incomes has indeed risen fastest over the past 17 years—about 4.5 percent higher by mid-2023 (latest data available).
- Annualized rates of change. The gross rates of increase are 14.6%, 15.6% and 15.0% for necessities, the overall PCE, and other goods and services. Certainly the cost of some essentials rose rapidly—food at home rose 6.1 percent, housing 5.3 percent, and gasoline 16.6%. But so too did less-essential goods and services—food away from home rose 6.5 percent, airfare rose 9.1 percent, used cars rose 7.9 percent, and hotels rose 8.4 percent.
- As of writing, income quintiles for 2023 were not yet available. The 40th percentile for white families, at $77,000 in 2022, arguably suggests that they consume a more standard consumption basket. For this reason, these incomes are deflated by the PCE price index. Quintile data for income were available only through 2022 at the time of writing. Data for Hispanic families were collected beginning in 1972. White, non-Hispanic households are not tabulated until 1999. Census Bureau, “Historical Income Tables: Families,” Tables F-1, here.
- A complication with the TANF program is that it is largely administered state-by-state, with qualifying levels and benefit structure determined by the state.
- The Bureau of Labor Statistics produces two experimental price indexes that reflect differences in the baskets of goods consumed by income quintiles. The indexes are available beginning in 2005, and do not differentiate by race or ethnicity (data and documentation are here and here). They show trends that are broadly similar to those in this brief, although the increase since 2005 is a bit larger for the experimental index than for the necessities-only index—between three and 6.5 percent faster from 2005 to 2022. An alternative approach that uses the experimental CPI’s fixed-weight shares for 2022 to weight components of the PCE also produces similar results. In all cases, the cost of goods consumed by the lower income ranges is significantly higher than those consumed by those in higher income ranges.
The Brookings Institution is committed to quality, independence, and impact.
We are supported by a diverse array of funders. In line with our values and policies, each Brookings publication represents the sole views of its author(s).