Southern California’s housing shortage and resulting affordability crunch have been decades in the making and impose widespread harms on the region’s residents. Over two-thirds of renter households in Los Angeles County spend at least 30% of their income on rent, and 40% of renters live in overcrowded or poor-quality homes. Over 71,000 Angelenos were experiencing homelessness in 2023. Sharp rises in housing prices and mortgage interest rates make first-time homeownership increasingly difficult. Even long-term homeowners who have seen their net worth rise along with their home values can find themselves in a bind: if they want to downsize in retirement, there are few moderately priced, accessible homes available in their communities.
To help ease the crunch, California state lawmakers have passed more than 100 new laws that affect planning, zoning, permitting processes, and building since 2017. These laws approach the problem from two angles. First, the decades-old Regional Housing Needs Allocation (RHNA) assigns each local government quantitative targets for how many homes the jurisdiction needs to add over the next eight years; recent updates have added teeth to RHNA enforcement. Second, a series of newer state laws aims to legalize specific structure types, such as accessory dwelling units (ADUs) and duplexes, which typically offer lower rents or prices than single-family detached homes. Together, these policies are intended to create more homes, and more diversity of housing options, at a wider range of rents and prices.
In previous research, we have explored how several local governments in Los Angeles County are trying to integrate ADUs into their broader toolkit of affordable housing policies. ADUs offer several advantages over traditional subsidized housing, such as lower per-unit construction costs and a lower profile in low-density residential neighborhoods. These advantages are somewhat offset by a reliance on individual homeowners’ willingness and ability to become developers and landlords—and to comply with the rules accompanying housing subsidies. To date, affordable ADU programs have yielded very few income-restricted homes, especially relative to the scale of need.
In this report, we stepped back to take a broader look at changes in overall housing affordability and production in select jurisdictions in Southern California from 2010 to 2022, examining the overall growth in the number of homes and emerging changes in the types of homes being built. This time frame tracks housing affordability starting in the trough of the Great Recession (2010) and includes the pre-pandemic peak (2019) and the most recent year for which data are available (2022). We examined the relative roles of single-family homes (traditionally the most expensive housing type), large apartment buildings, and in-between structures referred to as middle housing.
Our analysis found that housing prices and rents in Southern California rose faster than household incomes from 2010 to 2022. While the entire region is expensive, relative to the U.S. overall, housing costs varied widely across cities within the region. Single-family detached homes accounted for a substantial share of housing stock in 2019, while newly permitted housing from 2019 to 2022 was more weighted toward multifamily and middle-housing structures. Several cities have been permitting substantial numbers of ADUs, reflecting recent statewide policy changes. Housing production rates also varied widely across cities.
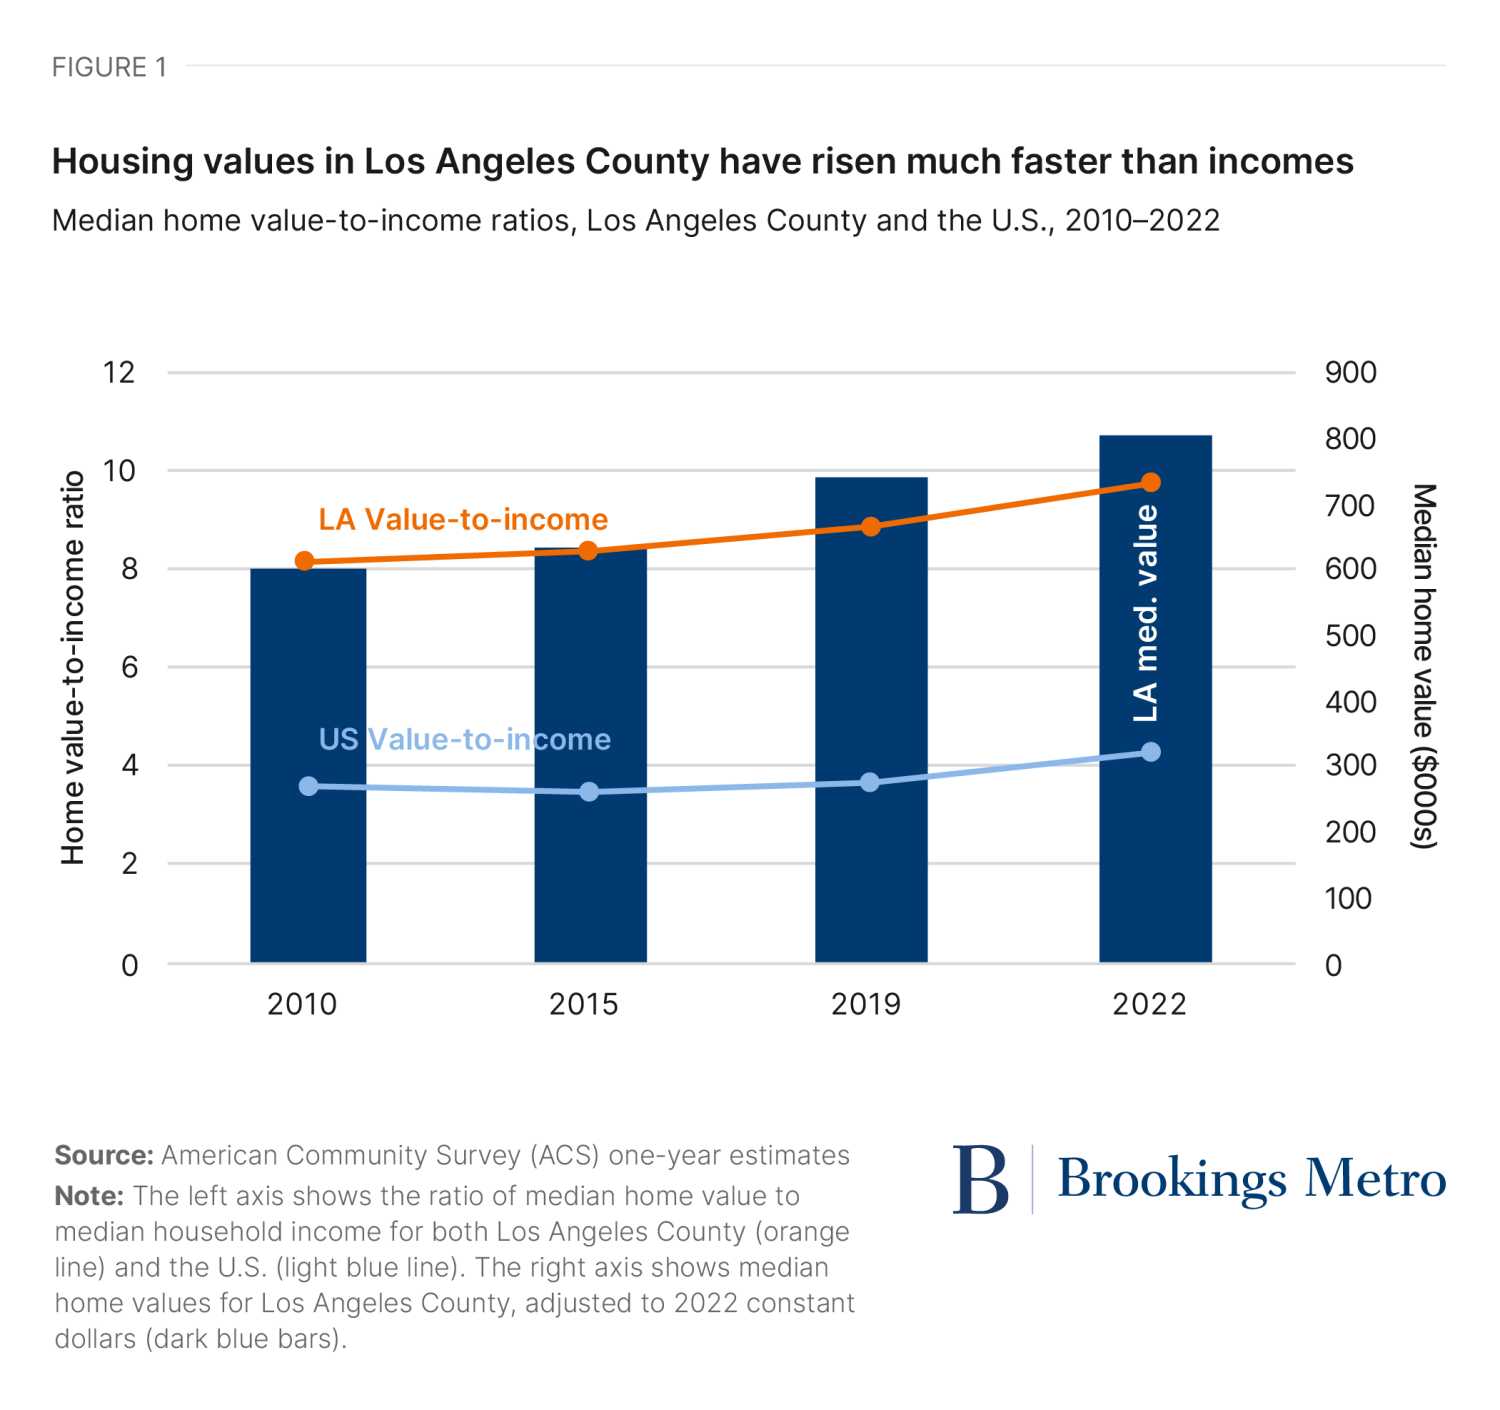
Housing in Los Angeles is expensive and is becoming even less affordable over time
Housing affordability in Los Angeles County has gone from bad to worse over the past 13 years. The ratio of median home values to median household income rose from 8.2 in 2010 to just under 10 in 2022—more than double the ratio for the U.S. overall during this period (see Figure 1). Historically, housing value-to-income ratios between 2.5 and 4.0 have been considered healthy, implying that the typical household can afford monthly payments for a median-priced home. (What home price is “affordable” to an individual household also depends on mortgage terms such as interest rates and the size of the downpayment, as well as household-specific factors, such as other monthly expenses.) The rapid rise in home value-to-income ratios in Los Angeles County reflected a steep increase in home prices from roughly $600,000 in 2010 to just over $800,000 in 2022. (Note: All dollar values in this report are adjusted for inflation to 2022 constant values.)
Rental housing also has been substantially more expensive in Los Angeles County than in the U.S. overall, with the gap growing over time. In 2010, a household earning roughly $64,000 per year could have afforded the median rental home in Los Angeles County while spending 30% of its income on rent (see Figure 2). By 2022, the income threshold needed to afford median rent had risen to about $72,000. In both years, the minimum income needed to afford rent was roughly 87% of the county’s median household income. By contrast, the income needed to afford the median rent for the U.S. overall was about $52,000 in 2022, equivalent to 70% of the U.S. median household income.
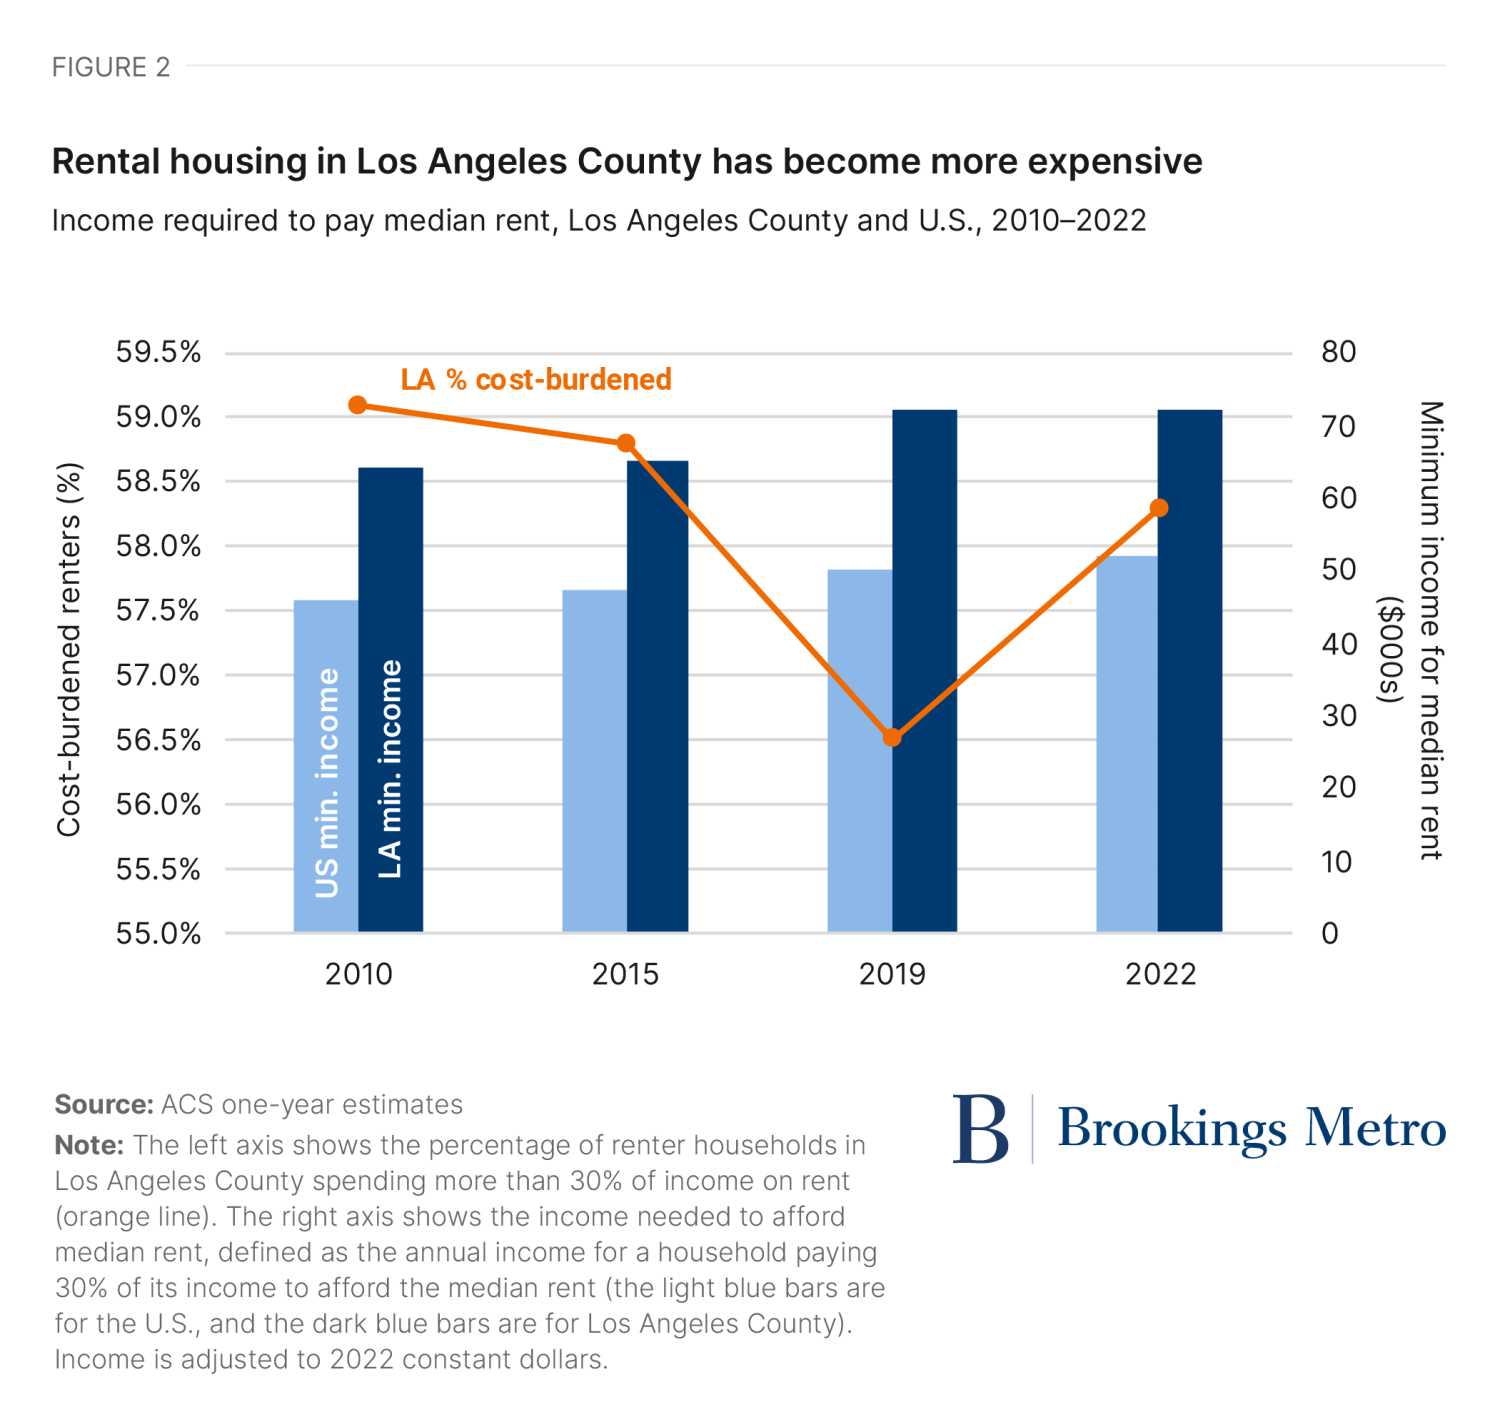
The percentage of cost-burdened renters in Los Angeles—defined as those paying over 30% of their income on rent—ranged between 57% and 59% over this time period. Although share of cost-burdened households is a widely used metric of housing affordability, it can be misleading because it only captures people who currently live in the jurisdiction. For example, some low-income households may have moved out of Los Angeles County into cheaper nearby counties, such as Riverside and San Bernadino.
Not all Southern Californian cities are equally expensive
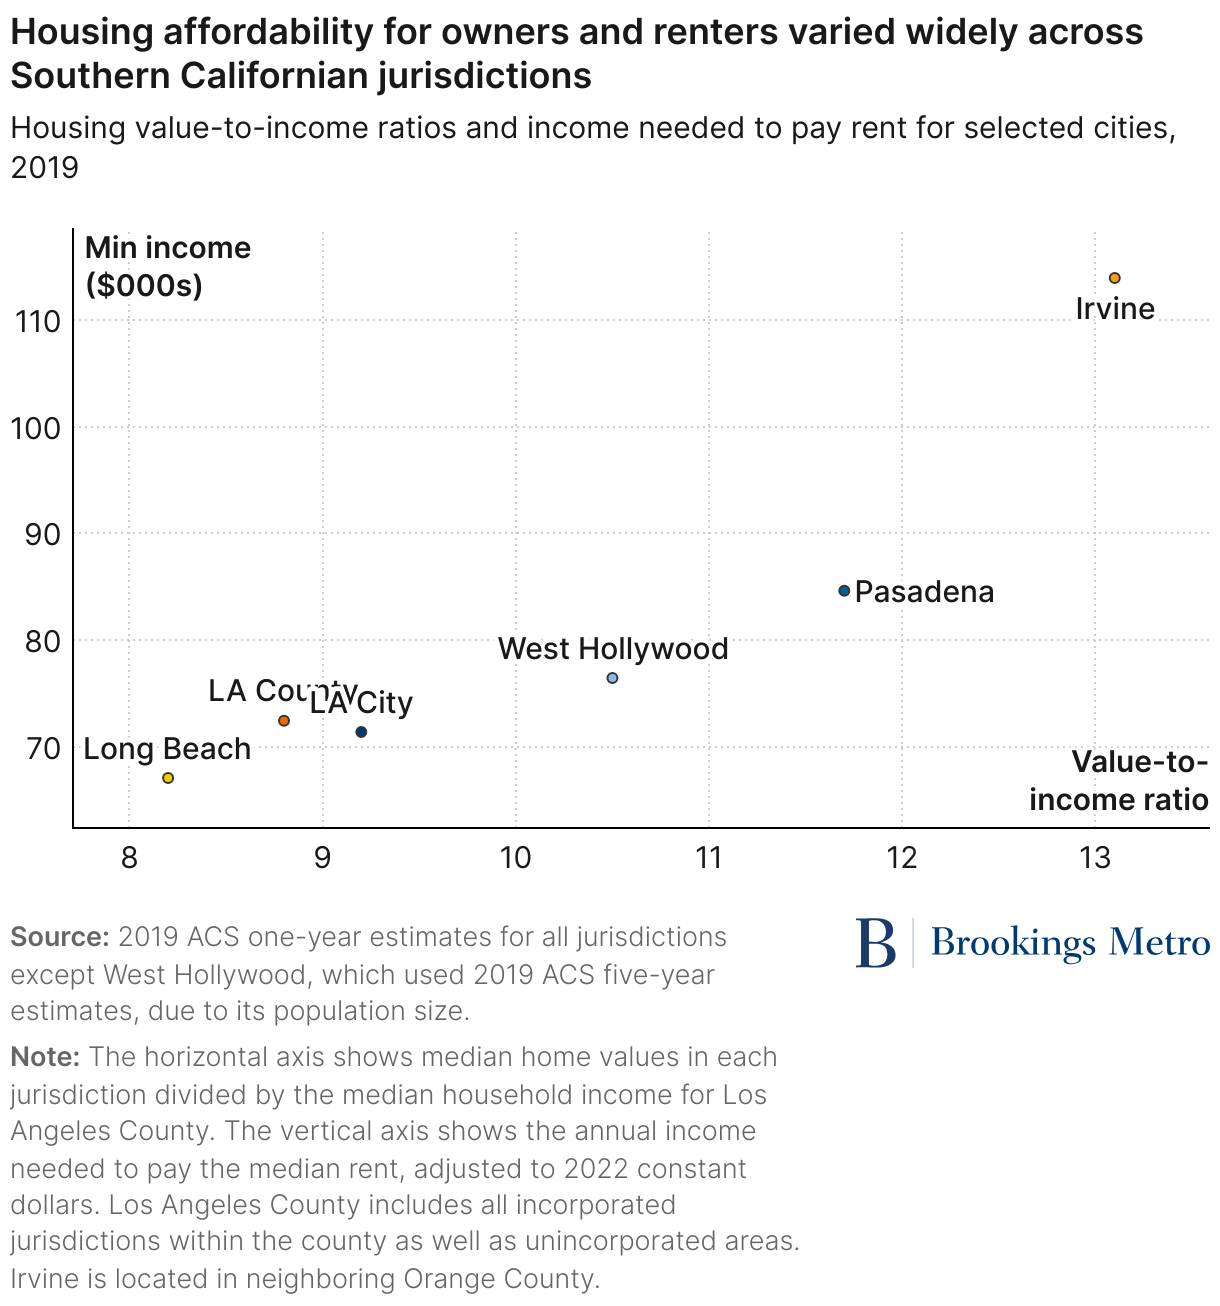
All of Southern California is expensive relative to the U.S. overall, but there was substantial variation in housing affordability for owners and renters across the region’s jurisdictions. To explore this variation, we highlighted value-to-income ratios (for current and prospective owners) and the income needed to afford rent for three cities we have discussed in previous reports—Los Angeles, Pasadena, and West Hollywood—as well as for Los Angeles County overall. For wider regional context, we included two additional cities: Long Beach and Irvine. Long Beach is the second-largest city in Los Angeles County and has traditionally offered less expensive housing options. Irvine is located in adjacent Orange County and is notable for its relatively expansive housing supply. To create a regional affordability measure, value-to-income ratios were calculated using the median home value in each jurisdiction divided by the median household income for Los Angeles County (a way of avoiding the selection problem that affluent households tend to sort into expensive jurisdictions).
Median home value-to-income ratios ranged from 8.2 in Long Beach to 13.1 in Irvine; all of these figures were well above the national average, but they exhibited quite a wide range (see Figure 3). The City of Los Angeles was closer to the bottom of this range, although the citywide average obscured considerable diversity across its neighborhoods. Rental housing affordability also varied widely: a household would need $67,000 in annual income to afford the median rental in Long Beach, compared with an annual income of $114,000 in Irvine. (Notably, Irvine has the smallest share of cost-burdened renters because most of its residents are quite affluent.) Affordability metrics for rental housing and owner-occupied housing are strongly, positively correlated across these jurisdictions.
Single-family homes have been much more common than middle housing in most Southern Californian cities
Many of California’s recent zoning reforms are intended to expand the diversity of housing options available in residential areas, focusing especially on middle housing—generally defined as structures in between single-family detached homes and large, high-rise apartment buildings. These reforms could increase rental housing availability; most single-family detached homes are built for owner-occupants, while other structures are more likely to be rented. Because single-family detached homes use more land per home, they are also more expensive to buy or rent.
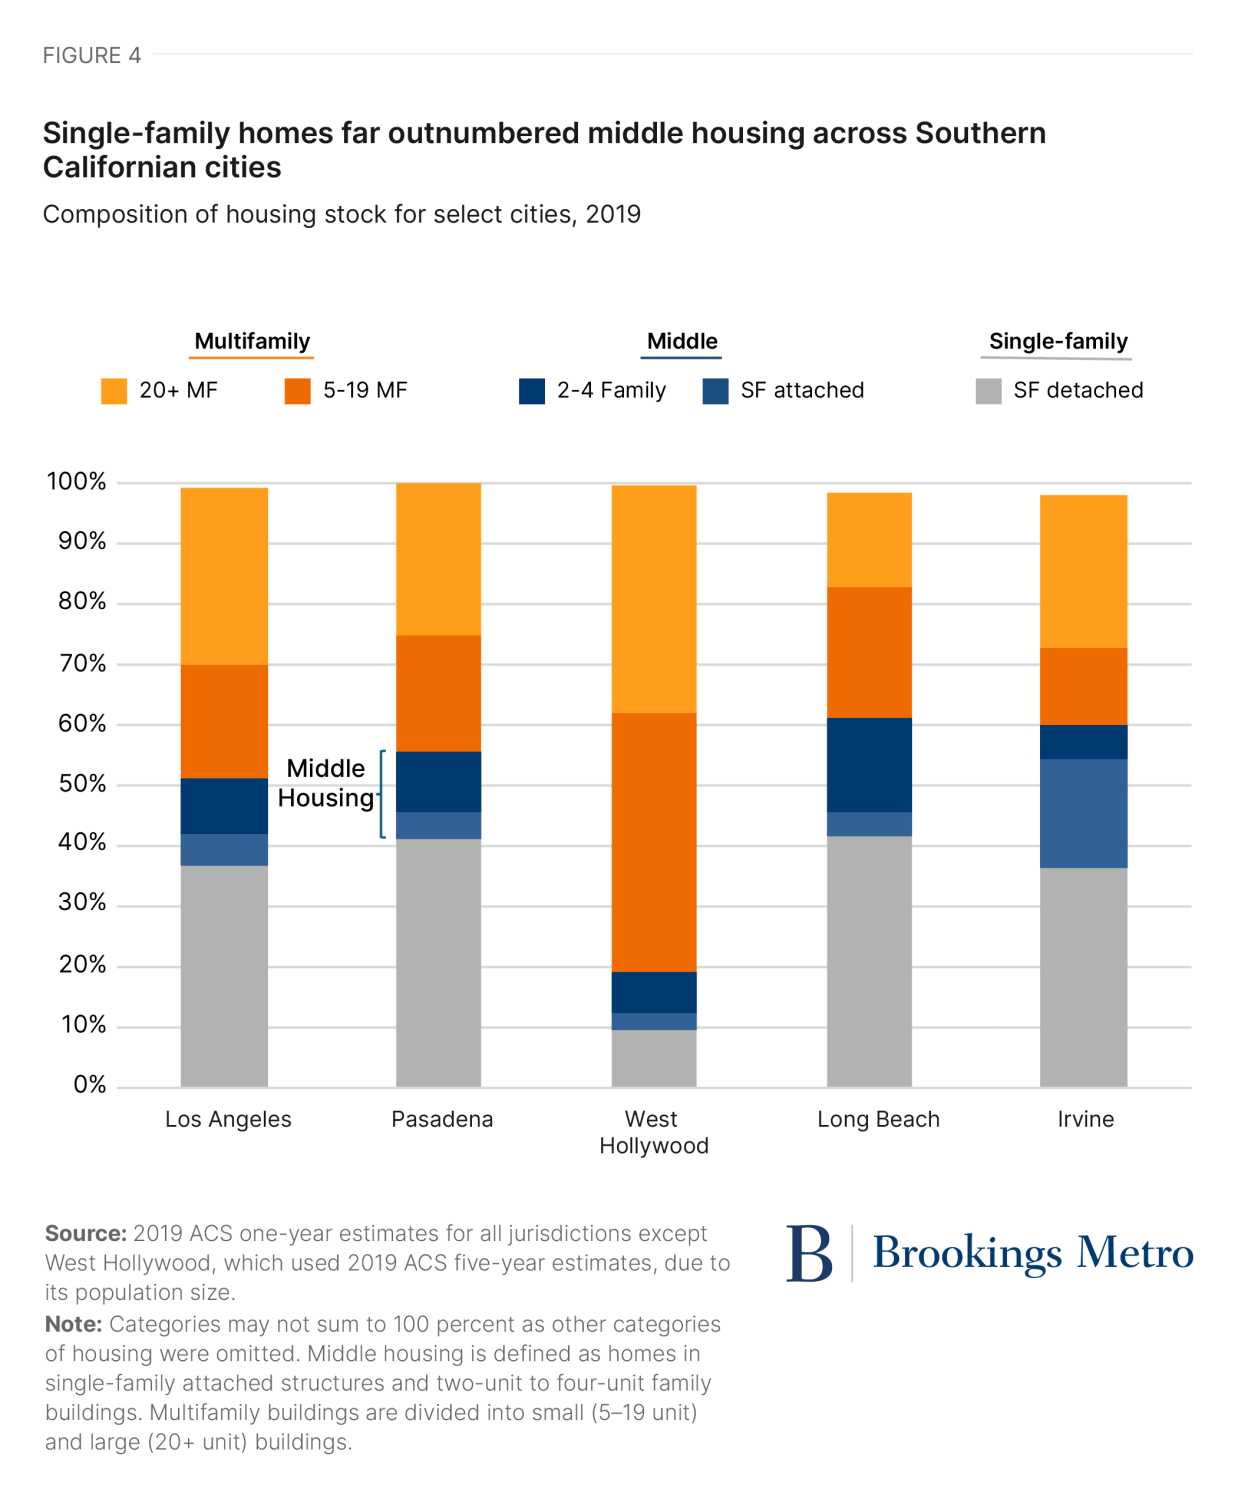
Single-family detached homes were the most common structure type in four of the five cities, as of 2019 (see Figure 4); they accounted for roughly 40% of homes in Irvine, Long Beach, Los Angeles, and Pasadena. Only 10% of homes in West Hollywood were single-family detached structures; the city has a very small land area and is densely built. Middle housing, measured here as single-family attached homes (townhomes) and two-unit to four-unit family buildings, accounted for a much smaller share of housing—ranging from about 10% in West Hollywood to about 24% in Irvine. Homes in mid-sized apartment buildings (with 5–19 units) outnumbered those in large (20+ unit) buildings in two cities, Long Beach and West Hollywood. Mid-sized buildings were more commonly built in the early- and mid-twentieth centuries, while large apartment buildings dominate current multifamily construction.
ADUs are another structure that is typically considered part of middle housing, and they are particularly important in California’s recent zoning reforms. Unfortunately, frequently used public data sources on housing—including the U.S. Census Bureau’s American Community Survey (ACS) and American Housing Survey—do not consistently identify ADUs. There is considerable ambiguity about how homeowners whose properties include ADUs respond to census surveys. For instance, a homeowner with an ADU could report living in a single-family detached home, thereby excluding the ADU from total housing counts, or a property owner could report living in a two-family home (which would involve an accurate total housing count but inconsistent reporting by structure type). Resolving this uncertainty with housing data sources would be helpful for policymakers and researchers—in California and other states that have legalized ADUs—in monitoring the outcomes of recent zoning changes.
Housing stock in Southern California has been growing unevenly across cities and has been becoming more diverse
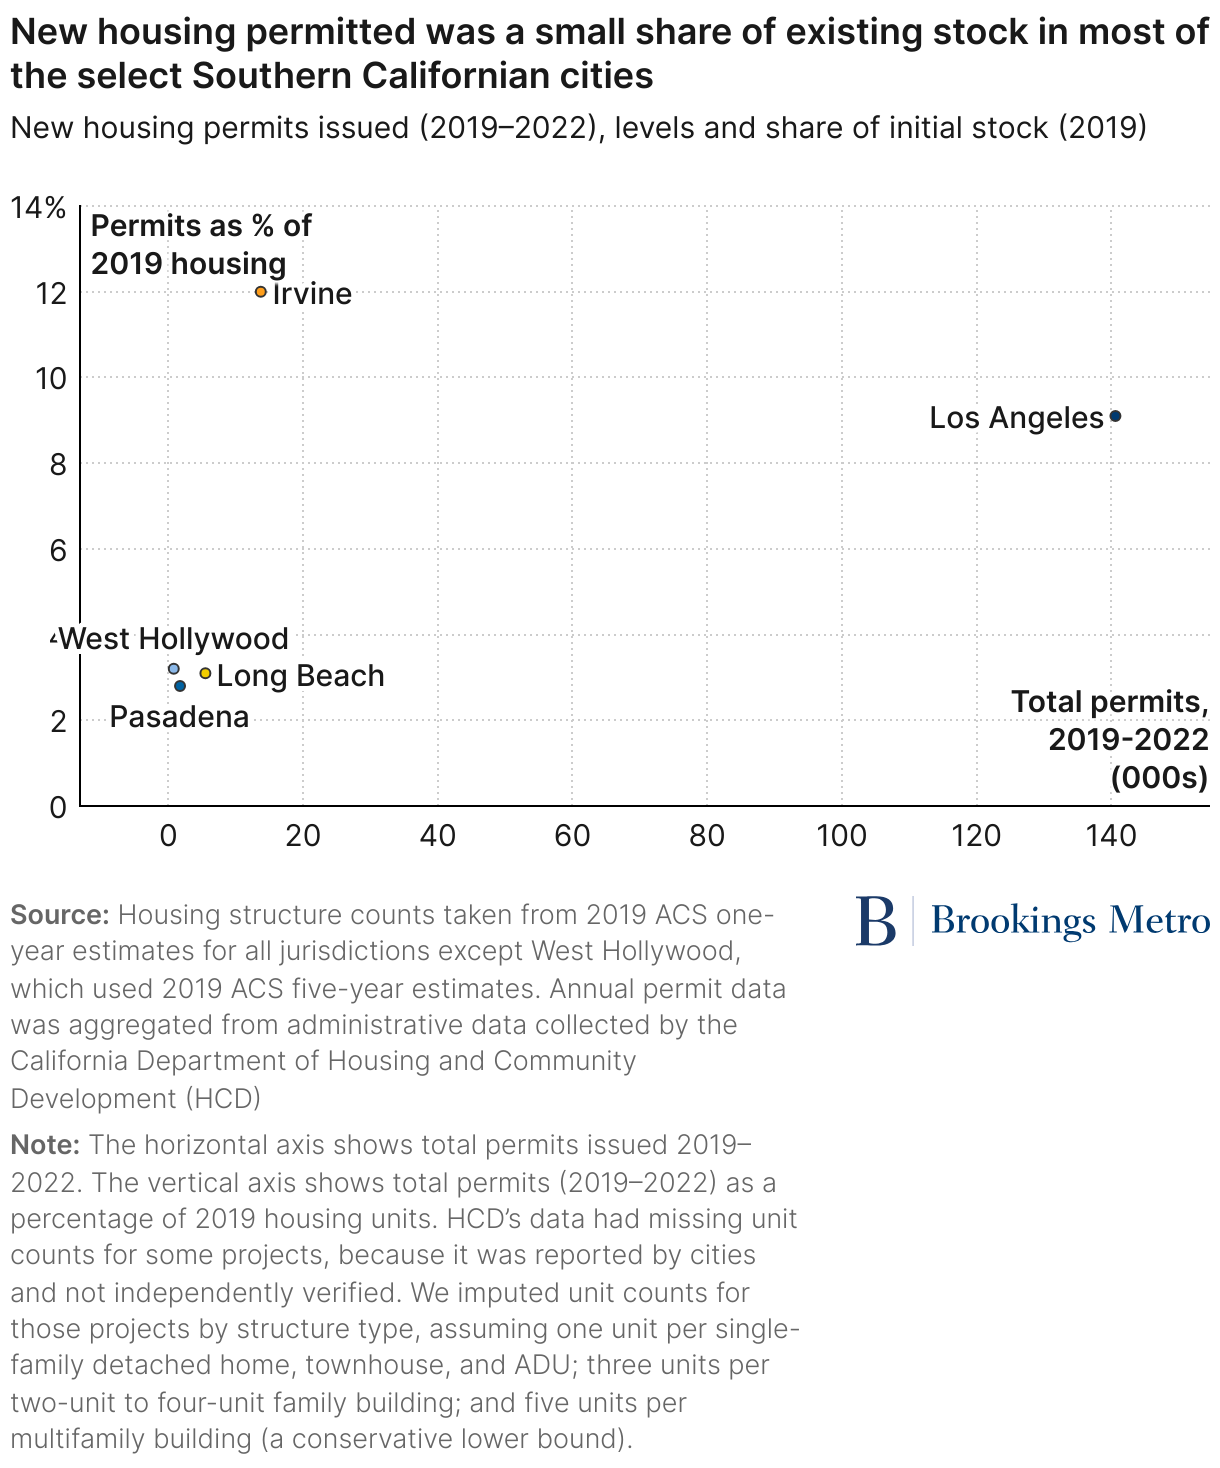
The rate of housing growth also varied considerably across Southern California’s cities. Nationally, new construction averages about 1% of existing stock in a typical year, implying slightly more than 4% growth over four years. Two of the five cities exceeded that growth rate between 2019 and 2022. Los Angeles—by far the largest city in the region—permitted the largest number of new homes, around 140,000, or roughly 9% of its initial stock (see Figure 5). Irvine permitted nearly 14,000 new homes, or roughly 12% of its initial housing stock. Long Beach, Pasadena, and West Hollywood each added homes equivalent to roughly 3% of their respective initial stocks.
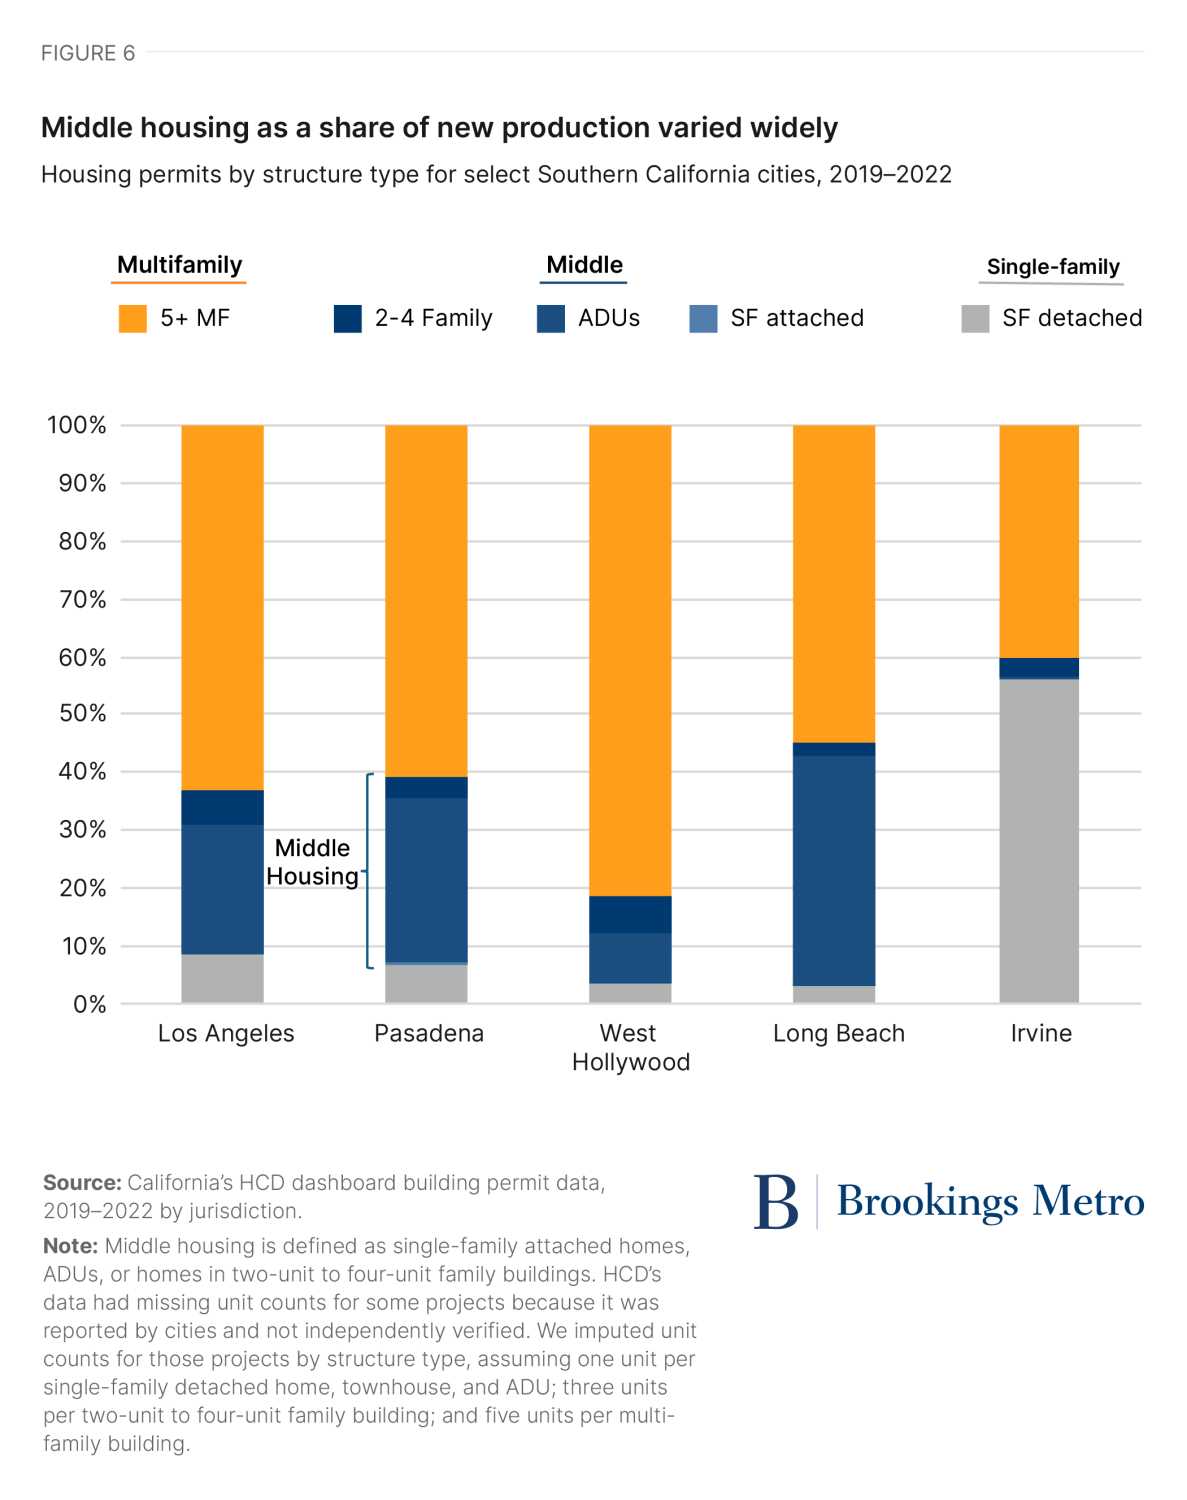
The share of middle housing produced by our sample cities varied widely across the 2019–2022 period. Middle housing accounted for just over 40% of total permits in Long Beach, but only 4% of total permits in Irvine (see Figure 6). Irvine built the largest share of single-family detached homes (about 56%), while West Hollywood built the largest share of larger multifamily buildings (about 80% of total permits). ADUs constituted the largest share of middle housing everywhere except Irvine, and a substantial share of total permits in three cities: almost 40% of Long Beach’s new homes were ADUs, as were more than 20% of total permits in Los Angeles and Pasadena. Homes in two-unit to four-unit buildings ranged from 2–6% of new permits in the sample cities, while none of the cities permitted meaningful numbers of townhouses.
To improve regional affordability, cities need to build a lot more homes and build a diverse range of housing types
This analysis provided only a short-term snapshot of housing production in a handful of Southern Californian cities, but it did highlight some interesting and unexpected patterns. The most expensive city in our sample (Irvine) permitted the greatest amount of new housing as a share of initial stock, and it started the period with a fairly large share of middle housing (largely single-family attached homes). However, over half of its new permits were for single-family detached homes—the most expensive housing type and the most likely kind to be owner-occupied. Middle housing constituted a nontrivial share of new homes in Long Beach, Los Angeles, and Pasadena, primarily through ADUs. Los Angeles also added nearly 90,000 apartments in multifamily buildings (nearly 63% of the 140,000 total permits)—a welcome development for renter households. Among our small sample, the share of new middle housing was at best weakly correlated with overall housing production. This raised the question: if cities have been using the new state laws to gradually diversify their housing options but haven’t substantially increased the overall quantity of housing, is that a “win” for residents? Moreover, not all ADUs are rented out as full-time housing; some homeowners build ADUs to use as additional personal space, such as home offices, or as short-term rentals (through platforms like Airbnb).
At current rates of growth, it could take decades before Southern Californian households see meaningful improvements in housing affordability or availability. However, many of the state’s housing policy changes are still quite new; more time is needed to evaluate their effectiveness.
Authors


-
Acknowledgements and disclosures
Funding for this research was received from the Hilton Foundation. The views expressed in this report are those of its authors and do not represent the views of the donors, their officers, or employees.
The Brookings Institution is committed to quality, independence, and impact.
We are supported by a diverse array of funders. In line with our values and policies, each Brookings publication represents the sole views of its author(s).