
The commercial real estate (CRE) sector experienced significant demand disruptions during the COVID-19 pandemic. Understanding the trends impacting this sector is of broad general interest, as headlines and Congressional hearings have warned us. Commercial real estate distress can destabilize local government fiscal models, the banking sector, or even the entire economy. Across product types, CRE has struggled to keep pace with demand trends that are evolving faster than buildings can be built or renovated.
However, it’s not all fragility and bad news—demand remains stronger than ever for vibrant communities that create opportunity, bring amenities into proximity, and build wealth. We argue that it’s not a simple question of whether America has too much or too little offices, retail, or rental apartments. Rather, there is a three-way mismatch between available space, locations with demand, and entrepreneurs with resources, including site control, community support, and access to capital. Government, finance, and the real estate industry all have a role to play in fixing this alignment. Retail in particular is a surprising bright spot, with big opportunities for delivering positive economic and social returns.
1. Surprise! Retail was the most stable CRE category through the pandemic.
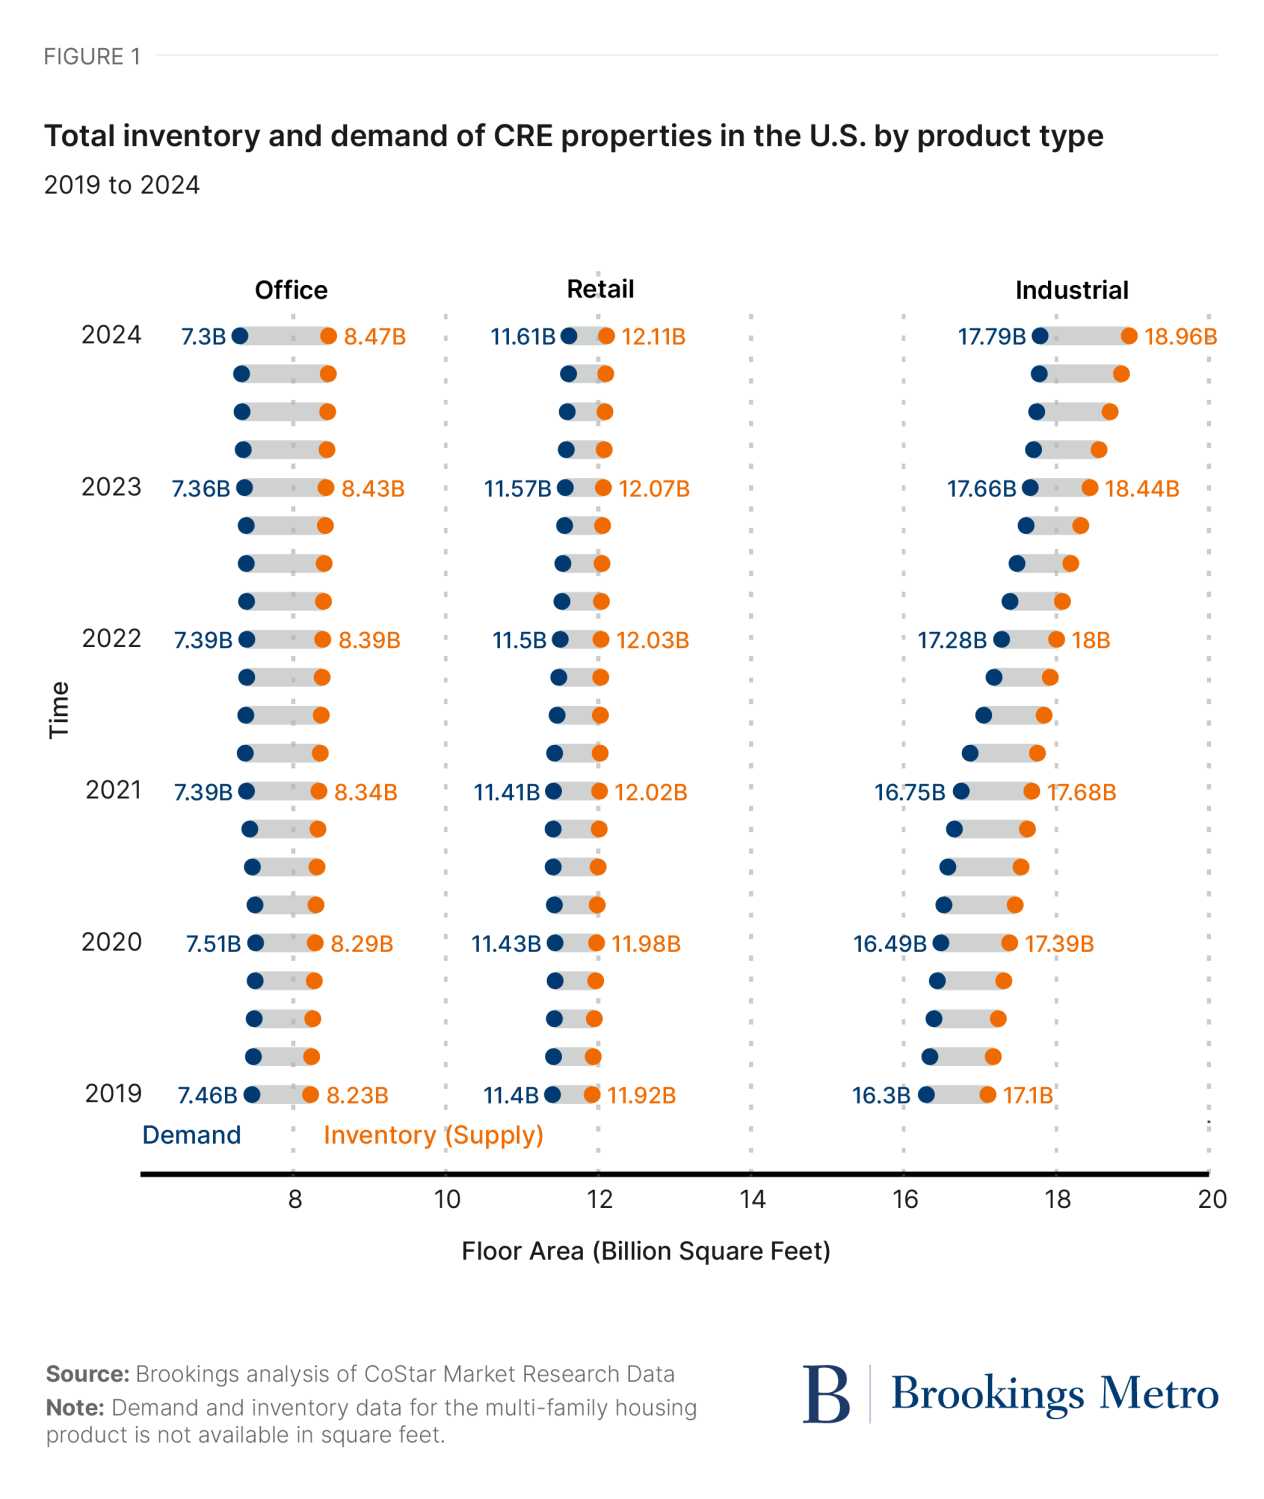
Figure 1 illustrates the inventory and demand for commercial real estate by product type from 2019 to 2024. The length of each “dumbbell” represents the gap between supply and demand in the form of vacant space. Each product subsector of CRE demonstrated distinctive market dynamics throughout the pandemic. Despite the highly visible trauma the retail sector went through in 2020, demand for retail space has actually grown from its pre-pandemic level. In contrast, the gap between supply and demand for office space continues to grow, with demand shrinking by 160 million SF since Q1 2019. And while demand for industrial space grew the most, an explosion in supply has produced higher aggregate vacancy for that product, leaving the retail market the tightest CRE category.
2. While headlines have focused on office valuation declines, multifamily losses are comparable in scale.
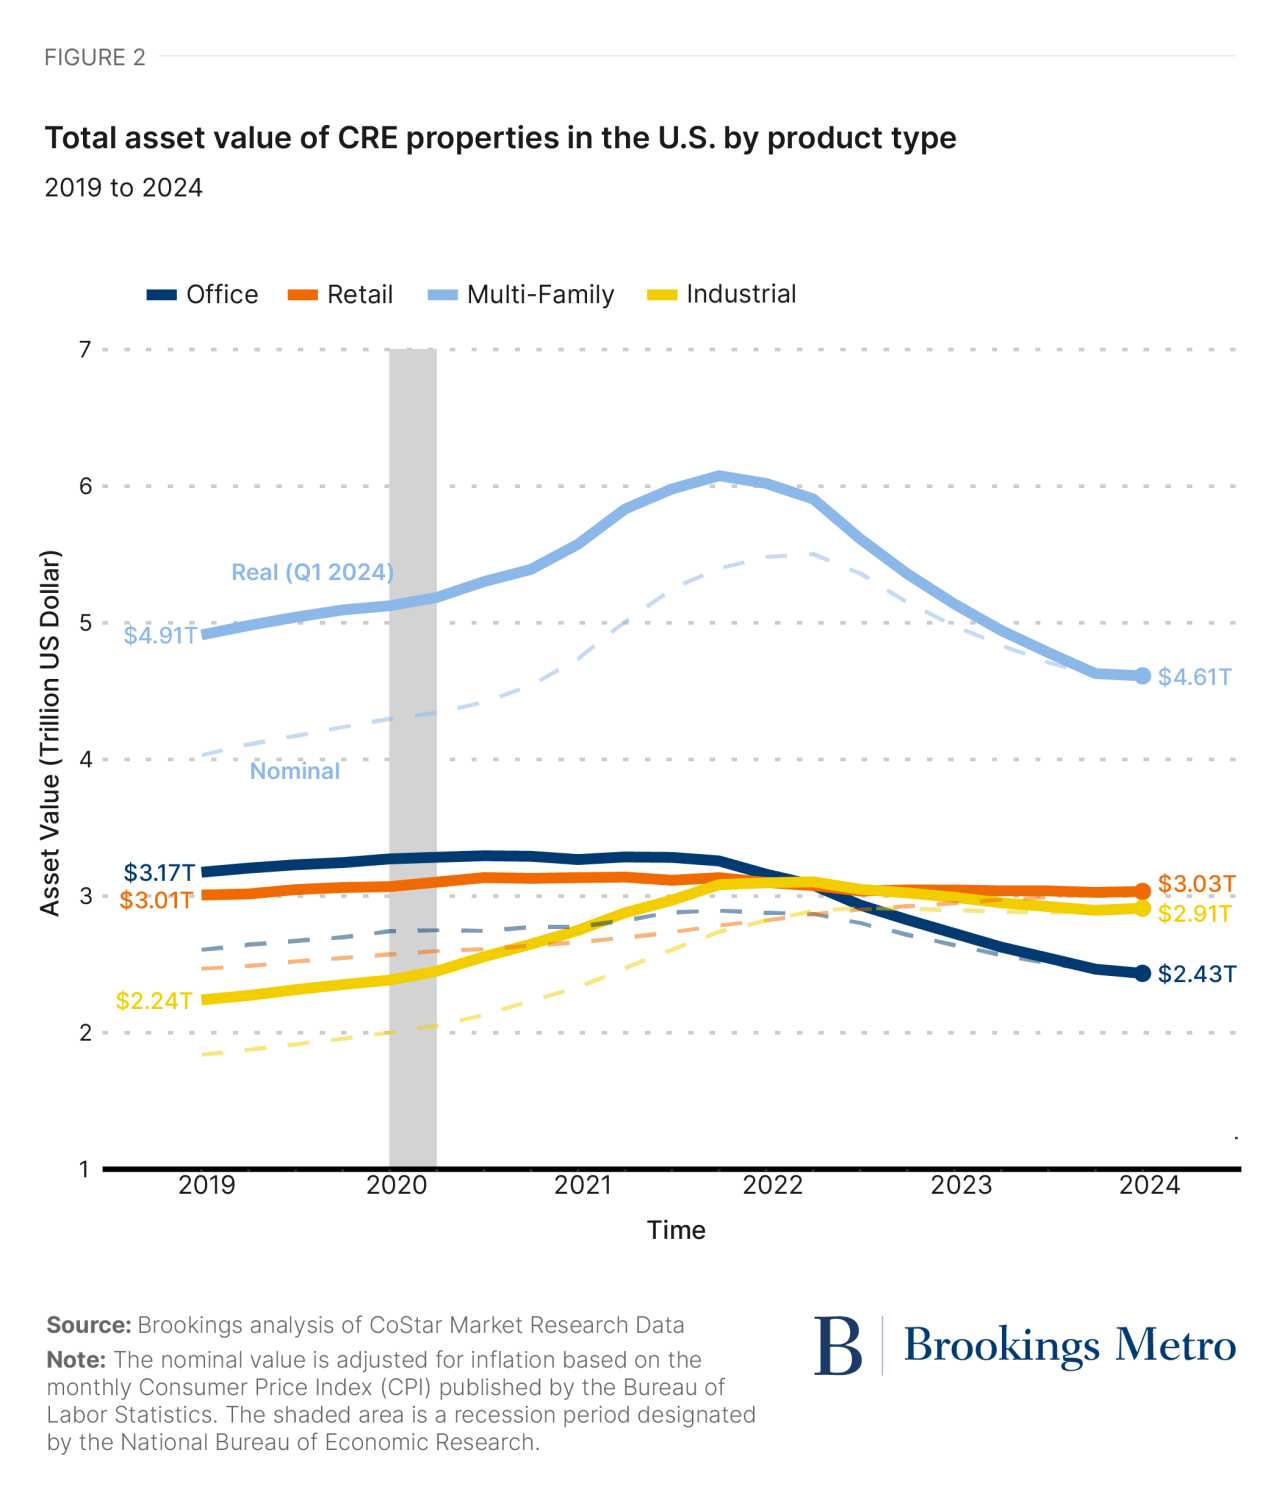
Figure 2 shows CoStar’s modeled1 quarterly real and nominal monetary values of four types of commercial real estate assets in the U.S. from 2019 to 2024. Overall, the pandemic marks a critical watershed for asset value trends in CRE. Historically, CRE values grew as a group, with multi-family and office leading in valuation. Since 2019, while retail and industrial values have continued to grow, office has lost 23.3% ($740 billion) of its aggregate value and multifamily is down 6.1%. However, because of the far greater size of the multifamily asset class, this still represents $300 billion in losses. Figure 2 shows again the stability of retail, now the second most valuable commercial real estate asset in the U.S.
3. Retail rental properties generate stable and competitive returns amid macroeconomic headwinds.
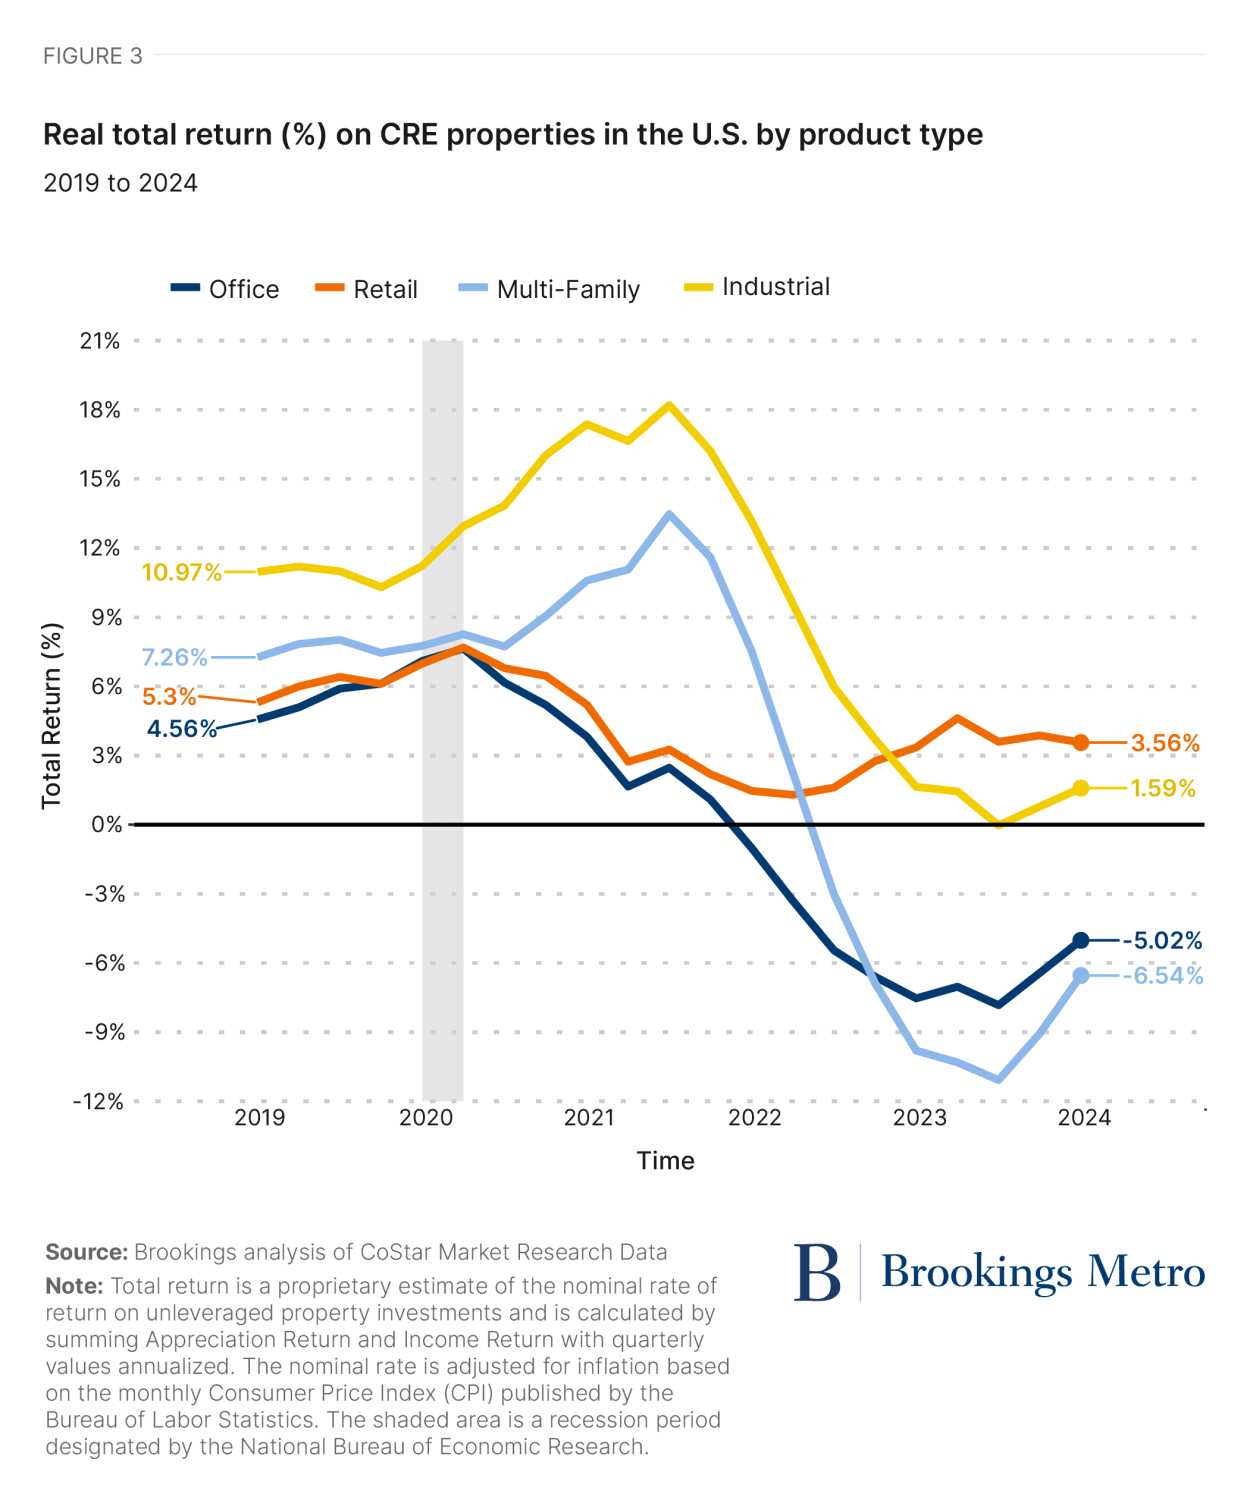
Figure 3 depicts quarterly real returns for commercial real estate by product type over the past five years. Overall, retail demonstrated remarkable resilience to the major disruptions of COVID-19. While at first glance this figure is a startling illustration of the volatility of industrial and multifamily returns in recent history, at second glance retail emerges as a workhorse for investors. In 2020, we observed that a real estate reset was overdue—and in 2024, for retail, it’s already here. Many retail spaces like suburban malls have either shuttered or adapted, and as we saw in Figure 1 very little new inventory has been added. This foreshadows the adaptation yet to come for offices.
4. The national vacancy rate for retail is at a five-year low point.
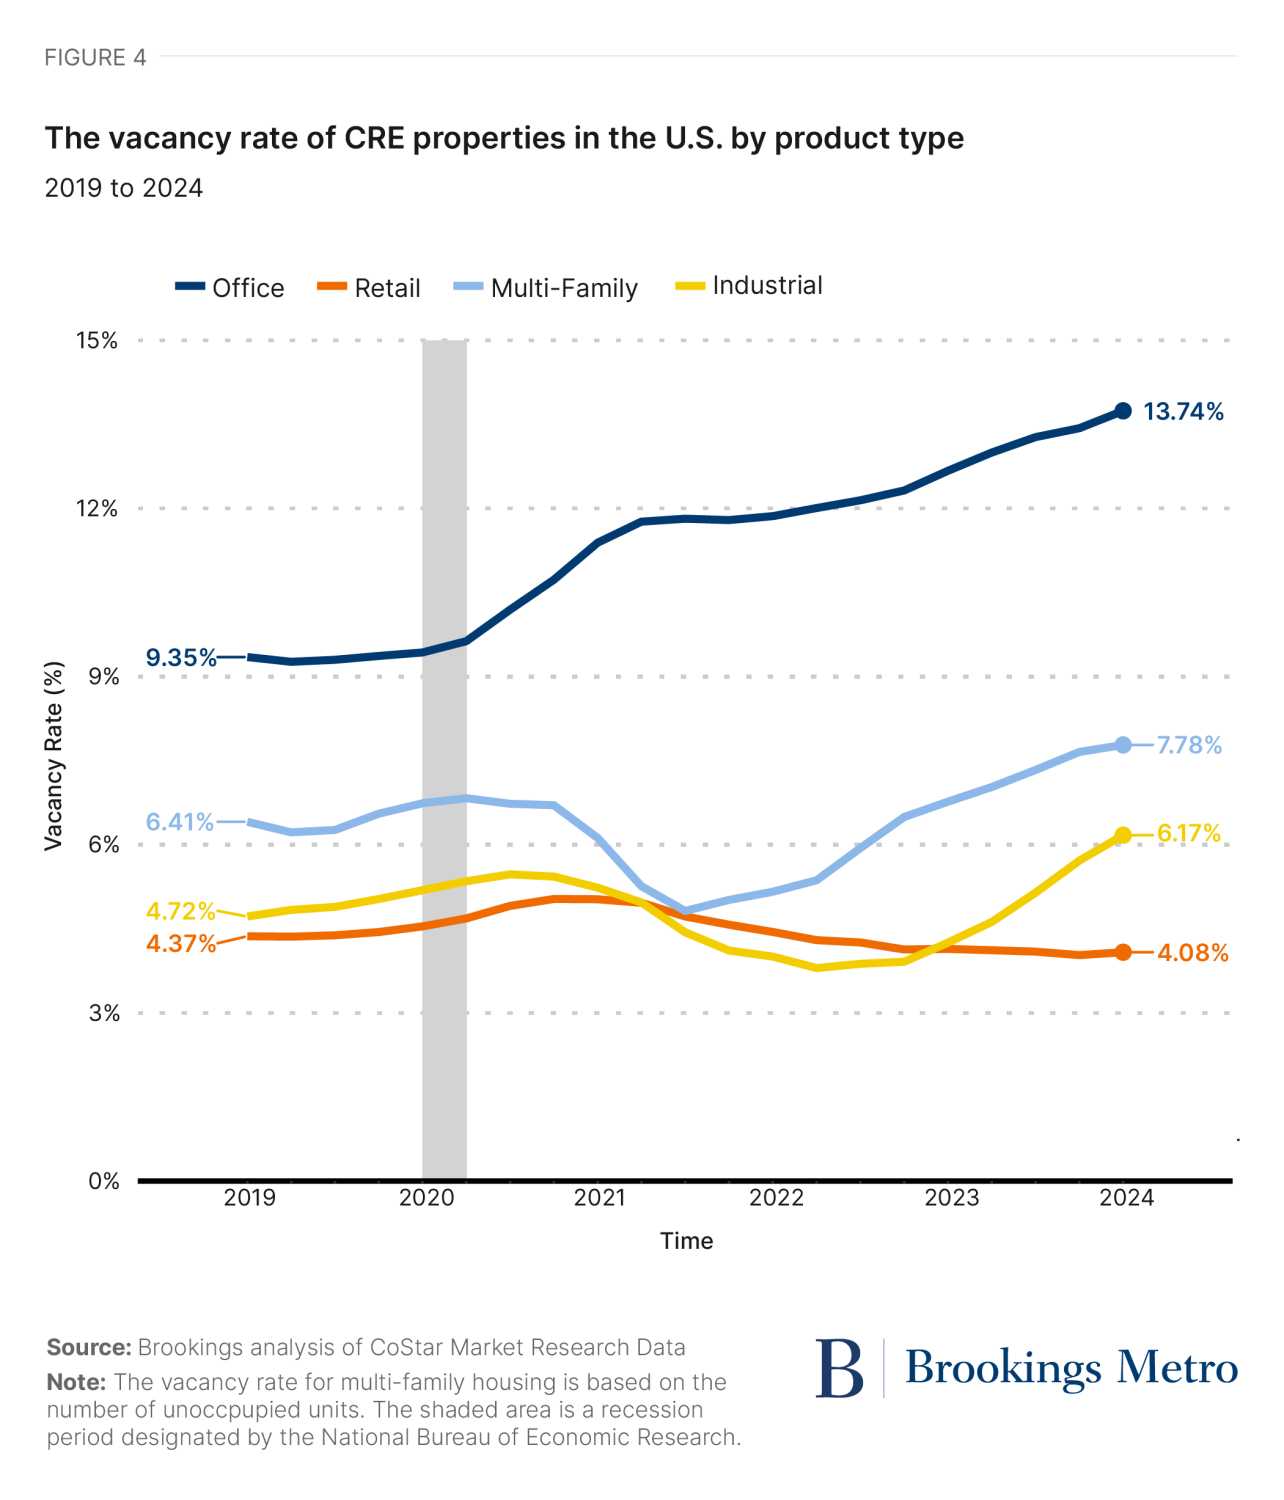
Figure 4 reports vacancy rates by product at the national level over the last five years. As of this year, retail is the top-performing commercial real estate sector by this metric on a national basis, and retail is the only product type for which aggregate vacancy has declined since 2019. Just before the timeline shown on this graph, the conventional wisdom was that America has way too much retail space. It is now appropriate to ask what comes next after the reset—what is needed and next for retail?
5. Retail vacancy varies widely at the hyperlocal level.
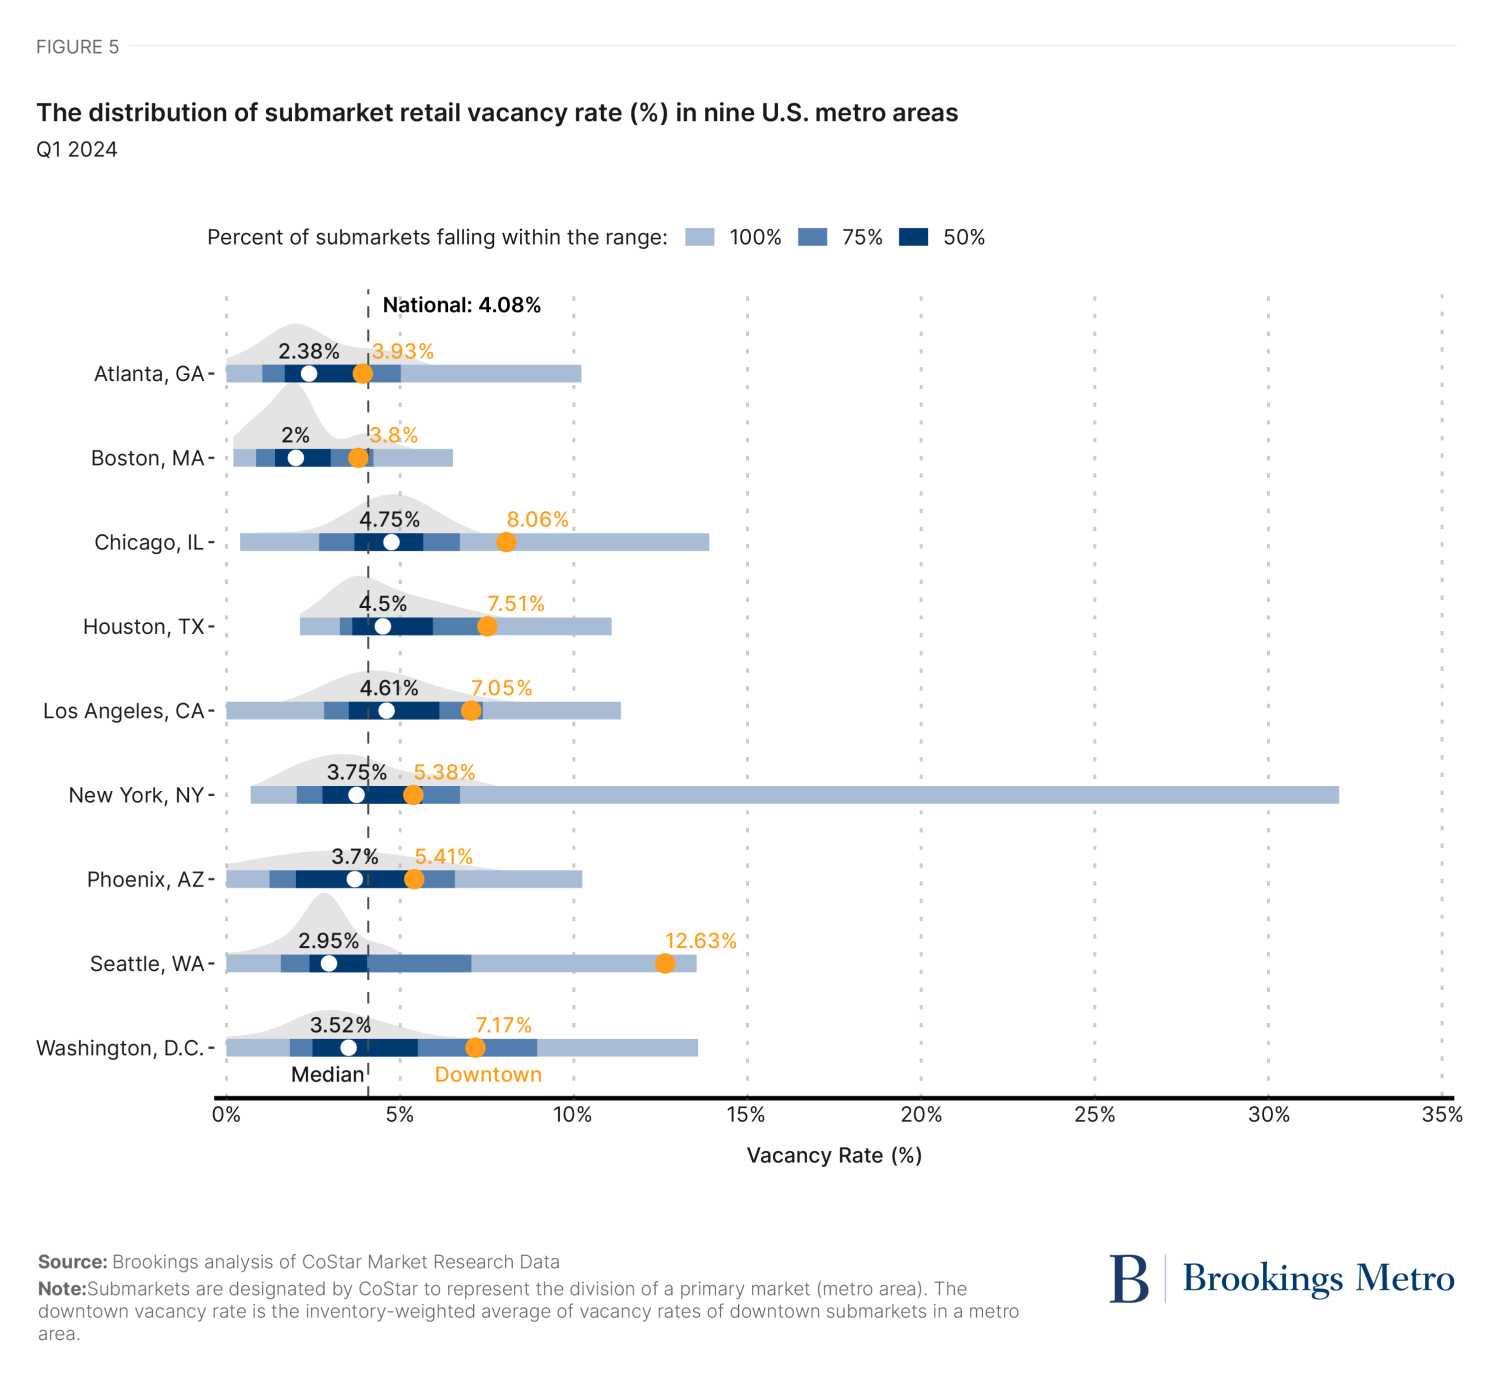
While aggregate retail vacancy is low, there is considerable variation in retail vacancy both across and within metropolitan areas. Two dynamics stand out: across regions, one quarter or more of submarkets have extremely high vacancy rates, which is consistent with the longstanding phenomenon of retail inequality, in which majority-Black neighborhoods, regardless of income, are underserved by retailers, leading to higher vacancy rates. More recently, downtowns are now also experiencing high retail vacancy. This suggests two opportunities for government to partner and enable landlords and investors to do well and do good:
- Revitalize downtowns with innovative local retail offerings alongside complimentary policy interventions around community safety, adaptive reuse, and transportation management.
- Facilitate equitable economic development of local neighborhoods that are underserved by retail while broadening the tax base, creating jobs, and bolstering property values.
6. There is huge room for growth in investing in Black entrepreneurship in retail.
Higher vacancy in Black neighborhoods does not mean there is no market opportunity for retail there—our research indicates the opposite. The challenge is that, historically, Black businesses have suffered from unmerited devaluation that harms both entrepreneurs, neighborhoods, and the aggregate economy. Barriers to capital access are a major reason these businesses do not start or grow.
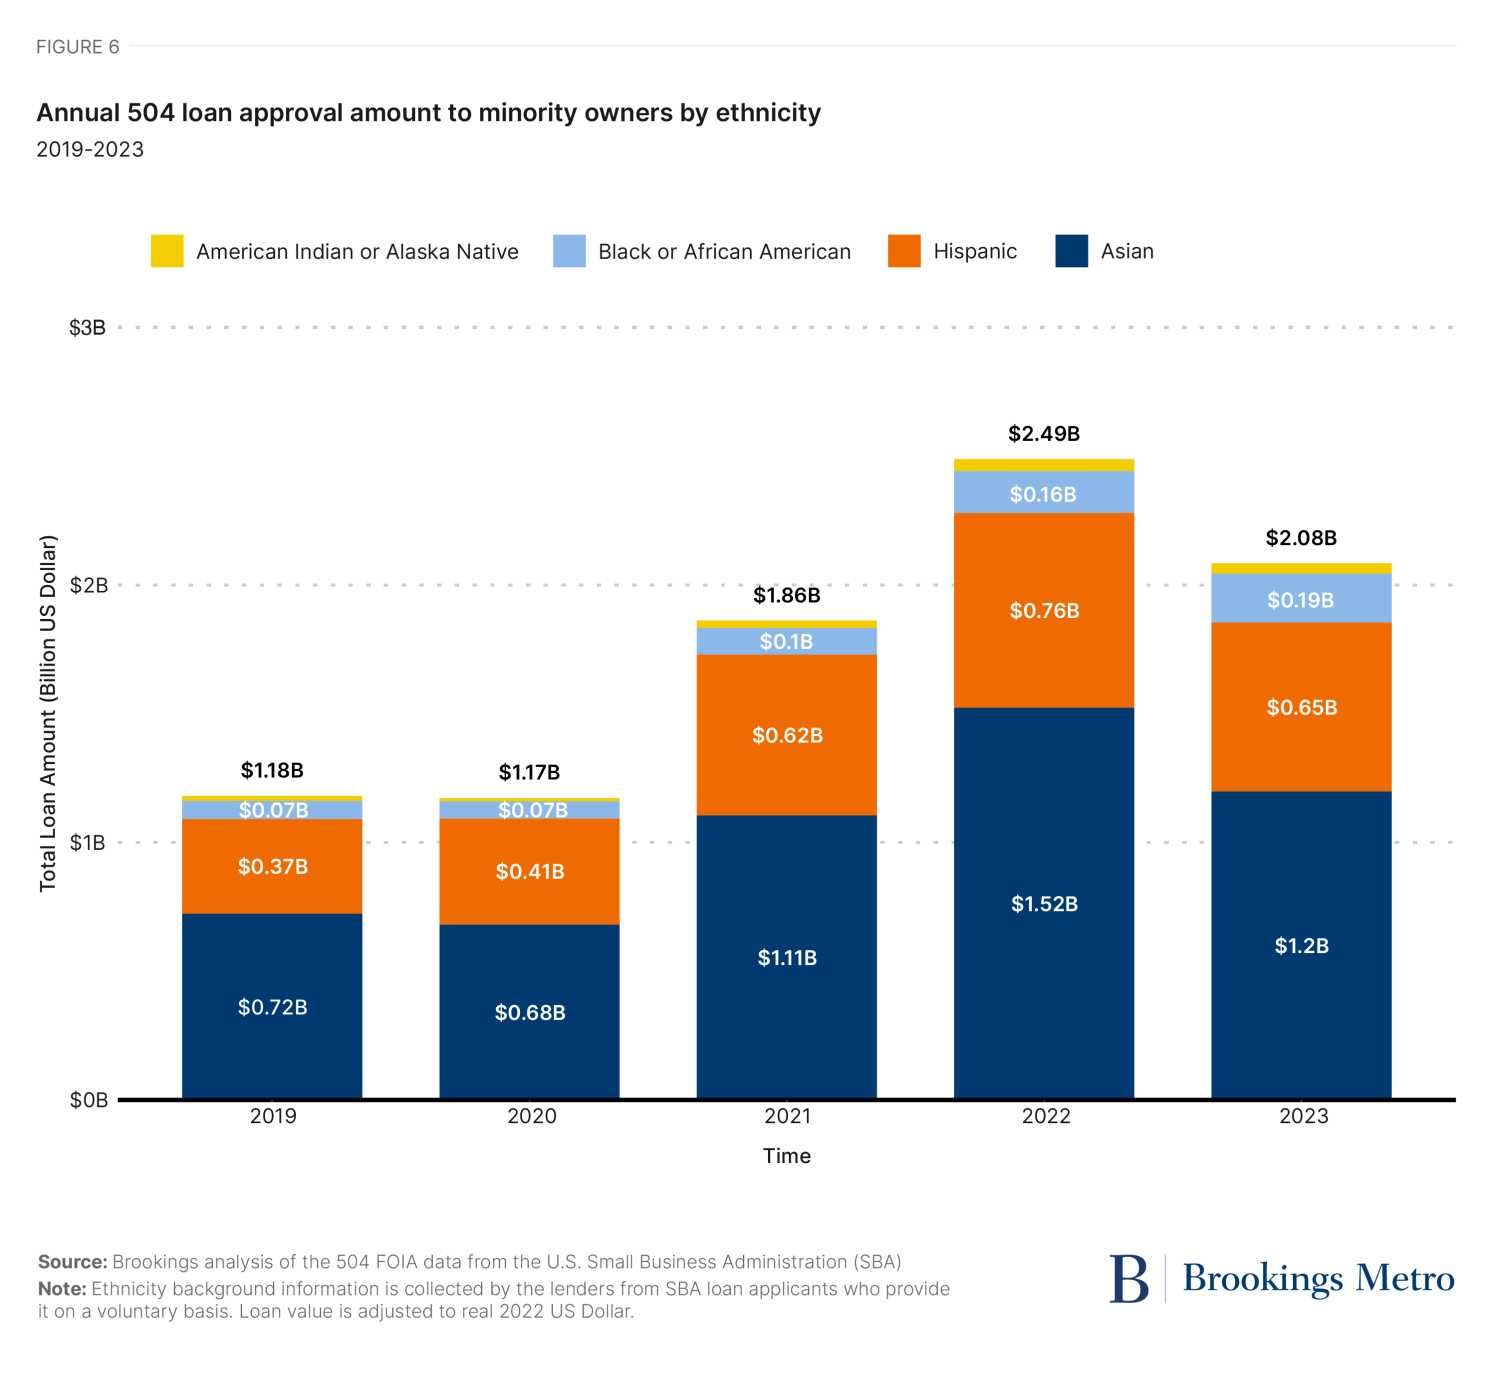
Figure 6 shows the total approval amount of U.S. Small Business Administration (SBA) 504 loans to owners of color by race from 2019 to 2023. The 504 loan program provides long-term, fixed-rate financing for major fixed assets, such as buying a building (we estimate about one-third of the total 504 loan amount each year is granted to retail businesses).
The share of 504 loan dollars going to Black business owners increased from 1.43% in 2019 to 2.97% in 2023. This is a positive trend for closing the racial wealth gap, as business ownership is a critical source of wealth. Still, it is concerning that the share of 504 loan dollars going to Black Americans is far lower than their share of the U.S. population (~14.4%), and their overall rate of entrepreneurship.
Investors, lenders, and local governments should deploy capital and policy to enable business owners to invest in retail real estate in communities of color.
Authors

-
Acknowledgements and disclosures
The authors thank Alan Berube, Kenneth Wun, Geoff Sharpe, Napoleon Wallace, Talib Graves-Manns, and Wilson Lester for their reviews of earlier drafts of this piece.
-
Footnotes
- CoStar produces these estimates by multiplying an average modeled unit price by the total inventory of given property type.
The Brookings Institution is committed to quality, independence, and impact.
We are supported by a diverse array of funders. In line with our values and policies, each Brookings publication represents the sole views of its author(s).