This piece is part of a series titled “The future of U.S.-China policy: Recommendations for the incoming administration” from Brookings’ John L. Thornton China Center.
There is no universally accepted way to establish whether exchange rates are misaligned. Indeed, this question is especially thorny when misalignment persists for a long time because most currency valuation models tend to rationalize persistent misalignments as “normal.” China’s renminbi (RMB) arguably falls into this category, given that its very large current account surplus shows little sign of shrinking (Figure 1), especially as far as the non-commodity goods portion of the trade surplus goes (Figure 2).
I quantify RMB undervaluation using the macro-balance approach, which forms the backbone of the IMF’s External Sector Report and is less susceptible to normalizing persistent misalignments. This approach proceeds in two steps. In the first, it derives an underlying current account position, which closes domestic and trade-weighted foreign output gaps and feeds through lagged moves in the exchange rate. In the second, it calculates how much the real effective exchange rate must rise or fall to close the gap between the underlying current account and some notion of equilibrium. The strength of this approach is that persistent surpluses don’t get “normalized” away, allowing currencies to be under- or overvalued for many years. The weakness is that current account equilibrium positions are highly subjective. That said, China’s per capita gross domestic product (GDP) is still far below that in advanced countries, which suggests it should run current account deficits or—at the very least—far smaller surpluses than it currently does.
Figure 1
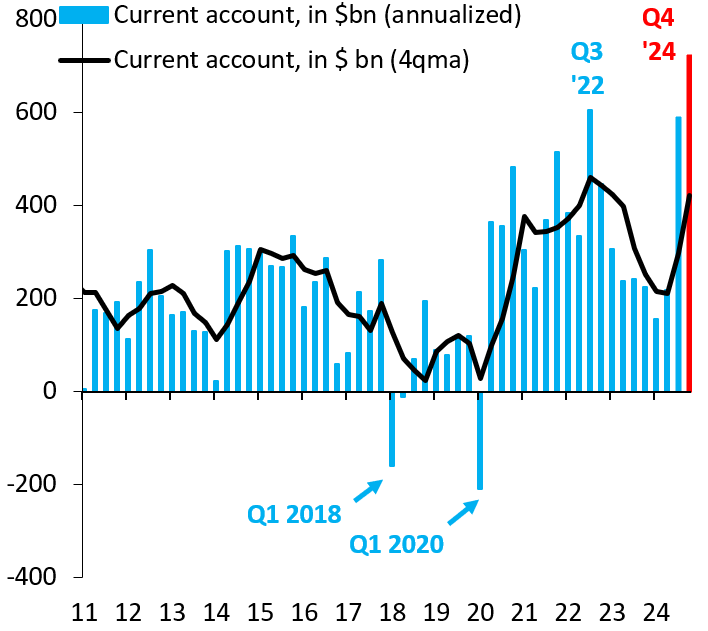
Figure 2
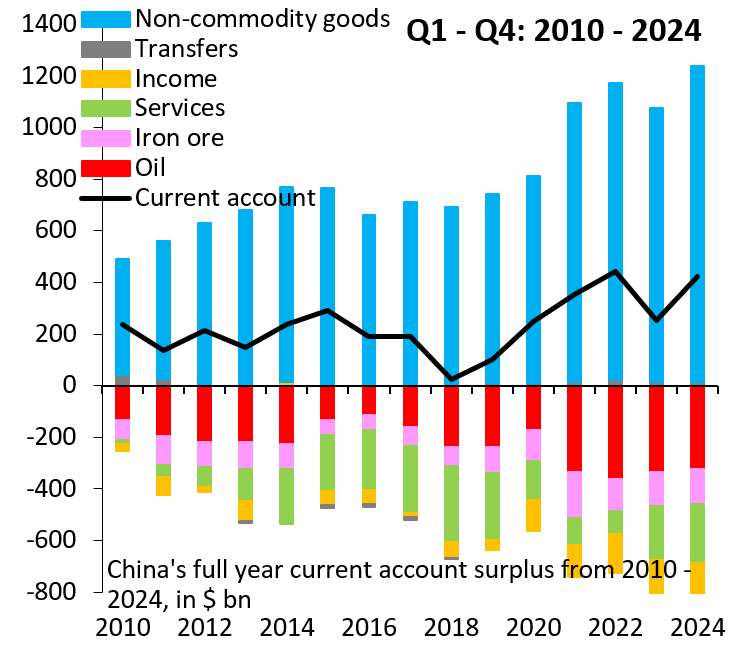
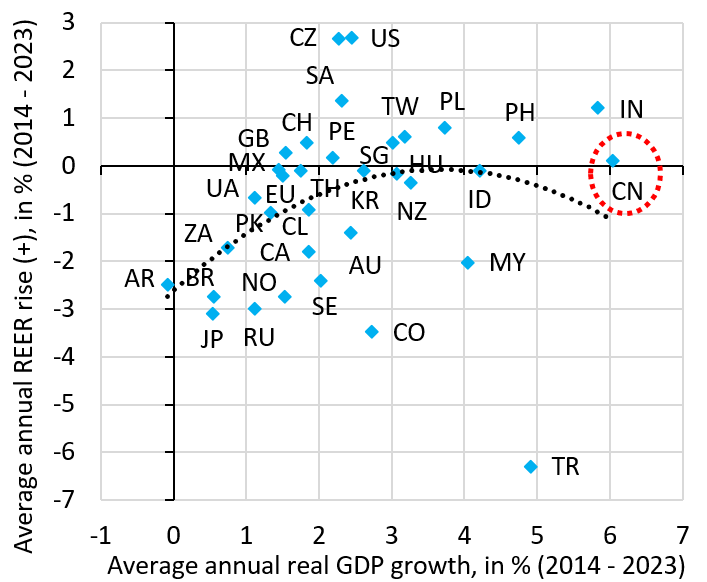
Figure 3 shows the change in real effective exchange rates across 34 advanced and emerging markets over the past decade. China’s RMB occupies the middle ground, having fallen slightly during this period. This perspective tends to understate the degree of RMB undervaluation, because many currencies fell sharply during this period, as falling commodity prices pulled down the currencies of commodity exporters like Brazil, Colombia, and Norway and country-specific policy imbalances caused large depreciations in places like Japan and Turkey. The preponderance of large depreciations makes the RMB look stronger than it really is. One way to adjust for this—admittedly in a crude way—is to look at the nexus between real appreciation and growth. Figure 4 does this by plotting the average annual real GDP growth over the past decade (horizontal) versus real exchange rate appreciation (vertical) over the same period. As the fitted polynomial curve shows, there is a positive relationship between growth and the exchange rate, but this relationship “bends down” as you reach higher growth rates prevalent across Asia. Many Asian currencies are undervalued, but China is likely the most egregious case.
Figure 3
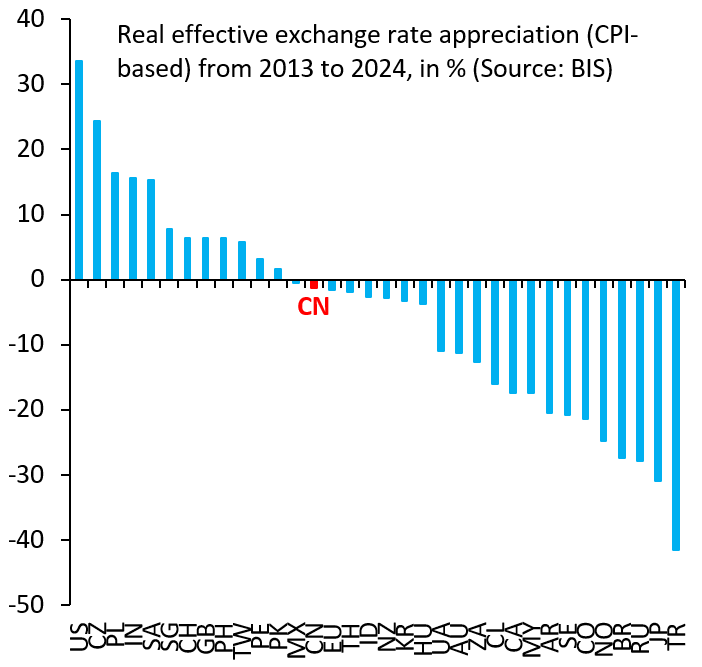
Figure 4
Indeed, the perspective above tends to understate RMB undervaluation for another reason. It looks at averages over the past decade, when, in fact, the real effective RMB has been falling in recent years, unlike other currencies in the region, notably India, the Philippines, and Singapore (Figure 5). This means that the extent of RMB undervaluation is getting worse, not better.
Figure 5
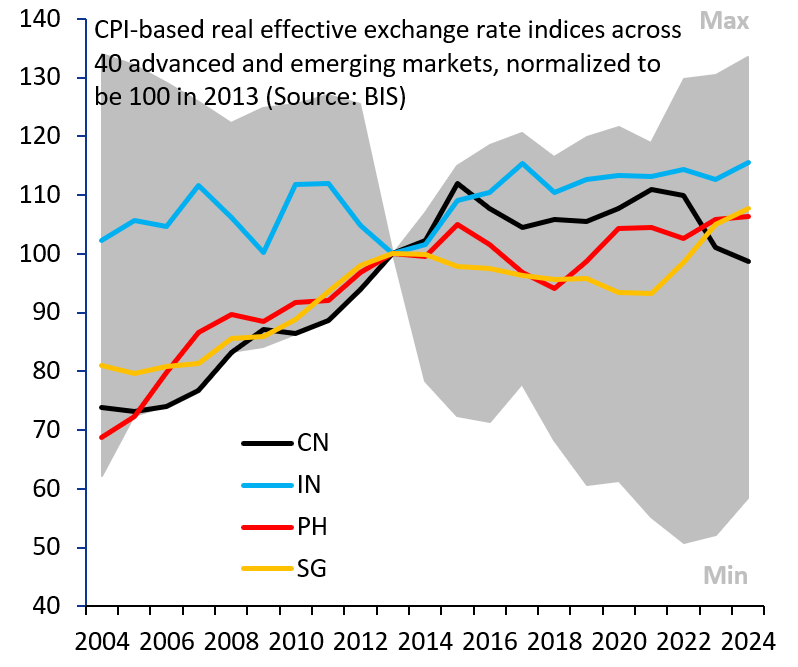
Figure 6
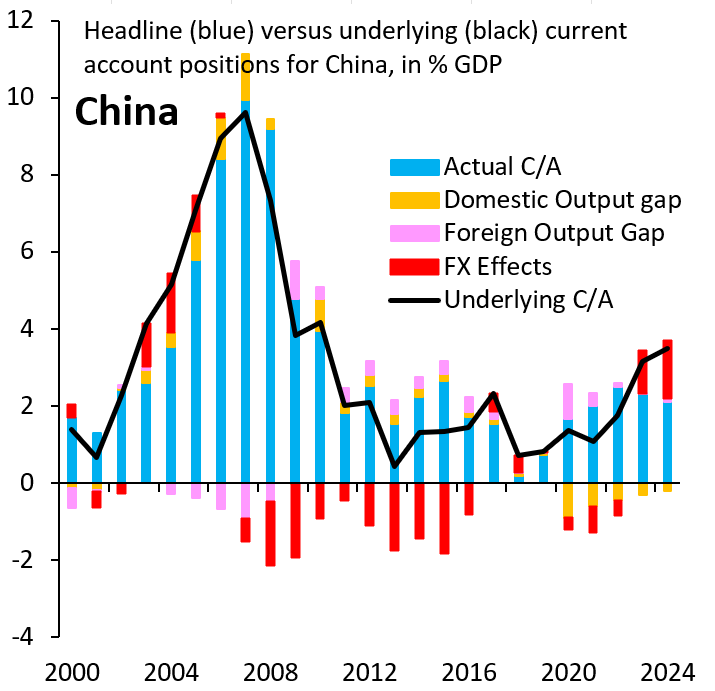
Figure 6 presents my estimate for China’s underlying current account. It uses historical data for the current account balance and forecasts a surplus slightly above 2% of GDP in 2024 and 2025 (blue). Adjusting for domestic (orange) and trade-weighted foreign (pink) output gaps is not material, as these adjustments are mutually offsetting. However, the fall in the real effective RMB (red) is important, as it lifts my estimate of China’s current account surplus (black) to 3.5% in 2025, the highest such surplus since 2010. If we assume an equilibrium current account surplus of 0.5%, this puts the undervaluation of the real effective RMB above 20%. Even with a 2% surplus as equilibrium, undervaluation is still greater than 10%. In short, RMB undervaluation is likely substantial. Tariffs are one way to pressure China to address that imbalance.
My finding that the RMB is likely substantially undervalued runs counter to conventional wisdom, which holds the RMB—if anything—is currently under depreciation pressure and would fall if China’s government stepped away. This view is problematic for two reasons. First, it is well known that China has shifted exchange rate interventions away from the People’s Bank of China to state banks, so whether the RMB is over- or undervalued at the present stage is extremely murky. Second, the RMB has been stable against the U.S. dollar even as the United States has ratcheted up the average tariff rate on China by 20 percentage points. That is a great reminder that the RMB is heavily manipulated and may, therefore, be substantially undervalued. Indeed, China’s large and growing trade surplus in non-commodity goods points in that direction. My calculations are an attempt to map this surplus into a possible range for RMB undervaluation, an exercise that is obviously subject to many caveats.
Author

Related Content


The Brookings Institution is committed to quality, independence, and impact.
We are supported by a diverse array of funders. In line with our values and policies, each Brookings publication represents the sole views of its author(s).


Commentary
Quantifying China’s substantial RMB undervaluation
March 28, 2025