
Among the many disruptions the COVID-19 pandemic caused, its impact on U.S. downtowns has been one of the most significant—and challenging to respond to.
At the start of the pandemic, 22 million people lost their jobs, domestic airline flights fell by almost three-quarters, and many office workers stopped commuting and switched to working from home. These, among other factors, caused a huge drop in traffic, including visits to downtown areas. By early 2023, however, vehicular traffic was back—but there has been far more variation in foot traffic levels across U.S. downtowns.
What explains the recoveries of some downtowns and not others? And more pointedly, how can researchers and policymakers even measure “recovery” and what it looks like? This piece looks at recent research on the outsized rebound of one particular downtown to examine trends in downtown recovery and how they can benefit places that are still struggling in the pandemic’s aftermath.
Why are downtowns recovering at different rates and levels?
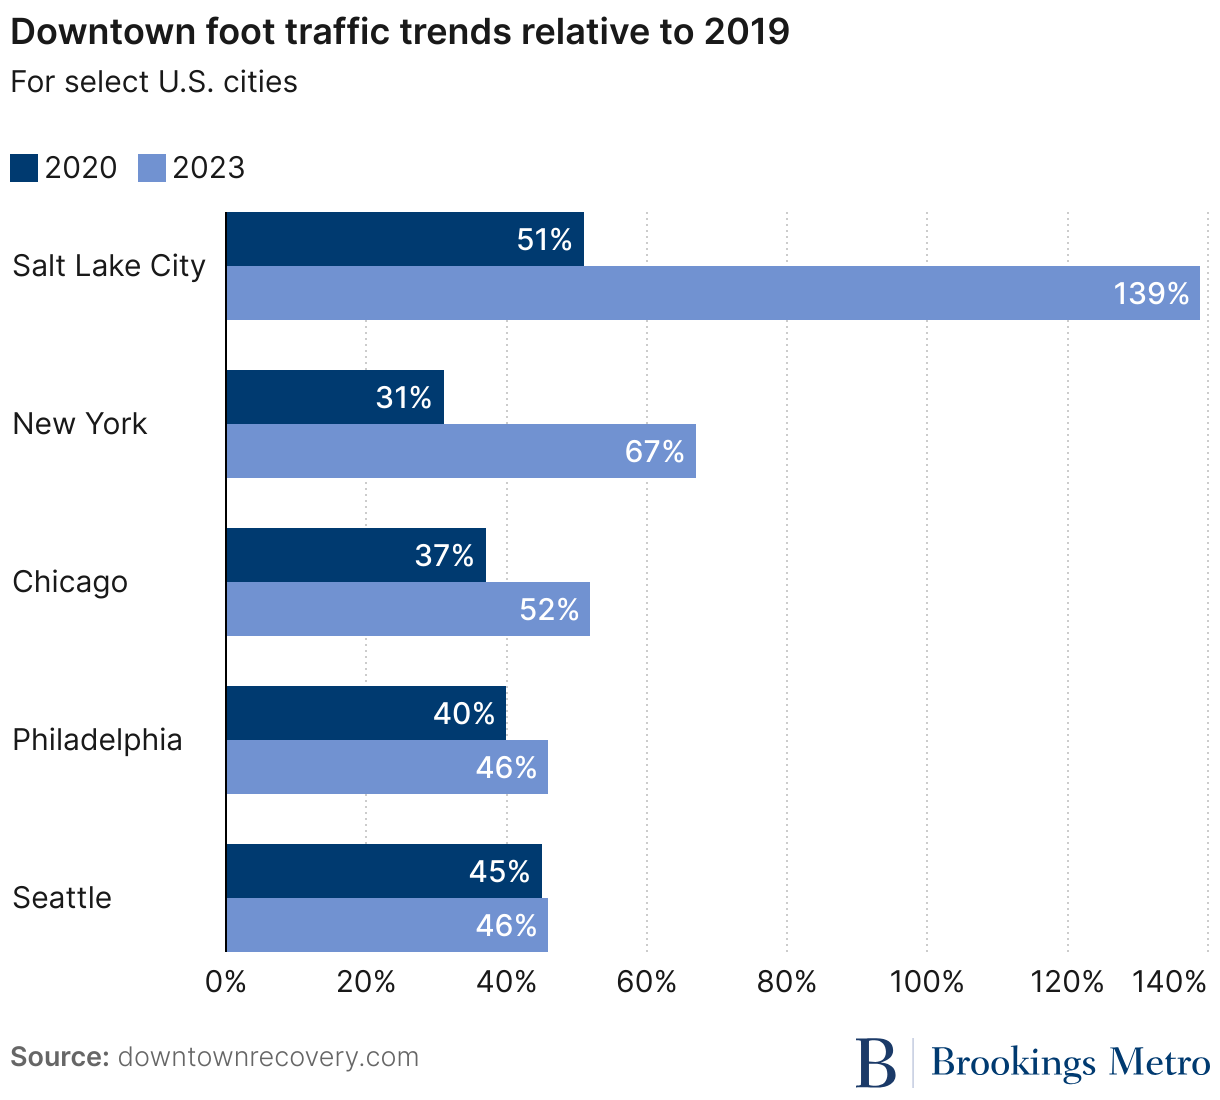
Recent research from the University of Toronto’s School of Cities and the University of California, Berkeley shows that Salt Lake City has recovered the highest percentage of unique visitors to its downtown relative to 2019. Figure 1 shows the city’s “recovery ranking” compared to New York, Chicago, Philadelphia, and Seattle—cities whose downtown recoveries Brookings Metro has been charting as part of a research project on the future of downtowns. How is Salt Lake City leading recovery?
The Toronto-Berkeley analysis is based on a dataset derived from cell-phone-based digital tracking technologies. Their recovery metric is calculated based on the number of unique mobile phones in a city’s downtown area per day, on average per week, and then averaged over a three-month period. This rate is then divided by the number of unique visitors during the equivalent period in 2019 to calculate a recovery ratio.
Much of the concern about downtown foot traffic is related to changes in commuting patterns from the rise of hybrid work. However, this method of weekly averaging will have a smoothing effect on within-week variations in downtown visits. The metric is more sensitive to jobs shifting from in-person office work to fully remote work, jobs relocating outside of downtown, and changes in tourism and other non-work travel.
Below, we present some analysis juxtaposing Salt Lake City against different “kinds” of cities to illustrate some key factors that matter for cities that perform well on the Toronto-Berkeley rankings:
- The scale and concentration of jobs in the commercial core of the region
- The scale and distribution of housing in and near the downtown
- The attractiveness and feasibility of local, regional, national, and international tourism to downtown destinations
Some downtowns are far more exposed to office utilization trends than others
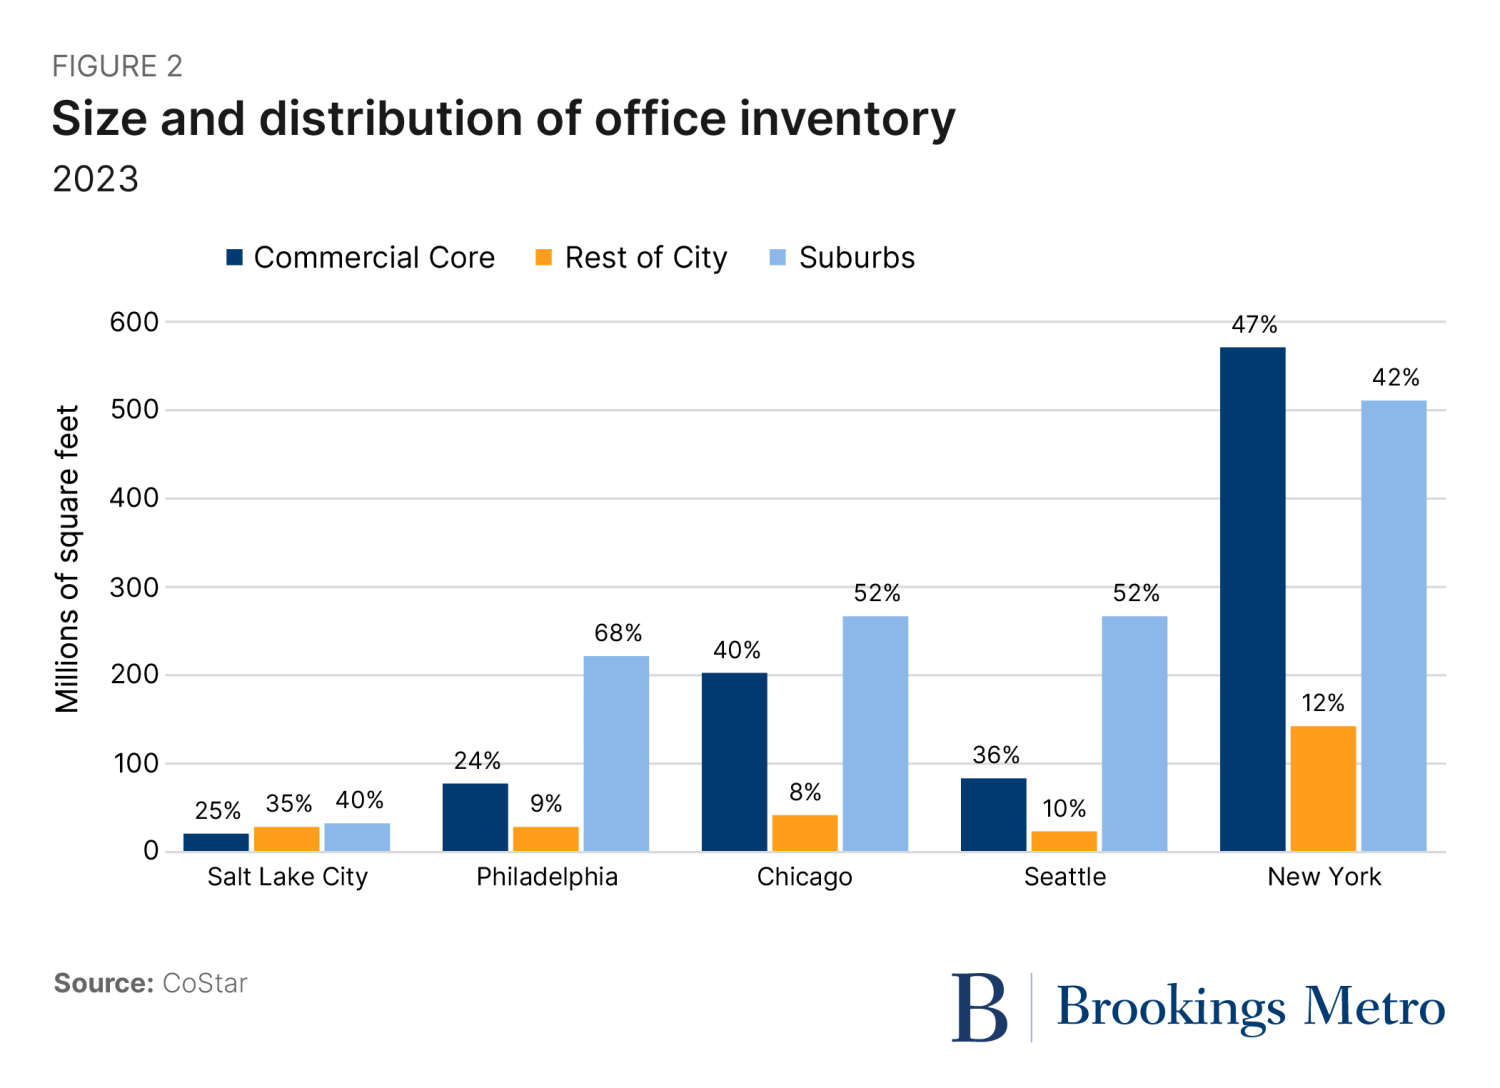
Salt Lake City is a relatively small downtown compared to the biggest U.S. cities, with just over 20 million square feet of office inventory (Figure 2). This low baseline means that the potential for new growth to replace losses related to remote work is more feasible.
For example, according to one estimate, 12% of the 2019 workforce is now fully remote; in Salt Lake City, this would result in approximately 9,000 fewer visits to downtown over the course of a typical work week. New York, on the other hand, is the biggest office market in the United States. In lower Manhattan, a 12% remote work rate means over 250,000 fewer visits. In other words, when a giant stumbles, it can do far more damage than when a pixie falls.
Moreover, even within its region, downtown Salt Lake City’s exposure to office utilization trends is relatively low. The downtown’s share of the regional office market is 25% (Figure 2), with the other three-quarters located elsewhere in the city or in the suburbs. In New York, however, almost half of all the region’s office space is located in Manhattan, south of Central Park. This means that commuting trends concentrate impact on Manhattan far more than they do on downtown Salt Lake City.
Factors besides size distinguish Salt Lake City from other downtowns
There are many factors that distinguish U.S. cities from each other besides size and level of suburbanization, which is evident when comparing Salt Lake City to peer cities of similar size.
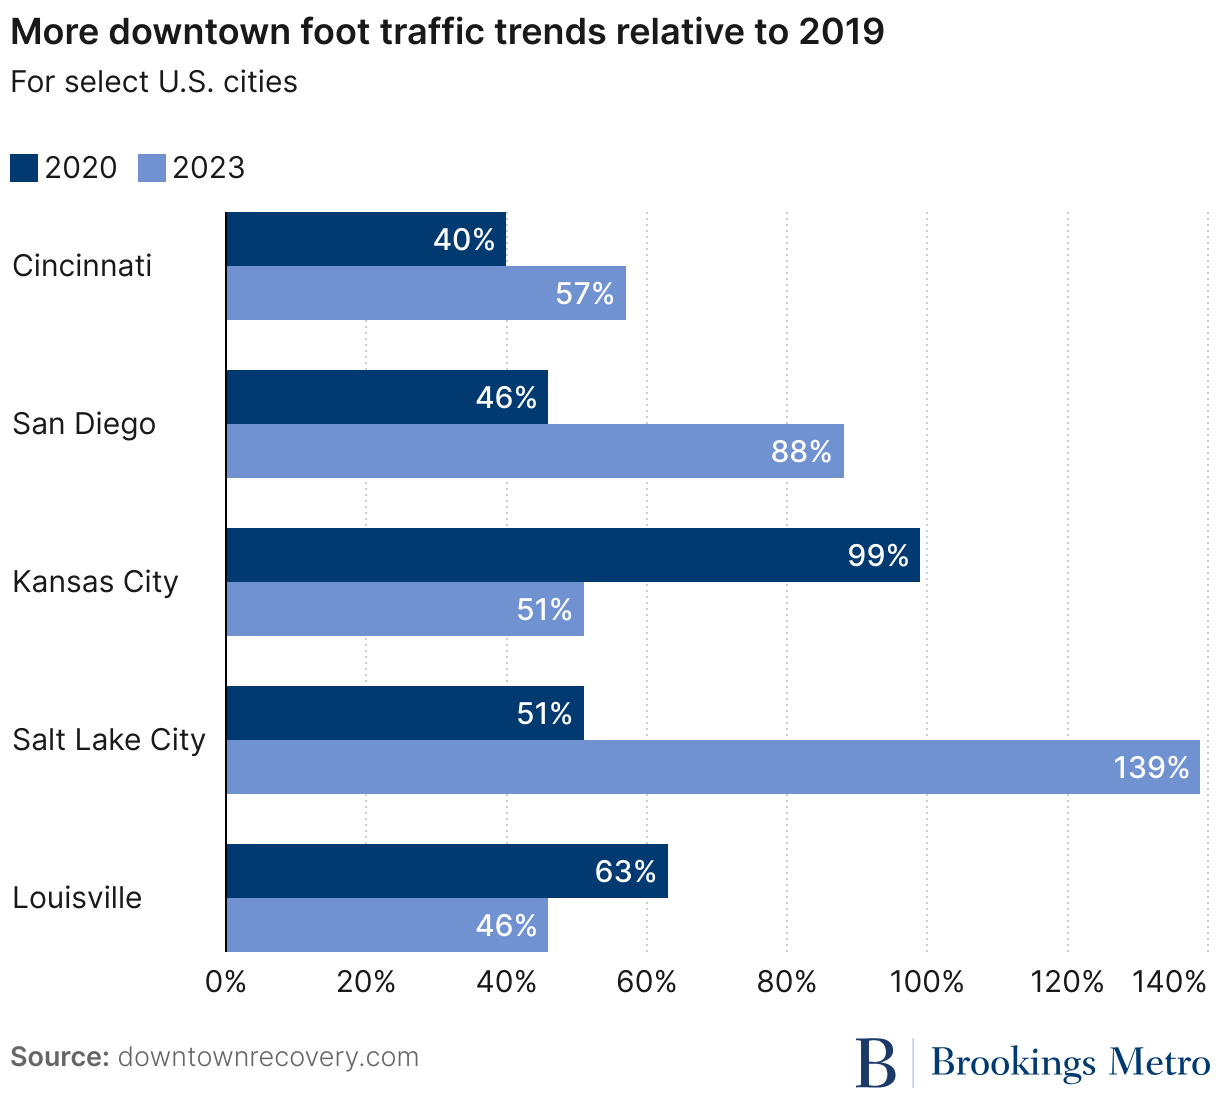
Figure 3 presents the “recovery rankings” for U.S. downtowns closest to Salt Lake City by size that are included in the Toronto-Berkeley sample,1 where size is defined as the number of jobs in the commercial core in 2019. And there is far more variation in the timing and magnitude of downtown visitation trajectories for these smaller downtowns between 2019 and 2023. For example, in Kansas City, Mo. and Louisville, Ky., downtown activity levels had not yet reached their lowest point in mid-2020, as they had in other cities.
In addition to the start of the pandemic, the killing of Breonna Taylor by Louisville police officers also occurred in March 2020, followed by the murder of George Floyd by Minneapolis police officer Derek Chauvin in May. As a result, many cities saw an increase in visitation levels in their downtown areas during the spring and summer of 2020, related to civil unrest caused by these events. It is also possible that this unrest subsequently negatively impacted downtown visitation, which could potentially explain why Salt Lake City—which is only 2.7% Black—has a different downtown visitation trajectory than other U.S. cities.
The case of San Diego is also illustrative. Downtown San Diego’s very strong recovery by the Toronto-Berkeley metric is complicated by the fact that its ZIP code—the unit of analysis the Toronto-Berkeley team uses—includes the airport. Domestic air travel has recovered at a higher rate than office utilization, which helps explain downtown San Diego’s strong performance on a visitation metric based on unique cell phone counts.
Tourism also helps to demonstrate why the downtown ecosystems of some other cities have not yet “recovered.” For example, in downtown Philadelphia, well over half of the population on a typical day in the Center City area in 2019 were visitors (essentially either local, domestic, or international tourists). But the Philadelphia airport handles more than four times as many international travelers as the San Diego airport, and international travel has been slower to recover to 2019 levels than domestic travel. The varying recovery rates between cities could therefore be partially explained by who is ready, willing, and able in 2023 to travel to Philadelphia to see the Liberty Bell compared to going to Salt Lake City to attend the NBA All-Star Game.
Can housing downtown fill the gap?
Even before the pandemic, downtown Salt Lake City’s residential rental market share within its region was unusually high. This has two implications. One, it means that a higher share of downtown’s pre-pandemic activity came from residents as opposed to workers. Two, with a bigger share of the region’s population living in very close proximity to downtown job locations, the short commutes available to these residents may boost office utilization and increase the attractiveness of downtown compared to other areas for new employers seeking to connect to talent.
However, similar statistics in Seattle have not helped recover foot traffic in that downtown, so clearly there are even more factors affecting visitation, such as the share of jobs in the tech sector (as demonstrated by the Toronto-Berkeley group) or varying perceptions and realities related to public safety.
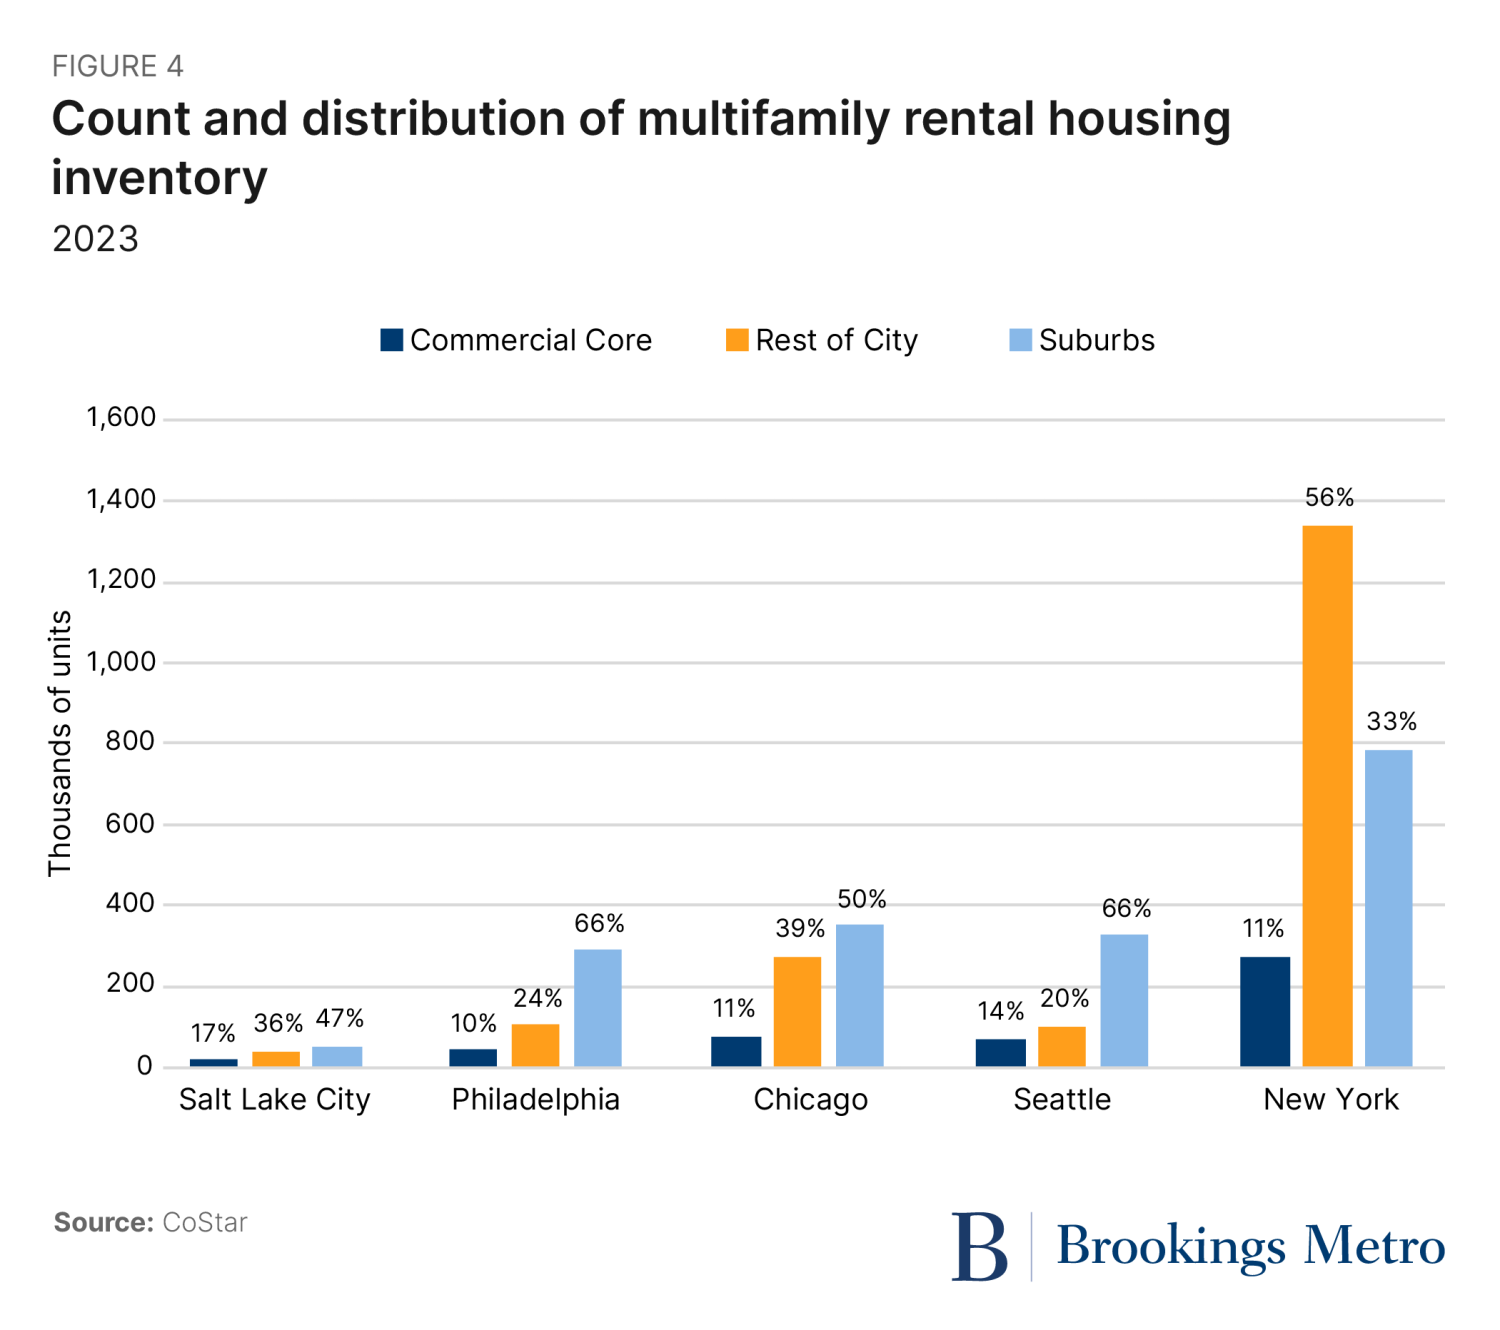
Additionally, in both Seattle and Philadelphia, the higher share of rental housing inventory in the suburbs also stands out (see Figure 4). This means that downtown vitality may be a function not just of the mix of housing there, but downtown-proximate housing in the rest of the city.
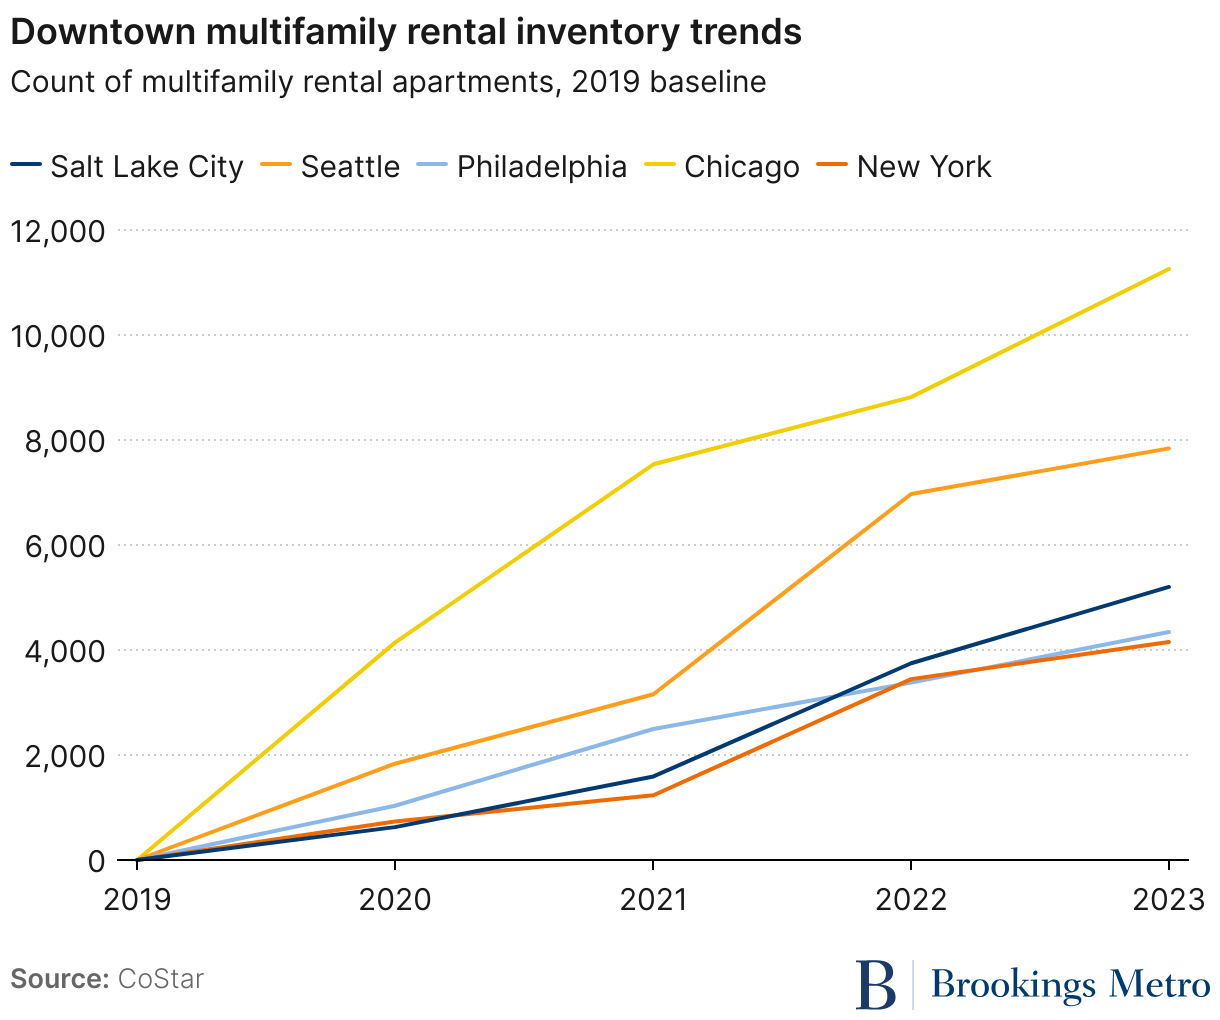
For some downtowns, more housing can make a big difference. In the case of Salt Lake City, which lost approximately 9,000 visits during the shift to remote work, organic growth in new jobs, housing, and/or tourism can close the gap. As shown in Figure 5, downtown Salt Lake City added over 5,000 apartments between 2019 and 2023. At an average household size of 1.43, these units house almost 7,500 new residents at full occupancy—presumably enough new cell phones to fill much of the visitation gap before even considering new jobs or tourists.
Lower Manhattan has added somewhat fewer apartments than downtown Salt Lake City since 2019 (Figure 5). Downtown Chicago, on the other hand, leads the pack on new housing. But in both cases, the far larger size of the 2019 employment base in these downtowns means that new housing at this point is a drop in the bucket after a big spill.
More residents downtown could make a big difference for smaller downtowns. However, not every smaller city is seeing strong market demand and creating a regulatory pathway for new rental housing. Comparing Figures 1 and 3, the 2023 recovery rates of Louisville, Kansas City, and Cincinnati mirror the trajectories of the biggest cities. This is consistent with the fact that between 2019 and 2023, these cities added far fewer multifamily rental apartments downtown than Salt Lake City.
Just because new housing can’t be the single solution for revitalizing big downtowns doesn’t mean that housing in and around downtown is not important for big cities. In terms of attracting employers who are seeking to access talent (and perhaps lease office space), it matters that there are more than four times as many people living in Center City and University City in Philadelphia than in downtown Salt Lake City, and more people living in lower Manhattan than in all of Salt Lake City.2 This residential scale factor also applies to downtown vibrancy: A larger population can sustain more—and more diverse—retail, restaurants, and entertainment.
Downtown ‘recovery’ can mean many things
Downtown areas are a combination of similar and unique factors that affect their visitation trajectories. Understanding which factors are influencing any given downtown can help identify the tailored solutions and supports that each downtown, city, and region needs right now—which challenges are acute, and which strengths are there to build on—to evolve through the disruptions of 2020. For example, a big investment in a small downtown like Fresno, Calif. could produce dramatic results—but who for? Or, for “destination” downtowns, some cities may well decide to pursue strategies that would reduce their dependence on tourism, while others may pivot their tourism strategies to new audiences and markets.
However, it also makes sense for cities and regions to ask whether this metric is a good definition of what it would mean to recover. The simple reality is that the impact of remote work is much larger in big office markets, so perhaps their vision for recovery needs broad, rigorous debate so we know better what to measure.
-
Acknowledgements and disclosures
The author thanks Karen Chapple, David Downey, Hanna Love, Caroline George, and Alan Berube for their thoughtful reviews of this piece. Any errors are solely those of the author.
-
Footnotes
- The Toronto-Berkeley sample is not a complete set of U.S. downtowns, but instead an anomalous mix that does not include many of Salt Lake City’s peers by size, such as Richmond, Va., Birmingham, Ala., and Buffalo, N.Y., but does include some very small U.S. downtowns such as Fresno, Calif. This is a factor that should be taken into account when interpreting the study’s “rankings,” since many major U.S. cities are not ranked.
- Using the commercial core “downtown” boundaries we previously published, the 2020 census population of downtown Salt Lake City was 28,947 people, while the population of Salt Lake City was 199,723. This is compared to downtown Philadelphia (125,961 people) and lower Manhattan (773,243 people).