The much anticipated first set of negotiations on the prices of brand-name prescription drugs for the Medicare Part D program has been completed. The 2026 Maximum Fair Prices (MFP) for 10 selected drugs have been established. The Inflation Reduction Act (IRA) included provisions that enabled the secretary of the Department of Health and Human Services to negotiate the prices for certain prescriptions drugs by amending the “non-interference clause” in Medicare Modernization Act that forbid Medicare from negotiating prescription drug prices. The drugs that were selected for negotiation had to be single source products that would be on the market for 9 years if they were a small molecule product or 13 years if they were a biological product by January 2026 when the MFP takes effect. The drugs selected for negotiation were among the 50 products with the highest level of Part D spending.1
The Act sets out a variety of parameters that govern the first round of negotiations. One key feature is that the Act establishes an upper limit that the negotiation can take in arriving at the MFP that would become the transaction price in 2026. That upper limit is defined as a percentage of the non-federal average manufacturer (NFAMP) prices.2 For selected drugs that have been approved less than 16 years earlier, that upper limit is equal to 75% of the NFAMP. For those more than 16 years post FDA approval the upper limit is 40% of the NFAMP.3
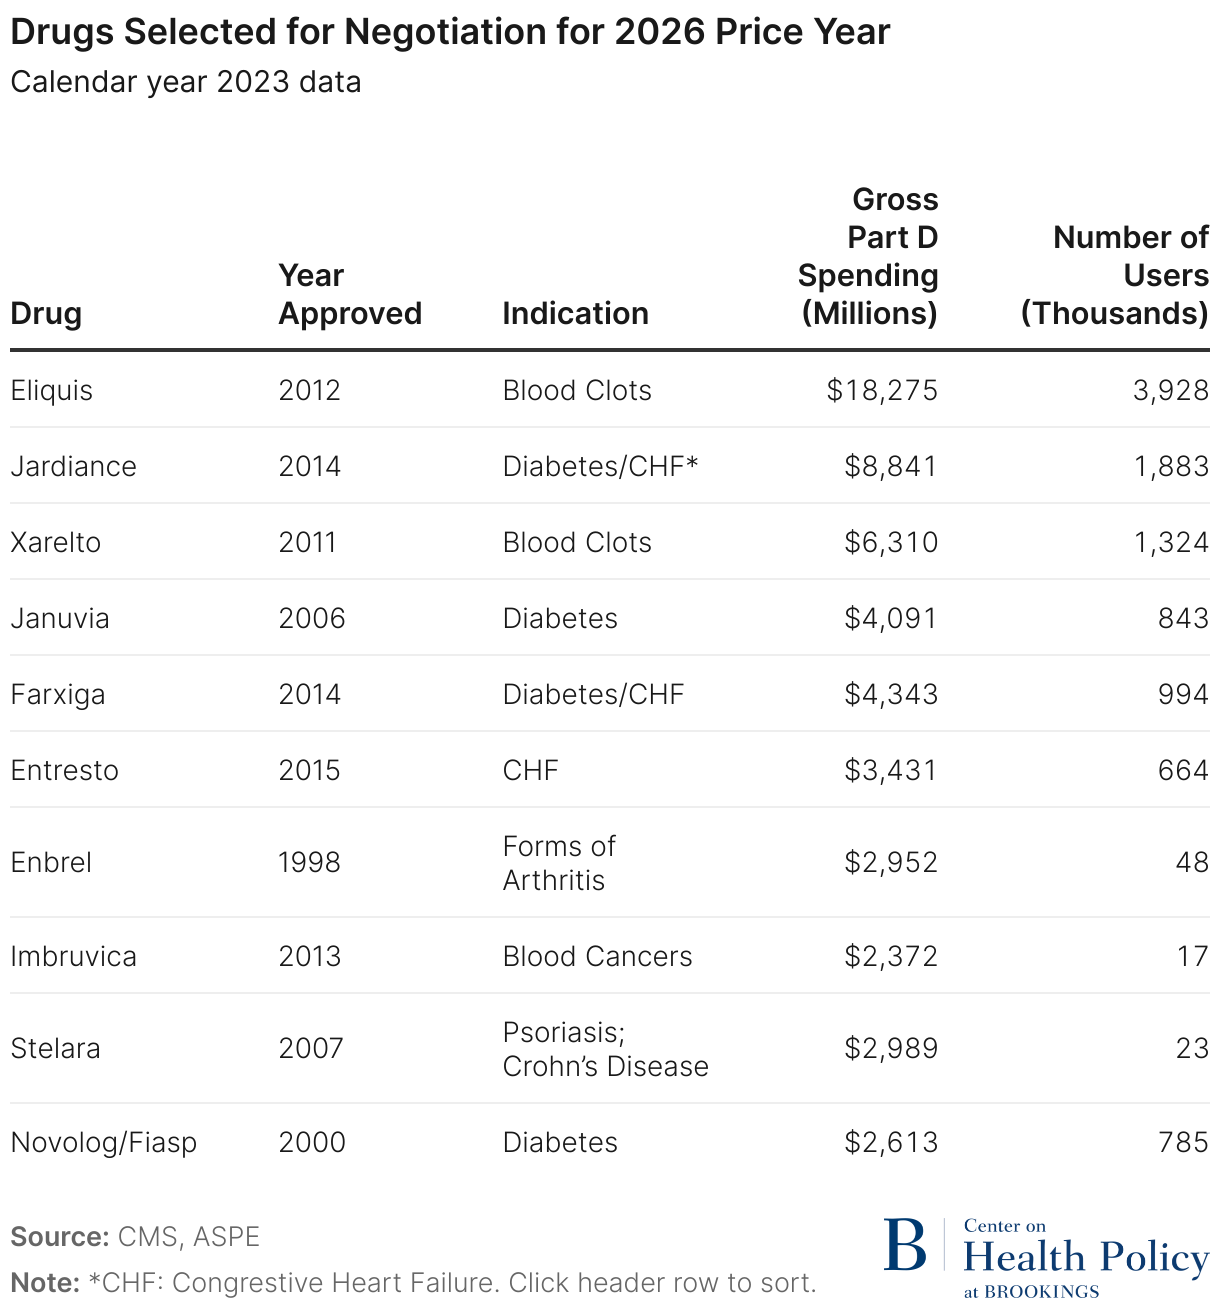
On August 29, 2023, the Department of Health and Human Services announced the 10 drugs selected for negotiations. Table 1 lists the selected drugs, the year they were approved, the conditions they treat, the number of Medicare enrollees in Part D using each drug, and the gross Part D spending during calendar year 2023. Note that in 2026 no drug will have been approved for marketing less than 11 years and one will be 28 years post approval. The Table shows that those drugs account for nearly $50.5 billion in gross Part D drug spending and were purchased on behalf of 9.7 million Medicare beneficiaries.
In this paper we provide an estimate of the savings realized through the negotiation process. The Centers for Medicare and Medicaid Services (CMS) has reported that the reduction in spending associated with the new negotiated prices amounts to $6 billion evaluated at 2023 volumes of prescriptions.4 Our analysis examines the differences in the prices that were realized through negotiation by Part D plans and those obtained through the IRA’s negotiation program for the 10 drugs selected for those negotiations.5 We make use of publicly available data as the detailed price measures for the pre-IRA negotiation period, which would yield would more precise estimates, are confidential. We therefore combine data from multiple sources to approximate pre-IRA net prices to estimate pre-period spending. We then make use of the announced MFPs and apply them to recently reported volume metrics to obtain expected spending for the 10 drugs at the negotiated prices. In the next section, we briefly explain our estimation methods, followed by a presentation of our estimates. The last section discusses the estimates and important issues in interpreting the numbers. We also provide an appendix with a detailed example for one drug that illustrates the details of our estimation method.
Approach to estimating savings
In its simplest conception, our estimates of savings begin by estimating total net spending attributable to negotiations in Part D for the 10 drugs selected for negotiation as well as total spending net of manufacturer rebates in the absence of the IRA. The difference between those amounts is equal to estimated reduction in net spending for each drug that can be attributed to the introduction of federal price negotiations. Our approach is similar to that used by CMS; however, we rely only on publicly available data.
To accomplish this, we must first estimate the net spending by Medicare for the drugs selected for negotiation. We do so by reviewing and combining information from several data sources. They include data on sales from the CMS Drug Spending Dashboard and the CMS Fact Sheet on Negotiation,6 rebates by therapeutic class reported by MedPac, and information on the relationship between Wholesale Acquisition Costs (WAC) and Medicare Part D gross sales process developed by the Congressional Budget Office.7 As a check against these data, we also examined SSR Health data on net prices for the selected drugs. We make use of MedPac reporting on pre-IRA rebates by therapeutic class. Because SSR Health estimates of rebates incorporate a variety of revenue adjustments unrelated to manufacturer rebates—like discount coupons and other consumer discounts—we make use of the MedPac maximum rebates by therapeutic class for each drug to refine the net sales estimates prior to the IRA.8 We believe that using the MedPac maximum rebate estimate is a conservative approach (resulting in lower net sales estimates in the pre-period) because several of the drugs selected for negotiation are mostly specialty drugs and those have been shown to have lower than average rebates for brand name drugs. Finally, the estimates of net spending were based on sales volumes for calendar year 2023. These sources of data and information are assembled to obtain drug specific Medicare Part D net spending estimates. A detailed example of how the information is used is reported in Appendix A.
Results
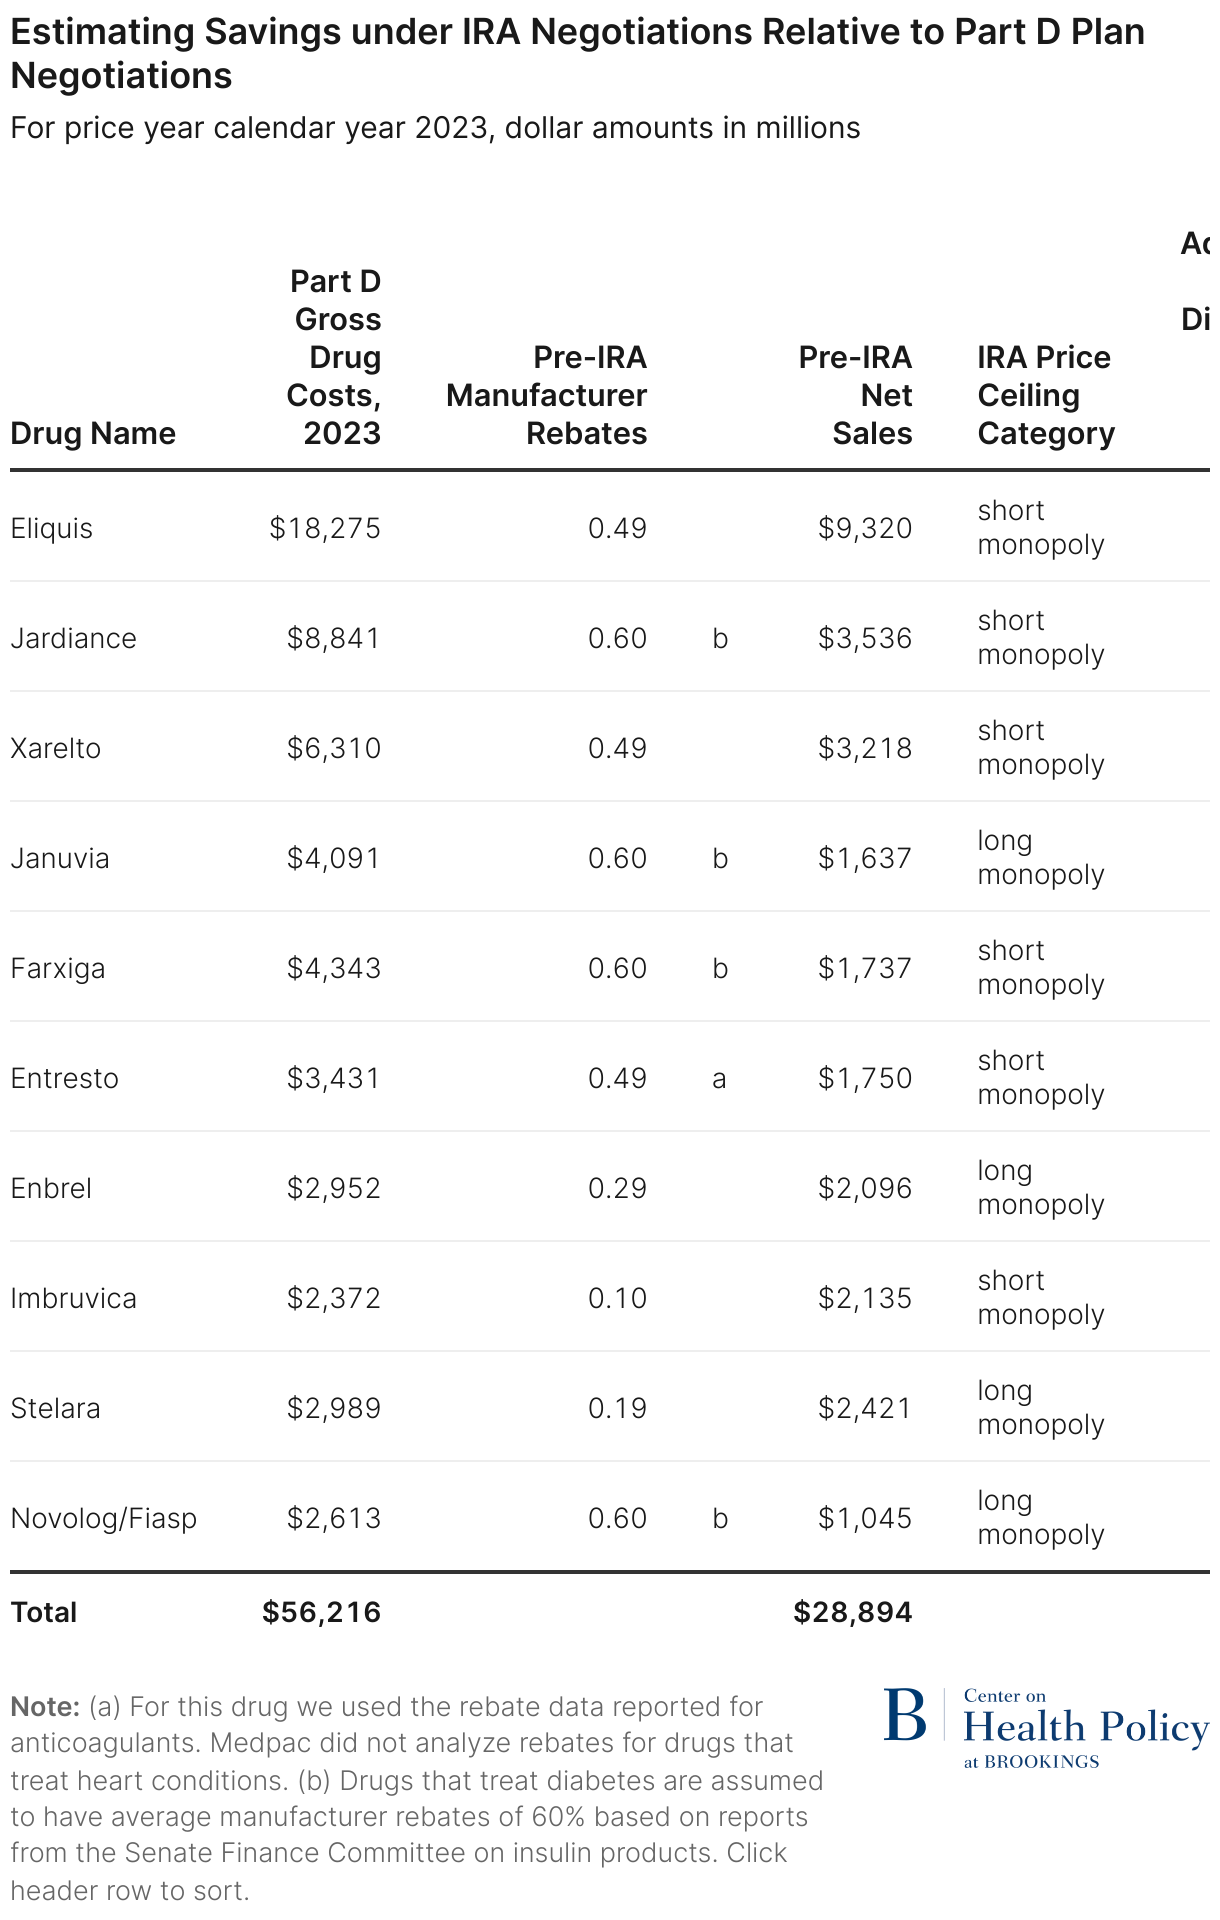
Table 2 reports key data elements that were used in estimating sales resulting from negotiated prices. The table reports the following data elements for each of the 10 selected drugs:
- Gross Part D sales for the pre-IRA baseline (calendar year 2023)
- Pre-IRA manufacturer rebates to Part D plans as a percentage of gross sales
- Classification of each drug as a long or short monopoly drug
- The estimated net of manufacturer rebate sales for each drug in the pre-IRA baseline period
- The discount off of Part D gross drug costs at the Maximum Fair Price
- Estimated sales based on reported MFP under the IRA
- Estimated savings from the pre-IRA baseline.
The estimated impact on the government negotiations compared to sole reliance on prescription drug plans for the 10 drugs amounted to $6.37 billion. On average that meant that the average MFP was 22% below the pre-IRA price net of manufacturer rebates. As the Table highlights, 51.4% of the estimated savings or $3.28 billion is accounted for by 3 drugs (Enbrel, Stelara and Eliquis). Several drugs had large rebates in the pre-IRA period (e.g., Jardiance, Januvia, Farxiga, and Novolog), as noted in the third column of Table 2. It is therefore notable that the negotiations resulted in prices that were likely to be below the statutory ceiling price for those products.9 For example, Januvia saw an 18-percentage point increase in the net of manufacturer rebate price due to negotiation. The Table also reveals that the largest price concessions were obtained for drugs that had the lowest pre-IRA rebates because of limited pre-IRA competition. This is the case for Stelara, Enbrel, and Imbruvica.
Comments on interpretation
The estimates presented represent savings stemming from the differences in sales based on prices negotiated by prescription drug plans pre-IRA and prices negotiated by the government due to the IRA’s creation of the drug negotiation program. We have also used the upper end of the rebate ranges for each class for most of the selected drugs; thus, they are likely to result in a lower baseline net spending estimate. We believe the estimates will most often represent lower bounds on the impact of allowing the government to negotiate some prices. The estimates are not meant to provide a full budgetary impact of the IRA but to focus on how allowing the government to negotiate affects prices relative to relying solely on Part D prescription drug plans. In that sense the estimates show that the government negotiations are especially significant for drugs where market forces were most limited and therefore had the least impact on producing price concessions. This was the intent of the policy design.
Finally, because the estimates rely on publicly available data and not the actual rebates and non-federal manufacturer prices, they are meant to provide an approximation of how the $6 billion in savings is distributed across the 10 selected drugs. Our methods of analysis are similar to those used by CMS, and so it is notable that the reliance on publicly available information leads us to roughly the same estimates of aggregate savings and the percentage reduction net spending as those reported by CMS. Thus, the estimates measure the ability of CMS to effectively negotiate prices and point to what can be expected from future rounds of negotiation as the program grows.
Related Content
Authors


Appendix
Methodology for estimating savings under IRA negotiations for Enbrel
This Appendix describes our methodology for estimating savings under IRA negotiations. We compare the estimated prices that were realized through manufacturer negotiations with Part D plans to those obtained through the IRA’s negotiation program. The reduction in net spending applying the MFP is our estimate of savings.
Our methodology follows that used by CMS which compares Part D spending net of manufacturer rebates in 2023 to spending applying the MFP to the 10 selected drugs. CMS finds that, in the aggregate, the difference in net spending at the lower MFP prices is about $6 billion and net spending is reduced by 22%. Our methods rely on publicly available data to estimate savings. We can closely approximate the total estimated savings by CMS across the 10 selected drugs (we estimate $6.3 billion in savings and a reduction in net spending of 22%). Our methods demonstrate how publicly available data can be used to approximate savings under IRA negotiations in the aggregate as well as give an approximation of how the savings are distributed across the 10 selected drugs.
This Appendix describes each step taken to estimate savings for Enbrel. The starting point for the estimate is gross Part D sales of Enbrel as reported by CMS for calendar year 2023. We estimate how much lower net spending would have been for the 10 selected drugs in 2023 if the drugs had been purchased at the MFP compared to our estimated Part D price net of manufacturer rebates.
We rely on average rebates as a share of gross drug costs under Part D reported by Medpac by therapeutic class to estimate manufacturer rebates for the selected drugs. To estimate net spending under the IRA we start with the difference between the WAC price and the MFP as announced by CMS.10 Since WAC prices are actually somewhat higher than the prices that Part D plans pay to pharmacies for brand-name drugs, we propose a method for converting discounts off of the WAC price to discounts off of the average price paid to pharmacies under Part D. Results from a CBO report on the relationship between WAC prices and the average prices paid to pharmacies under Medicare Part D for brand-name drugs are used to make this adjustment.
Estimated net spending in 2023 after manufacturer rebates for Enbrel
Total gross spending over calendar year 2023 was $2.95 billion for Enbrel. This section explains how we estimate net spending after accounting for manufacturer rebates to Part D plans.
Manufacturer rebates. To approximate manufacturer rebates as a share of gross sales, we rely on a Medpac analysis that estimates average manufacturer rebates to Part D plans by therapeutic class. We use the high end of the range on average rebates for the therapeutic class for each of the 10 selected drugs to approximate manufacturer rebates.11
Medpac reports a range for average manufacturer rebates as a share of gross sales by therapeutic class. Estimates of rebates as a share of gross sales for individual drugs within the therapeutic class could be outside of Medpac’s reported range. However, we believe that making the conservative assumption of taking the upper end of this range is the best available data source for our estimates.
For disease modifying agents that treat Rheumatoid arthritis such as Enbrel, Medpac reports that manufacturer rebates to Part D plans averaged between 20% and 29% in 2022. We take a conservative approach by using the upper end of this range and assume that manufacturer rebates to Part D plans for Enbrel are 29% of gross Part D sales. (Assuming higher rebates to Part D plans will reduce estimated savings).
We note that for drugs that treat diabetes, the Medpac analysis states that rebates averaged over 50% of gross sales. Since a specific upper bound is not provided by the Medpac report for this therapeutic class, we combine that information with reports on rebates on insulin products from Senate Finance Committee reports and assume that manufacturer rebates on the selected drugs that treat diabetes average 60% of gross sales.12
While estimates of net price produced by SSR Health are frequently used by researchers, we choose not to rely on those data on rebates and discounts (even though their rebate estimates are drug specific) because our assessment of those data indicate that the rebates and discounts reported by the SSR Health are greater than the size of rebates received by Part D plans from manufacturers. The SSR Health discounts are average nationwide discounts across all payer types and therefore include purchasers that pay much lower net prices than Medicare such as Medicaid and the 340B program. Those programs receive statutory discounts that are quite large. The SSR Health data also include other types of discounts that do not apply to Medicare such as patient coupon cards.
Estimating net spending without the IRA. After accounting for manufacturer rebates, we estimate that net spending on Enbrel would be 29% lower than gross sales or $2,096 million (Appendix Table 1).
Estimating spending for Enbrel at the MFP
CMS has announced the MFPs for the 10 selected drugs.13 The MFP for Enbrel is 67% below the WAC price. The next step involved converting that amount to a discount off the average price paid to pharmacies for Enbrel under Medicare Part D. This allows us to estimate the MFP discount off of gross part D sales of the drug in 2023.
WAC prices are inflated—that is—they are higher than the prices paid to pharmacies under Medicare Part D. CBO estimates that prices paid to pharmacies for specialty brand name drugs under Part D are 95% of WAC prices.14 After accounting for the inflated WAC prices, a 67% discount off of the WAC price translates to a 65% discount off of the average price paid to pharmacies under Part D (see Appendix Table 3).15
Because WAC prices exceed the prices used by Medicare as the basis for rebate, the rebates or discounts expressed as a percentage of the WAC overstate the percentage gap between the amount paid to pharmacies under Part D and net sales. The higher the discount off WAC, the smaller the impact of the necessary adjustment to the discount percentage (Appendix Table 4).
We now examine the case of Enbrel more closely. The cost of a prescription for Enbrel (30-day supply) at WAC prices is $7,105 (as reported by CMS).16 CMS also reports that the MFP is 67% below the WAC price. So, a 30-day supply of this medication at the MFP would cost $2,355. Because Gross Part D drug costs average 95% of WAC prices for specialty brand-name drugs, the cost of a 30-day supply of Enbrel valued at the prices paid to pharmacies under Part D at the point of sale is $6,750. The difference between the cost of the prescription at the prices paid to pharmacies and the cost of the prescription for Enbrel at the MFP is $4,395. So, the MFP is 65% below the gross cost of the prescription under Part D.
Based on the CMS announcement, we estimate that the MFP for Enbrel is 65% below the value of gross Part D drug costs in 2023. Therefore, the net sales of Enbrel at the MFP would have been $1,025 billion if the drug had been available at the MFP in 2023.
Estimated savings under IRA negotiations
In the absence of the IRA, net sales for Enbrel after accounting for manufacturer rebates to Part D plans are estimated to be $2,096 million. Since the MFP is 65% below the price paid to pharmacies under Part D, then total sales of Enbrel at the MFP would be $1,025 million. Savings under the IRA would be equal to $2,096 million – $1,025 million = $1,070 million. This estimate shows that net spending at the MFP is about 50% lower than the net spending under Part D for Enbrel in 2023 after accounting for manufacturer rebates.
Considerations
This estimate uses gross Part D sales over the 2023 calendar year period to estimate savings under the IRA negotiations relative to the net prices paid by Part D plans after accounting for negotiated rebates with manufacturers. We know that the volume of these selected drugs purchased under Part D in 2026 will differ and have not attempted to adjust our estimates to account for changes in volume between 2023 and 2026. Most of the selected drugs are increasing in sales volume, therefore savings is likely to be higher in 2026 than $6 billion.
| Description | Rebates/Discounts | Calculation or Source | $ millions |
|---|---|---|---|
| Gross Part D Sales | none | CMS Fact Sheet for Selected Drugs | $2,952 |
| Manufacturer Rebates to Part D Plans | 29% of Gross Sales | =29% of $2,952 | $856 |
| Total NET Part D Sales – NO IRA | =$2,952 - $856 | $2,096 |
| Description | Rebates/Discounts | Calculation or Source | $ millions |
|---|---|---|---|
| Gross Part D Sales | none | CMS Fact Sheet for Selected Drugs | $2,952 |
| MFP Discount | 67% off WAC = 65% off Gross Sales (see Table 3) | 65.3% of $2,952 | $1,927 |
| Sales Under IRA at the MFP | $2,950 - $1,927 | $1,025 | |
| Savings Under IRA | $2,096 - $1,025 | $1,070 (The IRA lowers net spending by an estimated 51% for Enbrel) |
| Description | Amount | Calculation/Source | Explanation |
|---|---|---|---|
| WAC price for 30-day supply CY 2023 | $7,105 | CMS Fact Sheet | Cost of 30 day supply at WAC |
| MFP discount off WAC | 67% which equals $4,750 | = 67% of $7,105 | MFP discount is 67% of the WAC |
| Cost of 30 day supply at the MFP | $2,355 | = $7,105 - $4,750 | Prescription cost at WAC less MFP Discount |
| Part D prescription cost at price paid to pharmacies | $6,750 | = 95% of $7,105 | CBO finds the cost of a prescription at gross Part D prices is 95% of the cost of a prescription at WAC prices for specialty brand-name drugs |
| MFP dollar discount amount off price paid to pharmacies under Part D | $4,395 | =$6,750 – $2,355 | The difference between the price paid to pharmacies and the MFP |
| MFP Percentage Discount off prices paid to pharmacies under Part D | 65% | =$4,395/$6,750 | This 65% can be applies to the value of gross Part D drug costs to estimate sales at the MFP. |
| Rebate As Share of WAC | Net Price | Average Price Paid to Pharmacies (Source: CBO) | Rebate Amount After Adjusting for Inflated WAC Price | Rebates Expressed as a Share of Gross Drug Costs |
|---|---|---|---|---|
| 10% | 90% of WAC | 95% of WAC | (95% - 90%) of WAC = 5% of WAC | (5%/95%) = 5.3% |
| 20% | 80% of WAC | 95% of WAC | (95% - 80%) of WAC = 15% | (15%/95%) = 15.8% |
| 30% | 70% of WAC | 95% of WAC | (95% - 70%) of WAC = 25% of WAC | (25%/95%) = 26.3% |
| 40% | 60% of WAC | 95% of WAC | (95% - 60%) of WAC = 35% of WAC | (35%/95%) = 37% |
| 67% | 33% of WAC | 95% of WAC | (95% - 33%) of WAC = 62% of WAC | (62%/95%) = 65% |
-
Acknowledgements and disclosures
The authors thank Loren Adler for helpful comments on an earlier draft of the paper.
Anna Anderson-Cook is currently a Senior Fellow at Arnold Ventures. She previously spent over 20 years as a Principal Analyst at the Congressional Budget Office focusing on research and cost estimates related to prescription drug policy. Arnold Ventures supports Brookings’ Center on Health Policy through its grants program and Dr. Cook’s contributions to this paper are based on her expertise and analysis alone.
The Brookings Institution is financed through the support of a diverse array of foundations, corporations, governments, individuals, as well as an endowment. A list of donors can be found in our annual reports published online here. The findings, interpretations, and conclusions in this report are solely those of its author(s) and are not influenced by any donation.
-
Footnotes
- For a complete description of the requirements for a negotiation eligible drug see Section 1192 of the Inflation Reduction Act or a summary produced by the Kaiser family Foundation at https://www.kff.org/medicare/issue-brief/explaining-the-prescription-drug-provisions-in-the-inflation-reduction-act/
- For some drugs the upper limit may be the Part D price net of manufacturer rebates if that is lower.
- In 2030 a third category of upper price limit is defined as 65% of FAMP for drugs approach 12 years earlier but less than 16.
- Medcare Drug Price Negotiation Program: Negotiated Prices for Initial Price Applicability Year 2026 (cms.gov)
- We follow the CMS approach to assessment by using the 2022-2023 volume of prescriptions for making price impact comparisons.
- https://www.cms.gov/files/document/fact-sheet-medicare-selected-drug-negotiation-list-ipay-2026.pdf
- Congressional Budget office, A Comparison of Brand Name Drug Prices Among Selected Federal Programs, February 2021. Available at https://www.cbo.gov/system/files/2021-02/56978-Drug-Prices.pdf.
- https://www.medpac.gov/wp-content/uploads/2024/07/July2024_MedPAC_DataBook_Sec10_SEC.pdf
- We cannot estimate the difference between the MFP and the ceiling price for higher rebate drugs where the ceiling price will be the net Part D price. We can only roughly estimate this since the Non-FAMPs are confidential
- Other sources used by researchers such as SSR Health also report discounts and rebates off WAC.
- See https://www.medpac.gov/wp-content/uploads/2024/07/July2024_MedPAC_DataBook_Sec10_SEC.pdf. Page 167. Entresto was not included in the therapeutic classes for which Medpac reported rebates. We assumed that Part D rebates for Entresto were similar to anticoagulants.
- Grassley-Wyden Insulin Report (FINAL 1).pdf (senate.gov)
- https://www.cms.gov/files/document/fact-sheet-negotiated-prices-initial-price-applicability-year-2026.pdf
- See Table 2 in the CBO report https://www.cbo.gov/publication/56978
- This estimated relationship between WAC and gross Part D drug costs is based on 2017 data. The results should still roughly apply to 2023 gross Part D drug costs used in this analysis. However, in future years, the gap between WAC prices and the prices paid to pharmacies under Medicare Part D is likely to grow. That is likely to occur because the new pharmacy DIR policy is expected to lower the amount paid to pharmacies at the point of sale by 7% on average starting in 2024 as more of the discounts provided by pharmacies are passed through at the point of sale. (See page 148 of the 2024 Medicare Trustees Report https://www.cms.gov/oact/tr/2024).
- See the CMS Fact Sheet on the negotiated prices https://www.cms.gov/files/document/fact-sheet-negotiated-prices-initial-price-applicability-year-2026.pdf
The Brookings Institution is committed to quality, independence, and impact.
We are supported by a diverse array of funders. In line with our values and policies, each Brookings publication represents the sole views of its author(s).