Every two years, people who are interested in politics sit glued to the media of their choice as the election returns roll in. Many races are called as soon as the polls close, but the ones that matter most—that spell the difference between majority and minority status for a political party—usually aren’t.
By themselves, the developing vote totals in close races aren’t all that revealing. It depends on where the votes are coming from. For House races, it’s particular precincts. For Senate and gubernatorial races, it’s counties that have developed reputations as indicators of statewide sentiment. Often these reputations are deserved; sometimes they aren’t. Commentators typically focus on large, well-known counties, overlooking smaller counties that may be more reliable bellwethers.
To test conventional wisdom and to develop a guide for people who don’t analyze politics for a living, we looked at all the contested Senate races this year. Most of these states also had Senate contests in 2010, the most recent off-year election. For each of the states we studied, we asked a simple question: which counties came closest to mirroring the state-wide results? This article presents those results in both numerical and geographical form.
Some readers may wonder why we went back four years rather than looking at the most recent Senate races. The answer reflects one of most pervasive rhythms of American politics: although turnout in presidential elections is about 60%, it’s much lower—around 40%—in midterm elections. And the 40% is not a random sample of the 60%. Midterm electorates are typically older, whiter, more married, more educated, and higher-income than the electorate as a whole. Comparing mid-term results to presidential years is the proverbial apples to oranges.
Every year is different, of course. Advertising and campaigning in the battleground states this year have been so intense that turnout may be considerably higher than usual. Still, other factors—such as population size and composition—have changed only modestly in most counties. So there’s a much better than random chance that the counties we’ve identified will come close to mirroring the statewide results.
Colorado
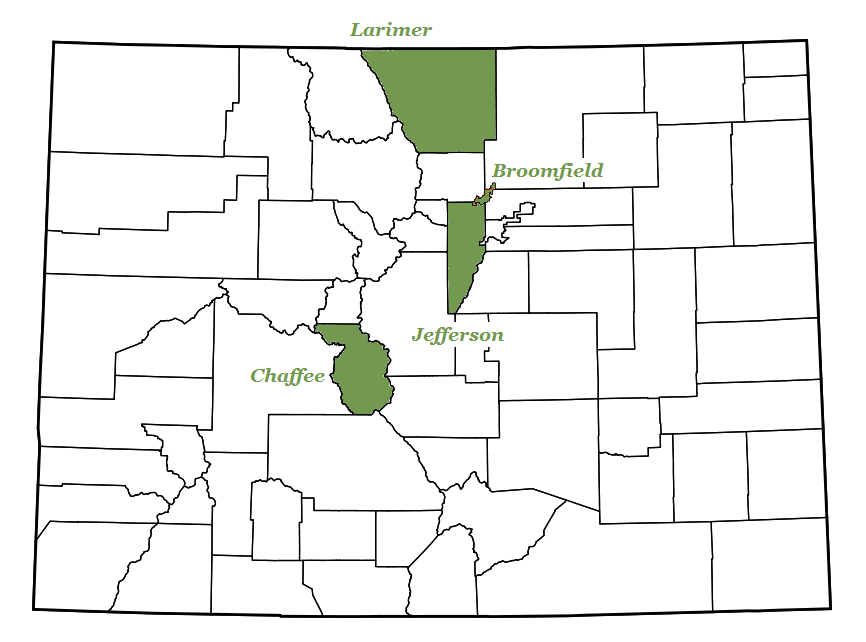
Colorado is unique among the races covered here in that it is the only one to have gone to the Democrats in 2010. After being appointed in 2009 to fill the seat vacated by Ken Salazar, Michael Bennet defeated Ken Buck 48% to 46% to earn a full term in his own right. We found that it was Larimer County—containing Fort Collins—that matched this result exactly. Additional counties to watch include Broomfield and Jefferson (both breaking 49% to 46% for Bennet), and Chaffee with a dead-even 47% to 47%.
Colorado, 2010:
- Larimer, 48% Dem / 46% Rep
- Broomfield, 49% Dem / 46% Rep
- Jefferson, 49% Dem / 46% Rep
- Chaffee, 47% Dem / 47% Rep
Georgia
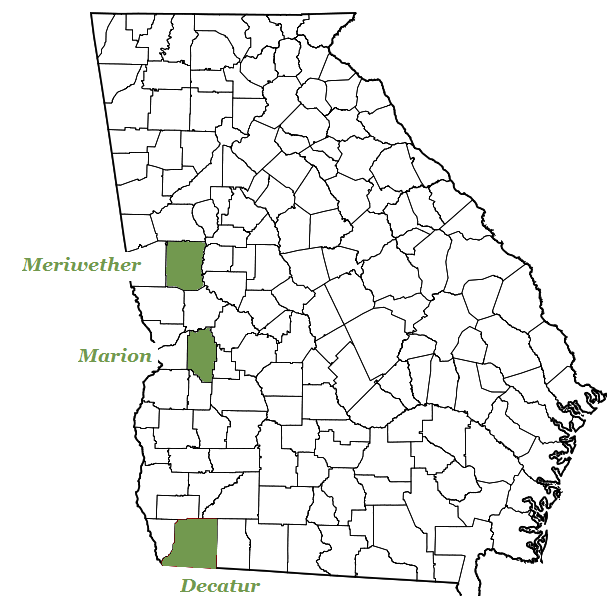
In 2010, Georgians reelected Republican Johnny Isakson over Democratic challenger Michael Thurmond by a margin of 58% to 39%. Also notable was the Libertarian candidate, Chuck Donovan who managed to collect nearly 3% of the vote. In Georgia, it was the small Marion County that exactly matched this result. Also close was Meriwether County in the west with 58% for Isakson, 40% for Thurmond, and 2% for Donovan, as well as Decatur County in the south with 59% for Isakson, 39% for Thurmond, and 2% for Donovan.
Georgia, 2010:
- Marion, 58% Rep / 39% Dem / 3% Lib
- Meriwether, 58% Rep / 40% Dem / 2% Lib
- Decatur, 59% Rep / 39% Dem / 2% Lib
Iowa
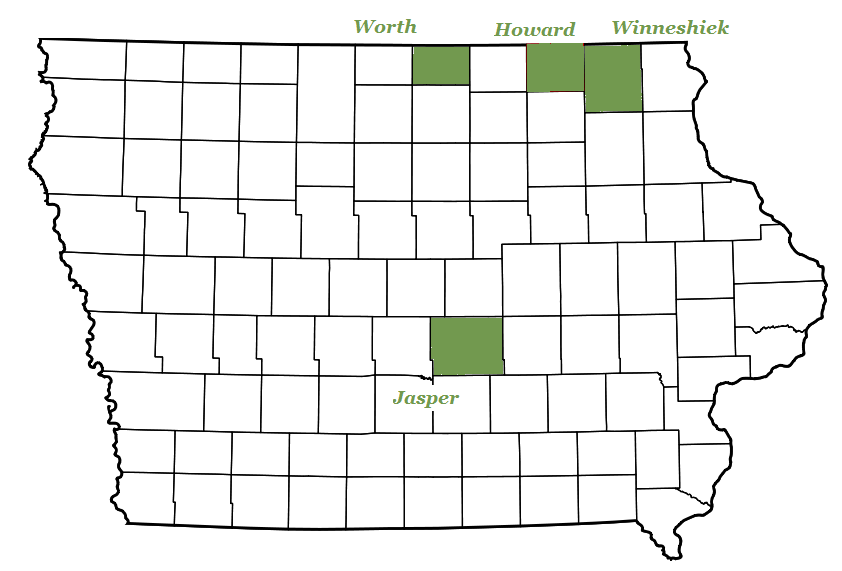
In 2010, the incumbent Republican Charles Grassley was elected for a fifth term, defeating Democrat Roxanne Conlin by a margin of 64% to 33%. Worth County in the north matched that margin exactly. Just east of Worth, neighboring Howard and Winneshiek counties both reelected Grassley by a 64% to 34% spread. Jasper County in the center of the state also voted for Grassley 64% to 34%.
Iowa, 2010:
- Worth, 64% Rep / 33% Dem
- Howard, 64% Rep / 34% Dem
- Winneshiek, 64% Rep / 34% Dem
- Jasper, 64% Rep / 34% Dem
Kansas
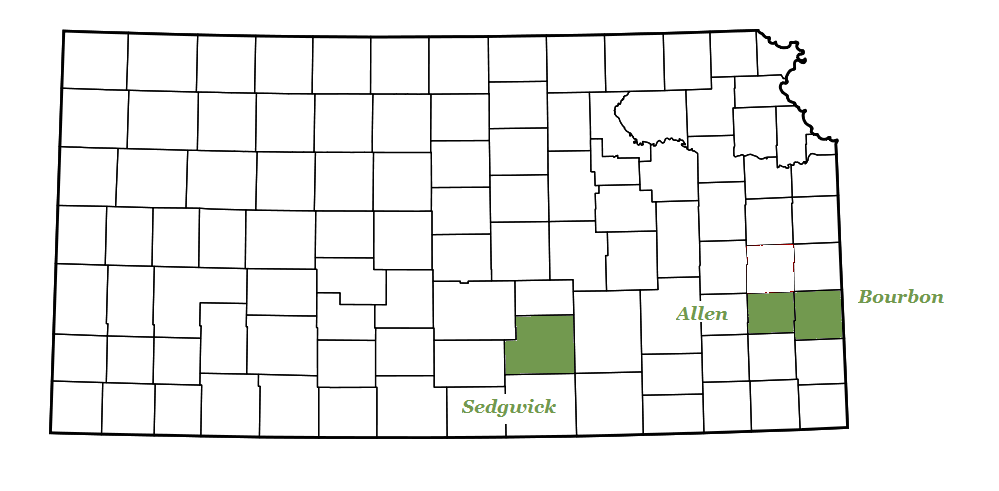
In 2010, Kansans voted overwhelmingly for the Republican Jerry Moran over Democrat Lisa Johnston for the seat left open by Sam Brownback while he made his successful bid for the governorship. Moran won 70% to 26%, which was matched by Bourbon County in the far eastern portion of the state. Bourbon’s neighbor Allen County was also close to the statewide result, splitting its vote 70% to 25%. Sedgwick County (70% to 27%) is also worth watching.
Kansas, 2010:
- Bourbon, 70% Rep / 26% Dem
- Allen, 70% Rep / 25% Dem
- Sedgwick, 70% Rep / 27% Dem
Louisiana
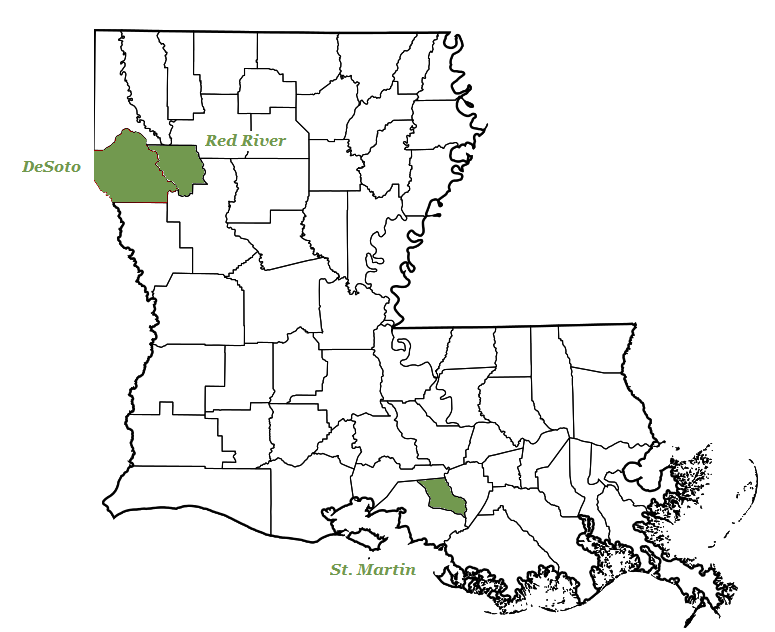
In Louisiana’s 2010 senate election, the incumbent Republican easily defeated a Democratic challenger. David Vitter was reelected over Charlie Melancon by 57% to 38%. Both DeSoto Parish in the northwest and St. Martin Parish in the south matched this result exactly. DeSoto’s neighbor, Red River County, returned a 56% to 38% split.
Louisiana, 2010:
- DeSoto, 57% Rep / 38% Dem
- St. Martin, 57% Rep / 38% Dem
- Red River, 56% Rep / 38% Dem
New Hampshire
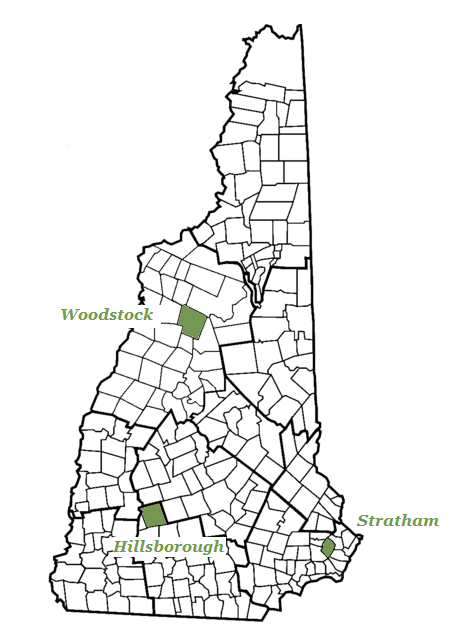
In New Hampshire, none of the county results matched the specific statewide result. However, at the town level there were better matches. In 2010, New Hampshire’s open senate seat went to Republican Kelly Ayotte with 60% of the vote against Democrat Paul Hodes with 37%. The town of Stratham located in the Southeast returned a precise 60% to 37% split, as did the town of Hillsborough, while Woodstock voted for the Republican 61% to 37%.
New Hampshire, 2010:
- Stratham, 60% Rep / 37% Dem
- Hillsborough, 60% Rep / 37% Dem
- Woodstock, 61% Rep / 37% Dem
North Carolina
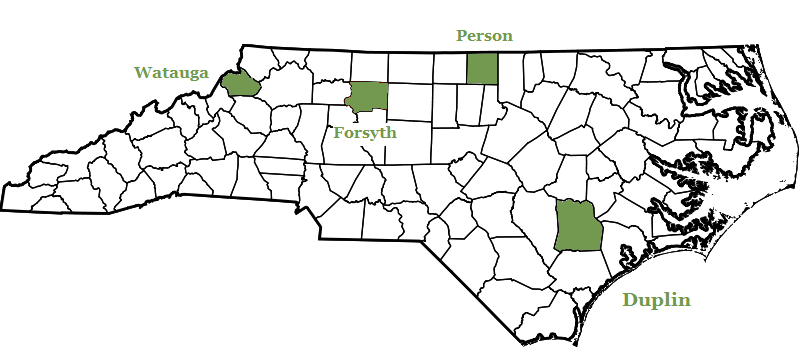
In North Carolina the Republican incumbent Richard Burr won 55% to 43% against Democrat Elaine Marshall. Both Forsyth and nearby Person counties matched the statewide spread exactly. Additionally, Duplin in the southeast voted 55% to 44% for Burr, as Watauga County by 55% to 42%.
North Carolina, 2010:
- Forsyth, 55% Rep / 43% Dem
- Person, 55% Rep / 43% Dem
- Duplin, 55% Rep / 44% Dem
- Watagua, 55% Rep / 42% Dem
Benjamin Huber contributed to this post.
The Brookings Institution is committed to quality, independence, and impact.
We are supported by a diverse array of funders. In line with our values and policies, each Brookings publication represents the sole views of its author(s).



Commentary
How to Watch the Election Returns Like a Pro
November 3, 2014