Because the U.S. government is running substantial budget deficits, the U.S. Treasury is borrowing heavily at its regular auctions of Treasury bills, notes, and bonds—nearly $1 trillion of additional net issuance in the first six months of calendar year 2024 alone.
The U.S. government’s growing appetite for borrowing—and occasional hiccups in the $27 trillion market for Treasury debt—prompt occasional concerns that investors may someday balk at lending to the U.S. government. Some market participants speculate about the possibility of a “failed auction” or a “financial crisis” of some sort.
Of course, the primary measure of the interaction between the supply of Treasury debt and investors’ demand for it is the interest rate (or yield) that the Treasury pays to borrow at those auctions. The more demand—that is, the more eager investors are to lend to the U.S. government—the lower the interest rate the Treasury must pay, and the lower the cost of financing large budget deficits. Interest rates on Treasuries have increased sharply over the past couple of years, reflecting not only the prospect of big deficits in coming years but also monetary policy and economic conditions.
Still, bond market participants believe that other metrics may offer early warning of impending problems in the Treasury market. They often describe an auction as “weak” when these measures fall short of market expectations. This post explains the metrics they track.
Bid-to-cover
The bid-to-cover ratio is the total amount of bids divided by the total amount of Treasury debt offered for sale—that is, the total sum the Treasury is borrowing in a given auction. On February 7, 2024, for instance, the Treasury borrowed $42 billion by selling 10-year Treasury notes. Bids totaled $107 billion, making the bid-to-cover ratio 2.51, about the median bid-to-cover on 10-year note auctions since 2013.
If the bid-to-cover ratio is lower than usual, that suggests that that many investors expect the final auction yield to be lower than they’re willing to accept. Bond market analysts and financial wire services often deem demand for Treasury debt to be “weak” when the bid-to-cover ratio is lower than average, as Reuters did when the bid-to-cover ratio in a May 2024 auction of two-year Treasury notes fell to 2.41 from 2.66 the prior month. But, in general, there is little indication from recent bid-to-cover ratios that demand for Treasury debt is waning. (The Treasury posts historical data on this and other metrics here.)
As the chart below illustrates, the bid-to-cover ratio on 10-year Treasury notes hasn’t moved very much in the past several years.
When-issued yield vs. auction yield
Trading in a new Treasury security begins on a “when-issued” basis as soon as an auction is announced but before the auction is held. “Such trading,” the New York Fed has written, “promotes price discovery, which may reduce uncertainty at auction, potentially lowering government borrowing costs.” Analysts compare the yield in when-issued trading with the yield set in the auction. If the auction yield is higher, the auction is said to have “tailed,” and that is seen as indicating that demand was weaker than anticipated. If the auction yield is lower, the auction is said to have “traded through,” indicating that demand was stronger than expected. At the Feb. 7 auction, for instance, the yield was 4.093%, below the when-issued yield of 4.105% just before the 1 p.m. bidding deadline. Demand was stronger than traders had anticipated. The difference between when-issued and auction yield is watched particularly closely by traders and investment funds with short-term arbitrage strategies.
In the chart below, a reading above zero indicates that the auction yield was higher than the yield in when-issued trading and a reading below zero indicates the opposite. This metric, even when calculated as a six-month moving average, is more volatile—more so when interest rates are climbing.
Who is buying?
Investors and bond traders monitor who is bidding for Treasury debt.
Immediately after each auction, the Treasury discloses what fraction of successful bids were from primary dealers. These two dozen investment firms, designated by the Federal Reserve Bank of New York, are expected to bid in all Treasury auctions at reasonably competitive prices on a pro rata basis; that is, if there are 25 primary dealers, each is supposed to bid for at least 4% of each auction. In a sense, they are the bidders of last resort. If primary dealers take an unusually large share of an action, that’s seen as sign of weaker demand from others than market makers anticipated. At the February 7 auction, 13% went to primary dealers.
Could an auction really fail? In the simplest terms, a failed auction would be one in which the Treasury doesn’t have enough bidders to take all the debt it is trying to sell—a bid-to-cover ratio less than one—at any yield. That’s almost impossible because primary dealers are obligated to bid.
Traders do take notice when, occasionally, primary dealers take an unusually large share of the debt because other investors demand higher yields than the dealers offer. In November 2023, for instance, investors displayed some reluctance in bidding for $24 billion in 30-year bonds. The final yield was 4.769%, some 0.051 percentage points above the yield in when-issued trading. And primary dealers took 24.7% of the debt, double the 12% average for the previous year. This unusual circumstance was attributed to a ransomware hack on a U.S. subsidiary of Industrial and Commercial Bank of China that disrupted some market participants’ ability to trade. Over the past several years, primary dealers have taken a smaller share of each auction, as this chart illustrates.
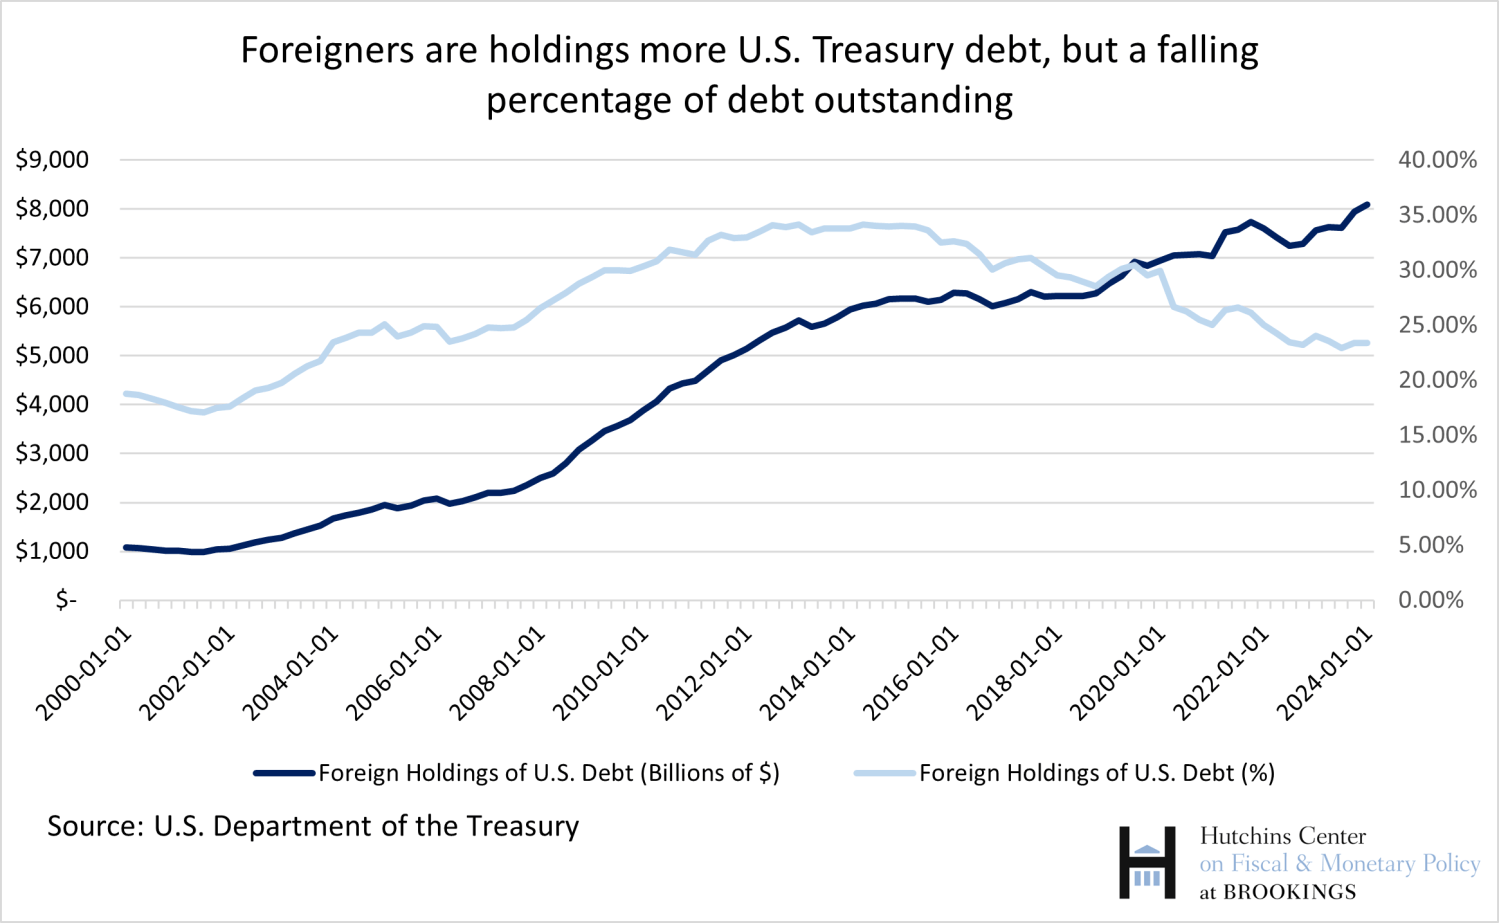
Bond market analysts also track the share of bonds that go to foreign central banks, reasoning that these banks care less about the yield they get when they buy U.S. Treasury debt. They buy Treasury debt for reasons other than the return on their investment. They may, for instance, buy and sell Treasuries in connection with the buying and selling of U.S. dollars to influence the foreign exchange value of their currencies.
In contrast, hedge funds, pension funds, life insurance companies, and individual investors do care about the yield they get—the higher the better. Because the marginal buyer sets the price, when the Fed and foreign central banks cut back on purchases of Treasury debt, Treasury relies on other, more interest-rate-sensitive investors, likely raising the interest rate it will have to pay on Treasuries.
Tracking foreign participation at any one auction is difficult. As the chart below illustrates, foreigners have been buying more debt in dollar terms, but their percentage share has been falling over the last decade as the U.S. has borrowed more.
Measures from the secondary market
Investors bid for newly issued U.S. Treasury debt at auctions knowing that they can sell them easily to other investors in the secondary market. The U.S. Treasury market is considered the most liquid market in the world, meaning there are always lots of potential buyers and potential sellers, transactions costs are low, and no single trade—even a very big one—moves the price by more than a small amount.
In the past few years, there have been a few disruptions to the Treasury market—unusual volatility or a sudden spike in yields—that suggest that at times of stress, the market may not be as liquid as it once was. In March 2020, at the onset of the pandemic, so many institutional investors wanted to raise cash by selling Treasuries that the Fed bought $1 trillion in Treasuries over three weeks “to restore normal market functioning.”
Such episodes underscore that the stock of U.S. Treasuries outstanding is growing faster, while the capacity of banks and dealers to serve as middlemen has been shrinking—in part because of regulations imposed after the Global Financial Crisis that have made that business less profitable. “Episodes of illiquidity and elevated yield volatility would adversely impact the prices of Treasuries—not a good outcome for U.S. taxpayers,” Stanford economist Darrell Duffie has written.
Wall Street analysts have several ways to gauge the health of the secondary market. A widely cited one is market depth—the quantity of Treasury securities that market participants are willing to buy or sell at particular prices. As the chart below illustrates, J.P. Morgan’s market-depth measure (which reflects the size of bids and offers in the market for U.S. Treasuries at various maturities between 8:30 a.m., when economic data is often released, and 10:30 a.m., when European markets close) plunged in March 2020. It has risen in the past couple of years, but remains significantly below pre-COVID levels in part because of uncertainty about Fed policy and regulatory impediments that have kept intermediaries from growing as fast as the growth in the size of the Treasury market.
The Treasury and the Fed have been taking steps “to improve the resilience of Treasury market liquidity in stress periods,” which Nellie Liang, the undersecretary of the Treasury for domestic finance, outlined in a June 2024 speech to an inter-agency working group on the U.S. Treasury market.
Author

Related Content
-
Acknowledgements and disclosures
The Brookings Institution is financed through the support of a diverse array of foundations, corporations, governments, individuals, as well as an endowment. A list of donors can be found in our annual reports published online here. The findings, interpretations, and conclusions in this report are solely those of its author(s) and are not influenced by any donation.


Commentary
How to tell if the US Treasury is having trouble borrowing in the bond market
July 23, 2024