

The COVID-19 pandemic’s sudden onset in 2020 and its persistent impacts in ensuing years posed new challenges for large U.S. cities and metropolitan areas.
Some of the initial challenges were related to the specific nature of the coronavirus and public health responses. In March 2020, residents of cold, dense cities seemed at greater risk of contracting the airborne illness than those in more spread-out, temperate communities where people could spend time outside year-round.1 More persistent challenges are related to the rapid adoption of remote work technologies, which enable certain kinds of work to be done anywhere with a high-speed internet connection, and not necessarily in big-city downtowns dominated by what today are increasingly vacant office buildings.
In an increasingly hyper-polarized country, some of these dynamics intersected with partisan politics. Republican-led states such as Florida and Texas positioned themselves as refuges for movers seeking escape from “Covid lockdowns” in Democratic-led states. In response to these and other political factors, Elon Musk moved Tesla’s headquarters from Silicon Valley to Austin, Texas, and a prominent Chicago financier moved his hedge fund to Miami after his employees started working from a high-end hotel there during the height of the pandemic.
The housing market also played a role in fueling migration during this time. As more people worked from home, demand for homeownership rose, particularly for larger homes. For example, in San Diego County—which for many years had built little new housing—median home prices skyrocketed from $660,000 in January 2020 to $860,000 just two years later, according to Zillow. Prices also rose in more affordable, flexible markets, but much more modestly; in Houston over that same time, the median home price increased from $195,000 to $240,000.
My colleague William H. Frey was among the first to document significant migration away from big metro areas during the pandemic. His analysis of U.S. Census Bureau data showed accelerated domestic out-migration from large, coastal metro areas such as New York, Los Angeles, San Francisco, Boston, and Seattle between 2020 and 2021. Domestic in-migration, meanwhile, remained strong in Sun Belt metro areas such as Phoenix, Dallas, Tampa, Fla., San Antonio, and Raleigh, N.C. Frey’s subsequent analysis showed these trends moderated through 2022 and 2023 as the initial impacts of the pandemic subsided.
Even if they are temporary in some respects, these recent migration patterns could have lasting impacts. Richard Florida, for instance, points to the rise of “meta cities”—large U.S. metro areas distant from each other yet linked closely by the ties of remote work and Covid-era movers, such as New York and Miami (finance), the Bay Area and Austin (tech), and Los Angeles and Nashville, Tenn. (entertainment). The Economic Innovation Group chronicled a loss of high earners from major urban centers such as New York, San Francisco, and Washington, D.C. during the first two years of the pandemic. The home listing service Redfin, meanwhile, noted rising housing demand in affordable markets proximate to major metro areas (e.g., New Haven, Conn. outside New York; Richmond, Va. outside Washington, D.C.; Worcester, Mass. outside Boston), suggesting the growing prominence of hybrid (versus fully remote) work arrangements. How these dynamics play out could have significant implications for the economic and social health of cities, and for America’s urban hierarchy in the 21st century.
To better understand these dynamics, this report analyzes data from the Internal Revenue Service’s (IRS) Statistics of Income program on U.S. population migration at the county level. The data tracks individual income tax filers who changed addresses from one year to the next, and reports the number of tax filers moving between counties (a proxy for households), the number of personal exemptions among those filers (a proxy for individuals), and the total adjusted gross income reported on their returns (a proxy for household income). While the IRS migration data is only currently available through 2022 (versus 2023 in Census Bureau migration data), it has the advantages of tracking movements between specific counties and revealing something about the economic status of migrating households.2
This report uses the IRS county-level migration data to track movement before and after the pandemic’s onset among U.S. metropolitan areas, which are collections of counties that approximate regional economies and labor markets.3 The analysis assigns each county in the dataset to its corresponding metro area based on the latest Census Bureau metropolitan delineations.4 An important limitation of the IRS data is that it suppresses county-to-county flows of fewer than 20 tax filers to protect taxpayer privacy. In 2021-22, for instance, the data reflects a total of 7.6 million U.S. filers moving to metropolitan counties, with the source county indicated for 5.8 million of them. This means that the county-to-county data misses 1.8 million households (or 23% of all households) moving to metropolitan counties in 2021-22. Many of these households likely moved from small, non-metropolitan counties, but the flows among metro areas charted here inevitably miss moves occurring between smaller counties in metro areas of all sizes.
Despite this limitation, the IRS data is useful for answering basic questions about domestic migration and the possible impacts of the COVID-19 pandemic. Focusing on the nation’s metropolitan areas, this analysis specifically asks if and how the pandemic may have altered the:
- Overall level of migration within and among metro areas
- Key metropolitan origins and destinations of movers
- Economic character of movers, and/or their sending/receiving communities
In general, the analysis confirms that the pandemic made an impact on metropolitan migration patterns, but also finds that these changes did not significantly alter the demographic or economic trajectory of metro regions. The analysis concludes with thoughts on the implications of these patterns as the economy returns to a “new normal” in the pandemic’s aftermath.
Migration among the nation’s metro areas rose modestly following the onset of the pandemic
In the years prior to the onset of the COVID-19 pandemic in 2020, IRS data shows that a little over 5 million tax filers in U.S. metropolitan areas moved across county lines annually (Figure 1).5 And in these years, roughly 54% of migrating filers moved between metropolitan areas, while the remainder moved within the same metro area.
The volume of migration within and between metro areas began to rise as the pandemic set in. Between 2019 and 2020, total metro area tax filer migration climbed to 5.6 million, and again, 54% of those moves involved a change across metropolitan areas. The migration total grew to 5.8 million the following year (2020 to 2021) and declined slightly in 2021-22. Along the way, the share of migrating filers who changed metropolitan areas rose to 57%.
The onset of the pandemic also seems to have accelerated a pre-existing trend that saw more households move away from very large metro areas and toward midsized and smaller markets (Figure 2). Looking back to 2013 and 2014, the IRS data records a collective net movement of roughly 41,000 tax filers from metro areas with fewer than 1 million residents to metro areas with more than 1 million residents. By 2021-22, this dynamic had flipped, with nearly 114,000 tax filers moving from very large metro areas to smaller ones. This pattern steadily built over the eight-year period, and was evident in increased migration between very large metro areas and their midsized neighbors, such as Boston to Manchester, N.H.; Denver to Greely, Colo.; and the San Francisco Bay Area to Stockton, Calif. This suggests that for households in expensive major metropolitan areas, nearby smaller metro areas had enhanced appeal as both affordable markets and locations from which hybrid workers could still reach their offices two to three days per week (a dynamic explored further below).
The pandemic accelerated pre-existing patterns of migration away from some metro areas in the Northeast, Midwest, and coastal California, and toward the Sun Belt and nearby, more affordable markets
As Frey observed, the pandemic accelerated a trend that built through the late 2010s of domestic migration away from northern cities such as Boston, New York, Chicago, and Philadelphia as well as coastal California metro areas (Los Angeles, San Diego, San Francisco-San Jose), and toward Sun Belt destinations.
The IRS data reflects this pattern of increased domestic out-migration in 2019-20 and 2020-21—the peak years of the pandemic—from a set of very large metro areas. New York, Los Angeles, and San Francisco experienced the largest jumps in out-migration during these years (Figure 3). The New York metro area, for instance, had a net loss of about 75,000 filers in 2018-19; that loss doubled to 150,000 by 2020-21. Similarly, the Los Angeles metro area saw its net loss double from 41,000 to 82,000 filers over the same period. And the San Francisco metro area, which had experienced a net inflow of tax filers in the mid-2010s, registered a net outflow of 51,000 filers in 2020-21. In most of these “exporting” metro areas, however, the net loss of tax filers moderated in 2021-22.
Meanwhile, several Sun Belt metro areas—particularly in Florida and Texas—experienced increased household in-migration (Figure 4). Dallas, Houston, and Tampa registered particularly sharp gains, which not only occurred amid the peak pandemic period in 2019-20 and 2020-21, but also persisted through 2021-22. Other metro areas such as Charlotte, N.C., Jacksonville, Fla., and San Antonio saw a steady but smaller continuation of tax filer in-migration through this time. (The sharp out-migration from Greater Houston and in-migration to Dallas and other metro areas in 2016-17 likely reflect the pronounced impacts of Hurricane Harvey on Houston and other Gulf Coast communities in August 2017.)
These trends capture overall levels of metro area in-migration and out-migration visible in other data, such as that from the Census Bureau. More uniquely, the IRS data reveals the specific metropolitan origins and destinations behind these flows. To assess the initial impacts of the pandemic on metro-to-metro migration, this analysis compares aggregate net migration levels in the two years prior to the pandemic’s onset (2017-18 and 2018-19) to levels in the two years after the pandemic’s onset (2020-21 and 2021-22).
Among the 25 largest absolute changes in metro-to-metro migration across these two periods, the New York, Los Angeles, and San Francisco metro areas accounted for 19 (Table 1). The single largest change was between New York and Miami. In the two years prior to the pandemic, the New York metro area had a total net loss of 11,700 tax filers to the Miami metro area; in the two years after the pandemic’s onset, that loss more than doubled, to 26,900. The second-largest change was from Los Angeles to Riverside-San Bernardino, Calif., where the total net loss grew from 33,700 tax filers pre-pandemic to 45,900 after the pandemic’s onset.6
These two changes illustrate two types of increased metro-to-metro migration flows in the wake of the pandemic. The first type included long-distance moves, such as those from New York to Miami, which tended to build on long-standing migration patterns—in many cases toward metro areas with more affordable housing, temperate climates, and/or job opportunities. New York to Orlando and Tampa, Fla.; Los Angeles to Dallas and Houston; and San Francisco to Los Angeles and San Diego represent this type of increased flow. Each may also have reflected the new options some workers had to perform their existing jobs fully remotely from new locations.
The second type included moves to adjacent metro areas that typically offered greater affordability and the ability (as noted above) for workers to maintain hybrid in-office schedules at their existing jobs, albeit with a longer commute. Examples include New York to Bridgeport, Conn., Poughkeepsie, N.Y., and Philadelphia (whose New Jersey suburbs are adjacent to New York’s); Los Angeles to Riverside-San Bernardino and San Diego; and San Francisco to Sacramento, Calif. This increased mobility also occurred among a few other adjacent metro area pairs outside the largest exporter metro areas, including Miami to Port St. Lucie, Fla.; Boston to Providence, R.I.; Austin to San Antonio; and Washington, D.C. to Baltimore.
Aside from the major metro areas of New York, Los Angeles, and San Francisco, however, there were few truly seismic shifts in metro-to-metro migration between the pre-pandemic and post-pandemic-onset periods. And a couple of the significant shifts in Table 1 occurred among those major metro areas themselves (e.g., New York and Los Angeles both gained considerably more tax filers from San Francisco). Among the other major “exporter” regions depicted in Figure 3, Chicago lost more tax filers to Texas and Florida metro areas, and Boston to other nearby metro areas (Cape Cod, Manchester, N.H., and Worcester, Mass.) in the latter period.
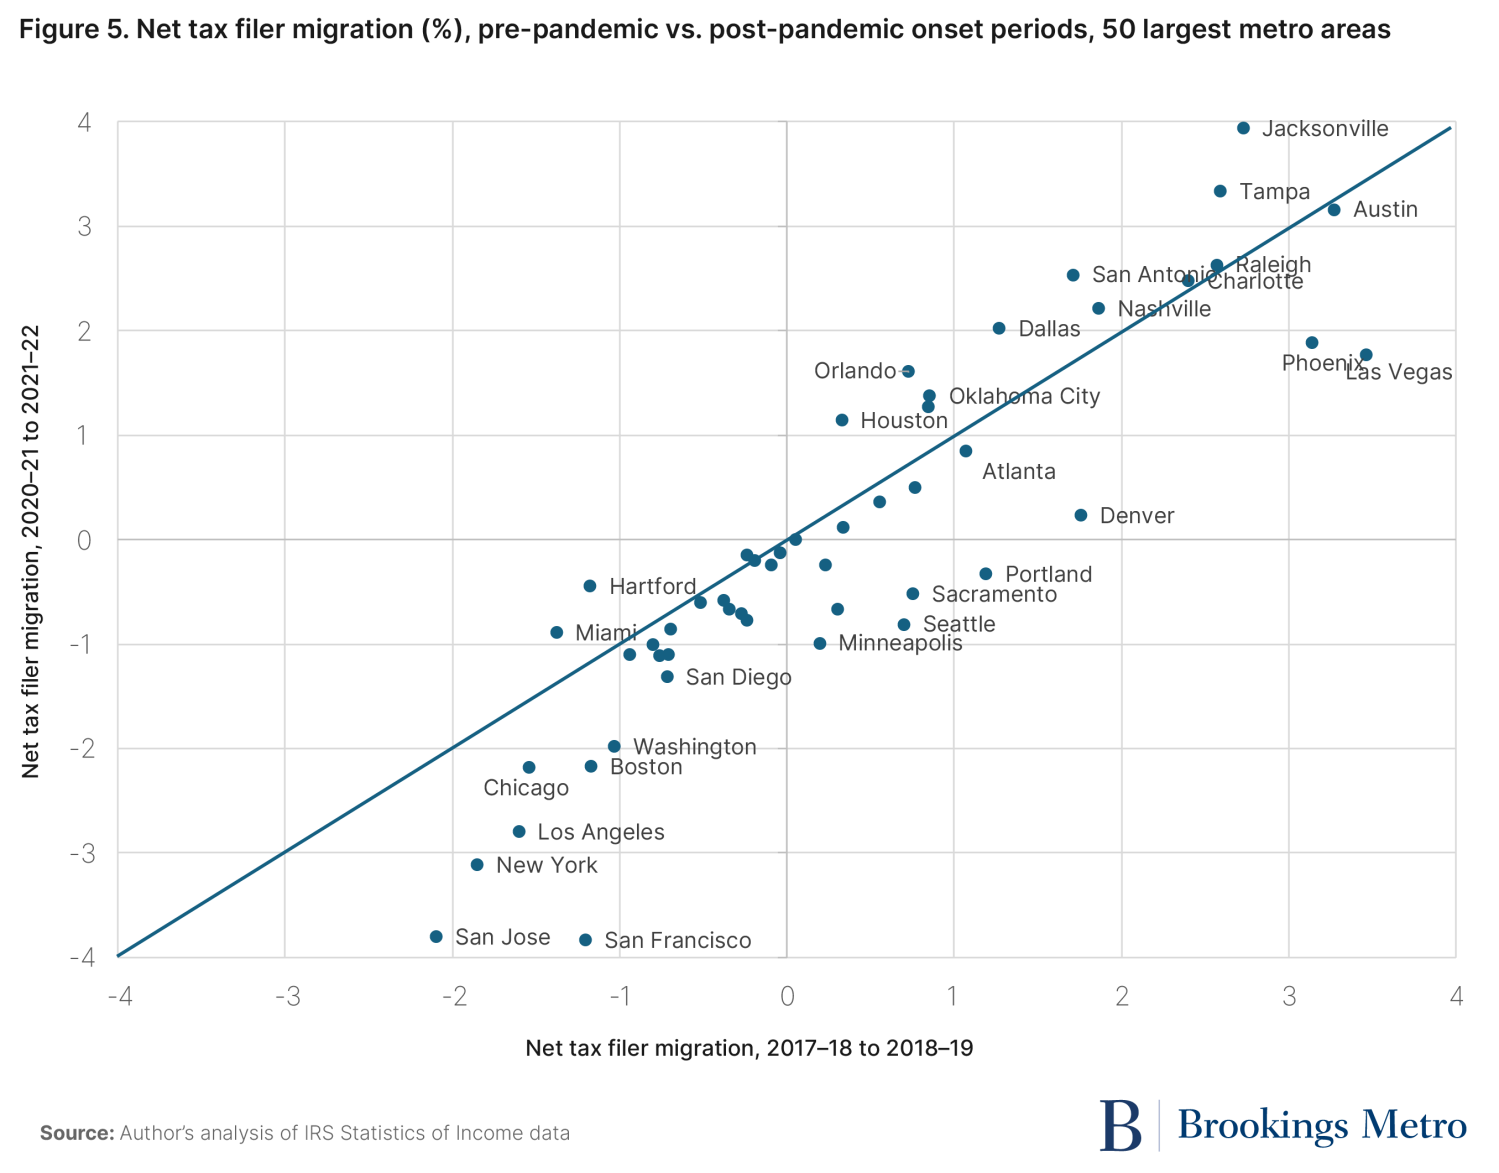
Still, when viewed against the backdrop of the overall size of major metropolitan regions, most metro-to-metro migration flows and changes in those flows remained modest. Figure 5 shows rates of net tax filer migration—that is, filers moving as a percentage of total filers in each jurisdiction—for the 50 largest metro areas in the pre-pandemic and post-pandemic-onset periods. Three aspects of the scatterplot pattern stand out. First, most metro areas are below the 45-degree line representing equivalent net migration rates in each period, indicating that losses were greater, or gains smaller, in 2020-22 than in 2017-19. Second, about half of the metro areas are clustered in the very middle of the chart, where gains or losses of households in either period resulted in less than a 1% change in total households (over a two-year span). And third, most of the metro areas hew close to the 45-degree line. New York, Los Angeles, and the San Francisco Bay Area do show significant increases in net out-migration between the two periods, while Denver, Las Vegas, and Phoenix show similar decreases in net in-migration. Yet in most major metro areas, net migration rates that prevailed before the pandemic continued relatively unchanged after its onset.
Metro areas losing tax filers also shed considerable income associated with those filers, but most continued to report rising total income in the recovery from the pandemic recession
Beyond adding or subtracting population, migration can alter the economic character of places, depending on the talents and resources of the movers themselves. In general, households who make long-distance moves tend to do so for job reasons, versus the household and family factors that tend to drive local moves. This means that long-distance movers often make more money; the IRS data shows that in 2021-22, tax filers who moved across state lines reported an average adjusted gross income of $100,000, compared to $76,000 for those who made local, within-state moves. That noted, because younger people tend to move more often and across farther distances, movers typically have somewhat lower incomes than non-movers, who on average are further along in their working lives and have greater earning power.
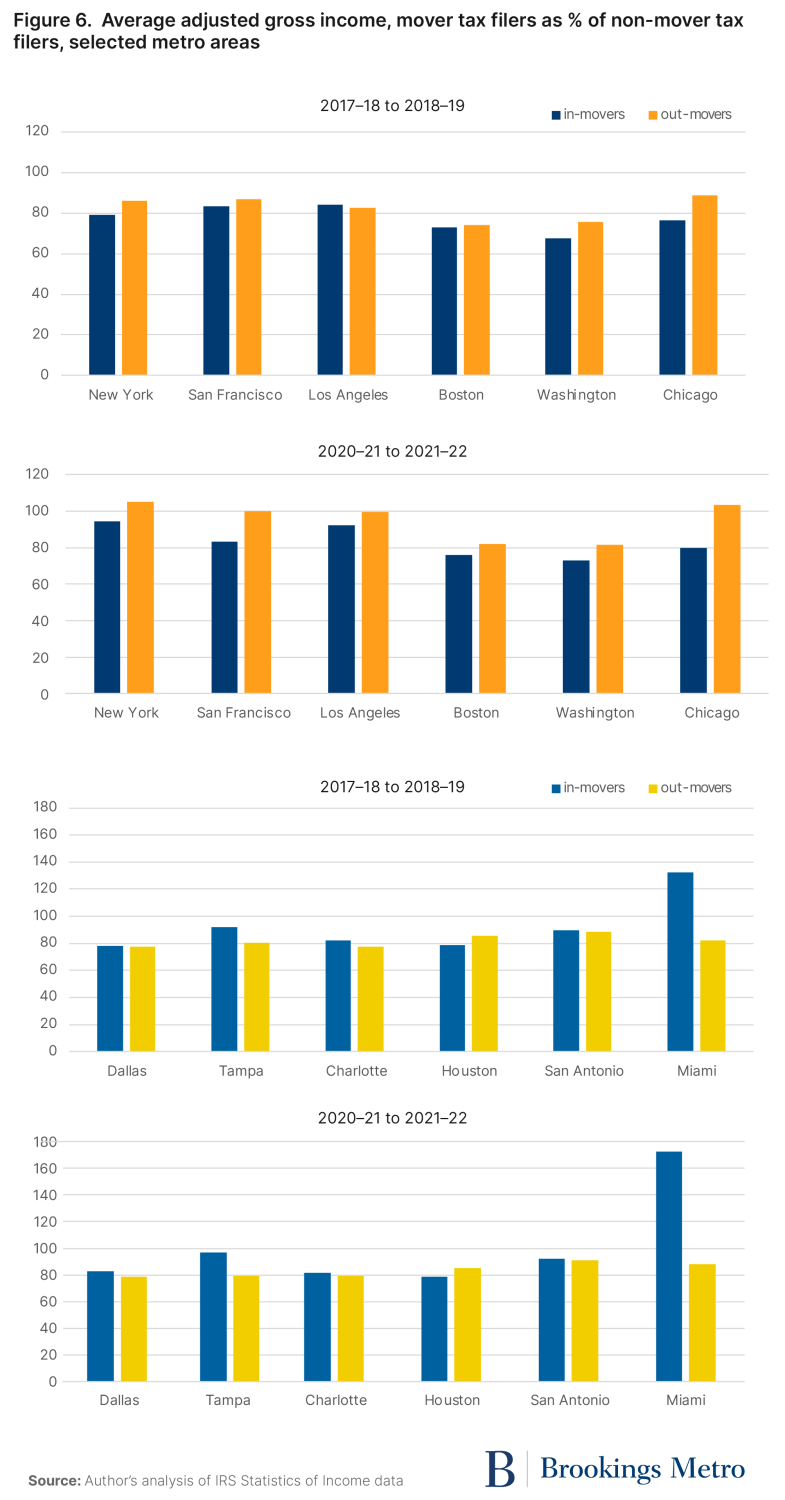
As households move among metro areas, the difference between the incomes of arriving and departing households offers one indication as to their potential impact on local economies. Across six major “export” and “import” metro areas, Figure 6 depicts the average adjusted gross incomes of mover households as a percentage of non-mover households before and after the pandemic’s onset. Three patterns stand out. First, in nearly all metro areas in each period, mover incomes are below “stayer” incomes (i.e., less than 100%). This means, somewhat paradoxically, that greater out-migration may actually raise regional income on a per-household basis, at least in the short run. Second, the pandemic’s onset seems to have induced relatively greater out-migration of higher-income households from exporter regions, especially San Francisco and Chicago. Relative incomes of mover households also rose in New York, Los Angeles, Boston, and Washington, D.C., but did so among both those moving in and out of those regions. And third, little changed about the income profile of movers in the importer regions, except for Miami. A number of very high-income households seem to have moved from New York to Miami after the pandemic’s onset, producing a spike in the average income of in-movers, from 132% of non-mover incomes in 2017-18 and 2018-19 to 173% of non-mover incomes in 2020-21 to 2021-22.
As with mover households themselves, the potential economic impact of these income flows is clearer when benchmarked against the total income of the regions sending and receiving those flows. In that respect, Figure 7 shows an analogous pattern to that of Figure 5, this time focused on changes in total adjusted gross income (AGI) at the metropolitan level attributable to net migration of tax filers. As before, about half of metro areas bunch in the middle, having experienced AGI gains or losses below 2% of total metro area income both before and after the pandemic’s onset. Several of the same large coastal metro areas experienced significant outflows of income in the latter period (up to 7% in the San Francisco Bay Area), more so than before. And some of the same Sun Belt metro areas saw equivalent income gains from migration, although those gains more closely mirrored trends before the pandemic.
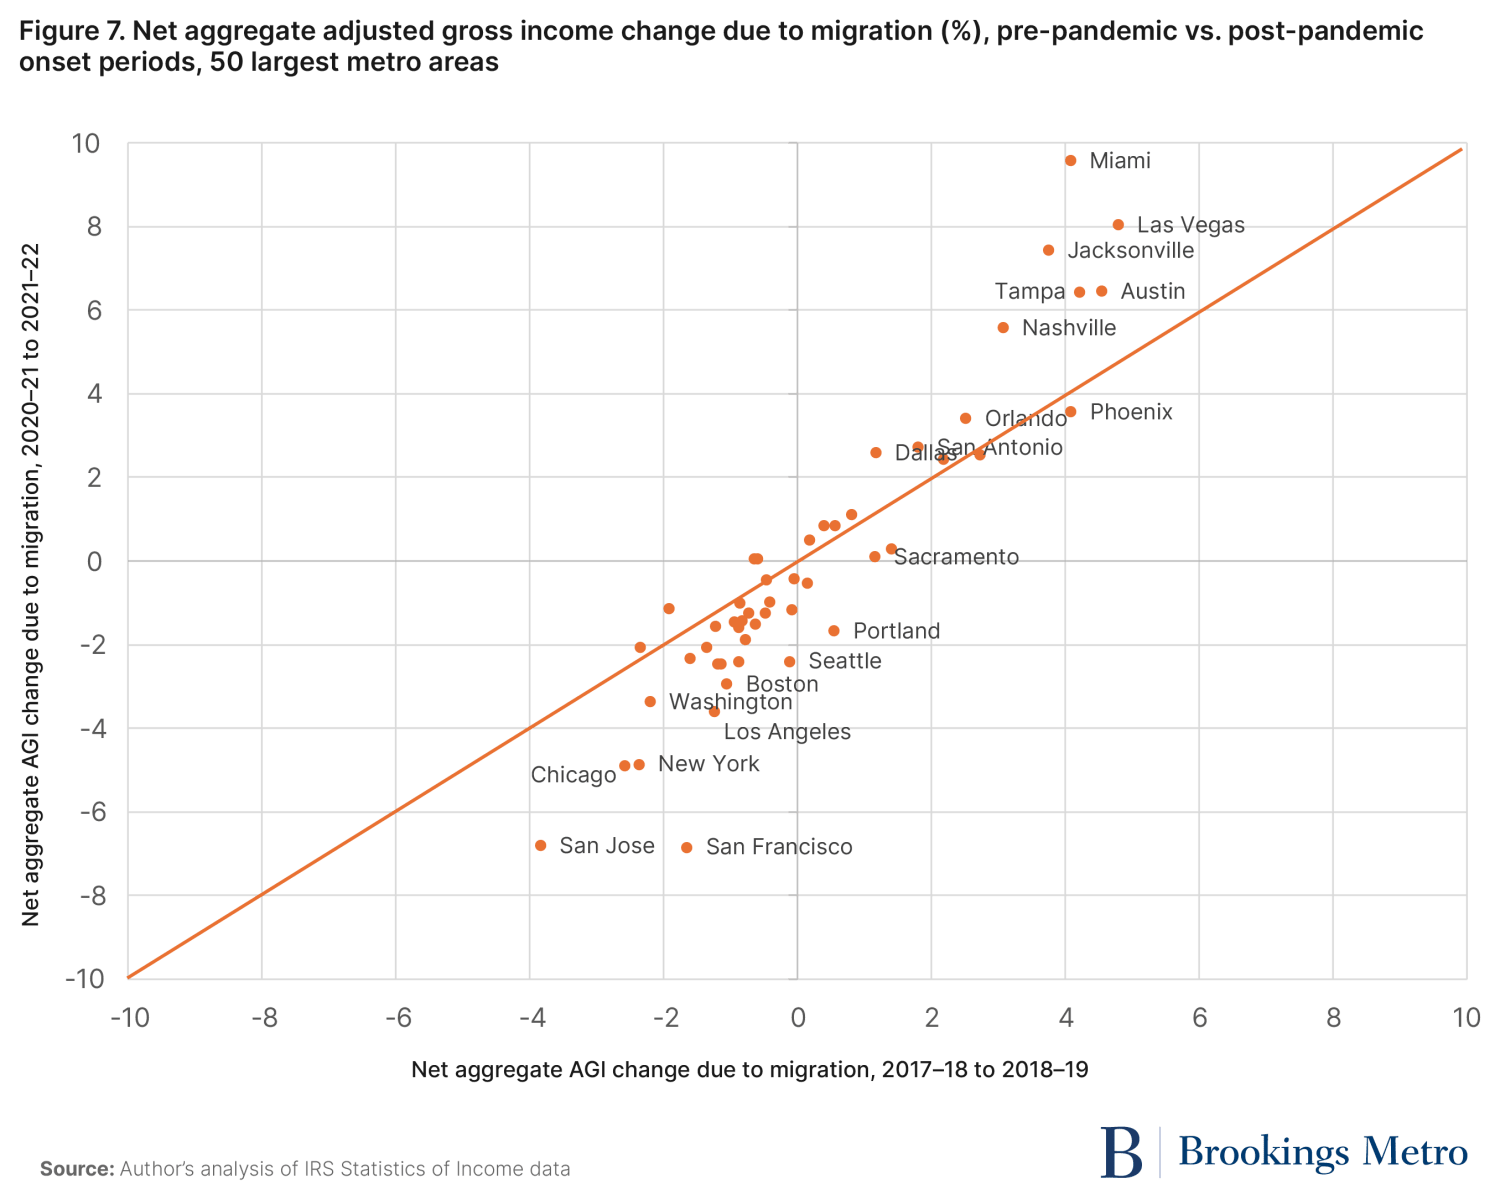
How should we interpret these income changes? On one hand, a metropolitan area shedding 5% to 7% of its total income in just two years’ time is significant from an overall economic perspective, and as a fiscal matter for affected towns, cities, and states. On the other hand, those losses did not forestall continued income growth in these metro areas. For example, the New York metro area registered a net aggregate loss of $46 billion in AGI due to migration in 2020-21 and 2021-22. Yet in 2022, the metro area’s total AGI among “non-movers” was $125 billion higher than in 2020. Similarly, the San Francisco region lost a combined $24 billion in AGI to migration over this period, but reported a coincident increase in non-mover AGI of $86 billion.7 Even major metro areas such as Boston, Chicago, Los Angeles, and Washington, D.C. that were exporting tax filers well before the pandemic appeared to experience strong income growth in its wake.
Policy can help communities respond to current and future migration trends
As a demographic matter, Americans tend to pay a lot of attention to migration. It’s part of our national identity: “Manifest Destiny” spurred settlement all the way to the Pacific Coast (as well as the displacement of millions of Indigenous Americans). Migration speaks to the idea that we “vote with our feet” in a large, diverse economy and federated system of government. And it represents an important part of long-term growth—a prominent metric of success in a nation whose population has expanded in every decade since its founding.
Yet as a mathematical matter, migration does not often significantly alter underlying population and economic dynamics, at least in the short run. In most regions, more population change is attributable to natural increase (the excess of births over deaths) and immigration from abroad than to domestic migration. The same goes for economic change; what happens to companies and workers already present in a region dictates much more about its economic future than firms or people moving in or out. Even as migration accelerated in the wake of COVID-19, there were few metro areas in which that movement significantly altered metropolitan population or income, or represented a huge break from pre-pandemic norms. Moreover, the data indicates that the increased volume of migration that prevailed at the height of the pandemic in 2020-21 had already subsided by 2021-22. Early-pandemic patterns that threatened doom for older, denser, and colder cities do not seem to have irrevocably altered U.S. migration patterns. (To wit, the Census Bureau reports that the city of Detroit’s population grew last year for the first time in decades.)
Still, the trends evident in this data highlight a few areas for continued scrutiny and policy focus as migration patterns further shape the U.S. metropolitan map in coming years:
- Improving housing affordability in the big exporter metro areas. The affordability “pull” that many Sun Belt metro areas exerted before and after the pandemic’s onset is equally an unaffordability “push” from the big coastal markets. New policies in California and Massachusetts, among other states, seek to overcome hyperlocal limitations on housing supply that have helped drive prices sky-high. State officials there will need to take implementation seriously and use their enforcement tools to ensure those policies succeed. Trends to date have been mixed: The Census Bureau reports that between 2019 and 2023, permitted housing units grew in the Boston and San Diego metro areas, stayed the same in the Los Angeles metro area, and dropped in the San Francisco and San Jose metro areas. The Harris-Walz campaign, meanwhile, has signaled its support for greater federal action to improve housing affordability, including steps to reduce regulatory barriers at the state and local levels.
- Developing big-metro-adjacent regions smartly. Because the housing affordability challenges in big exporter regions won’t resolve overnight, nearby midsized regions will likely remain attractive escape valves for households in a hybrid work economy. These regions (e.g., Worcester, Mass. outside Boston; Bridgeport, Conn. outside New York; Richmond, Va. and Baltimore outside Washington, D.C.; Riverside, Calif. outside Los Angeles and San Diego) are typically characterized by the presence of cities and first suburbs with considerable capacity for increased population and local economic activity. State and local policies should seek to accommodate growth in these older communities rather than subsidize resource-intensive, distended “greenfield” growth that reproduces the challenges of late 20th century metropolitan development. Massachusetts’ Housing Development Incentive Program, for instance, promotes the development of market rate housing in the Commonwealth’s Gateway Cities. The Virginia Passenger Rail Authority, for its part, secured federal support and is investing additional state monies to increase passenger rail frequency between downtown Richmond and Washington, D.C.
- Better accounting for climate risk in housing and land use policies. In late 2022, Freddie Mac economists observed that increased migration during the pandemic resulted in more people living in neighborhoods and regions with high climate-change-induced risks of wildfire, drought, and hurricanes. Moves to the Sun Belt and regions in the interior West that help households save on housing costs in the short term may expose them and U.S. taxpayers to higher costs in the long term from the property damage those disasters inflict. My Brookings colleagues Julia Gill and Jenny Schuetz have recommended a range of tools that policymakers at all levels might use to reduce Americans’ collective exposure to climate risk, from providing better information on climate risks to more tightly regulating development in high-risk areas. Notably, before the pandemic, Americans already seemed to have been shifting their migration away from the hottest locations, according to new research from the Federal Reserve Bank of San Francisco. More recently, Redfin reported that in California, more people left than moved into California’s high-fire-risk areas in 2023.
This analysis of metropolitan migration during the pandemic suggests neither cause for alarm nor reason to shrug off the potential impacts of newer movements. Rather, it points to underlying metropolitan challenges and opportunities these recent trends re-reveal, and imperatives to address them as U.S. cities and regions find their new normal.
-
Acknowledgements and disclosures
The author thanks William H. Frey for comments and Hannah Stephens for fact-checking on this report.
-
Footnotes
- Eventually, for a range of complex reasons, poverty had a much stronger relationship with Covid-related death rates at the state level than wintertime temperature or population density.
- Note that this data does not, for the most part, reflect the impacts of international migration (immigration or emigration) on metropolitan populations.
- The analysis refers to these periods as “pre-pandemic” (before 2019-20), and “post-pandemic onset” (2019-20 through 2021-22), with the latter recognizing that the term “post-pandemic” obscures the fact that the COVID-19 virus remains an important public health risk today.
- The analysis assigns counties to their corresponding metro areas according to the Census Bureau’s 2023 metro delineations, with the exception of those in Connecticut. In 2023, the state of Connecticut and federal agencies transitioned away from using counties, which have few administrative functions in New England states, to using planning regions composed of cities and towns. The IRS migration files report data for Connecticut based on these planning regions in 2021-22, but based on counties in prior years. For those prior years, the analysis uses 2020 metro area delineations that assign Connecticut counties to metro areas. For 2021-22, the analysis collapses the Naugatuck Valley Planning Region (which coincides with the Waterbury-Shelton, Conn. metro area) into the previous New Haven-Milford, Conn. metro area, which included 12 of the 19 cities and towns in the region.
- Researchers have described as problematic large fluctuations in total migration evident in the IRS data in 2014-15 and 2016-17. Because of this, most of the analysis in this report focuses on changes in migration occurring in 2017-18 and subsequent years.
- Note that two metro-to-metro flows that Richard Florida describes in “The Rise of the Meta City” register slightly below the top 25 changes: San Francisco to Austin (1,964 more tax filers post-pandemic onset than pre-pandemic) and Los Angeles to Nashville (2,367 more tax filers post-pandemic onset than pre-pandemic).
- The Tax Foundation reports that AGI grew considerably in tax year 2021 (which aligns with 2021-22 migration data) due to increased capital gains realizations after a strong year of stock market performance. This dynamic presumably affected both non-mover and mover households.
The Brookings Institution is committed to quality, independence, and impact.
We are supported by a diverse array of funders. In line with our values and policies, each Brookings publication represents the sole views of its author(s).