Over the last 30 years, internet access has transitioned from a luxury that few could afford to a necessity that is relied upon by the masses, integral to their well-being and prosperity. Technological hardware has advanced in accordance with Moore’s Law, resulting in smaller, more powerful, and more affordable electronic devices. However, too many are still left out—not because of the costs of a phone, but because of the cost of internet services. The variation in the affordability of internet access is the focus of the latest Internet Poverty Index (IPI) 2023, which projects the distribution of individuals who are priced out of a basic package of mobile internet and are thus living in internet poverty.
The IPI is based on three pillars: quality, quantity, and affordability. For each country, a quality- and quantity-adjusted internet price is estimated for a standardized basket—1 GB per month at 10 Mbps. The prices are adjusted to reflect a consistent level of quality in order to facilitate cross-country comparisons. The country-level internet price is then compared against the spending power of individuals within that country, with those that would have to direct more than 10% of their aggregate daily expenditure towards the basket deemed internet poor. Based on the latest IPI data, World Data Lab predicts that 1.05 billion people are currently living in internet poverty.
Here are three key takeaways from the IPI 2023:
The number of people living in internet poverty has fallen throughout the past decade and that decline has continued over the last 12 months.
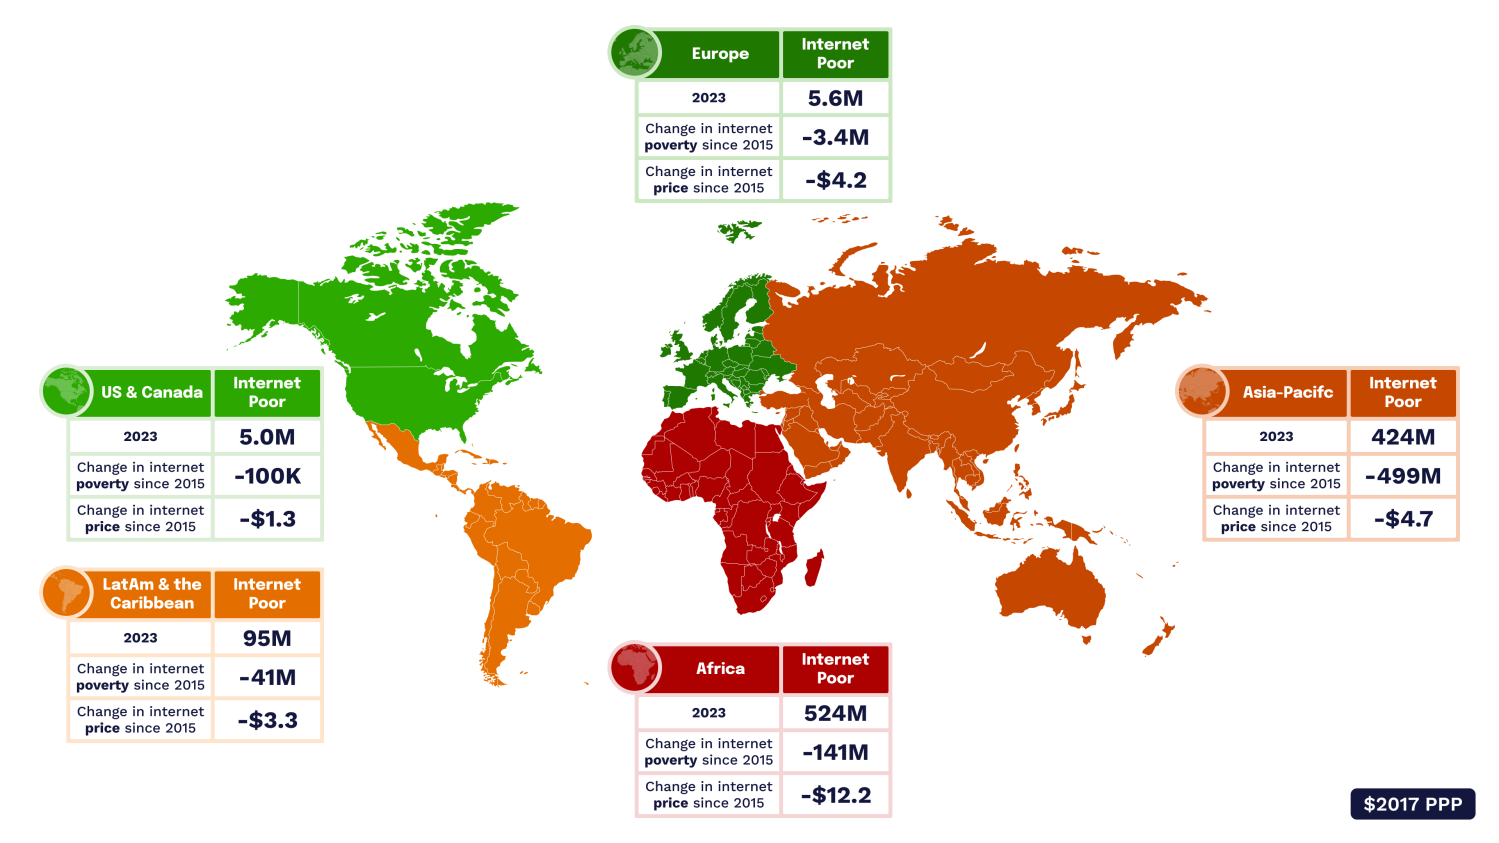
Since 2015, the internet-poor population has decreased by 685 million or around 40%. This reduction has taken place as the global population has grown by 535 million, meaning the percentage of people living in internet poverty has decreased from 24% in 2015 to 13% in 2023. Asia has performed most favorably during this period, experiencing a reduction of more than 50%—from 915 million in 2015 to 418 million in 2023 (Fig. 1). Africa has also seen an important reduction from 665 million to 524 million. Over the past year, 42 million people have moved out of internet poverty, slightly below the average of the previous five years.
Figure 1. Internet poverty and pricing from 2015-23
Source: Internet Poverty Index 2023 by World Data Lab
The reduction in internet poverty has been driven by a universal decline in prices.
The price of a standard basket of access has decreased in every continent since 2015, enabling more consumers to afford access (Fig. 1). Africa experienced the strongest reduction in prices: In 2015, Africa had the second most expensive internet prices in the world (after North America); now it is the cheapest. Despite the low prices, Africa remains home to the largest internet-poor population—524m—given that it has the highest rates of conventional poverty.
While prices have decreased globally, there’s variation across countries and regions.
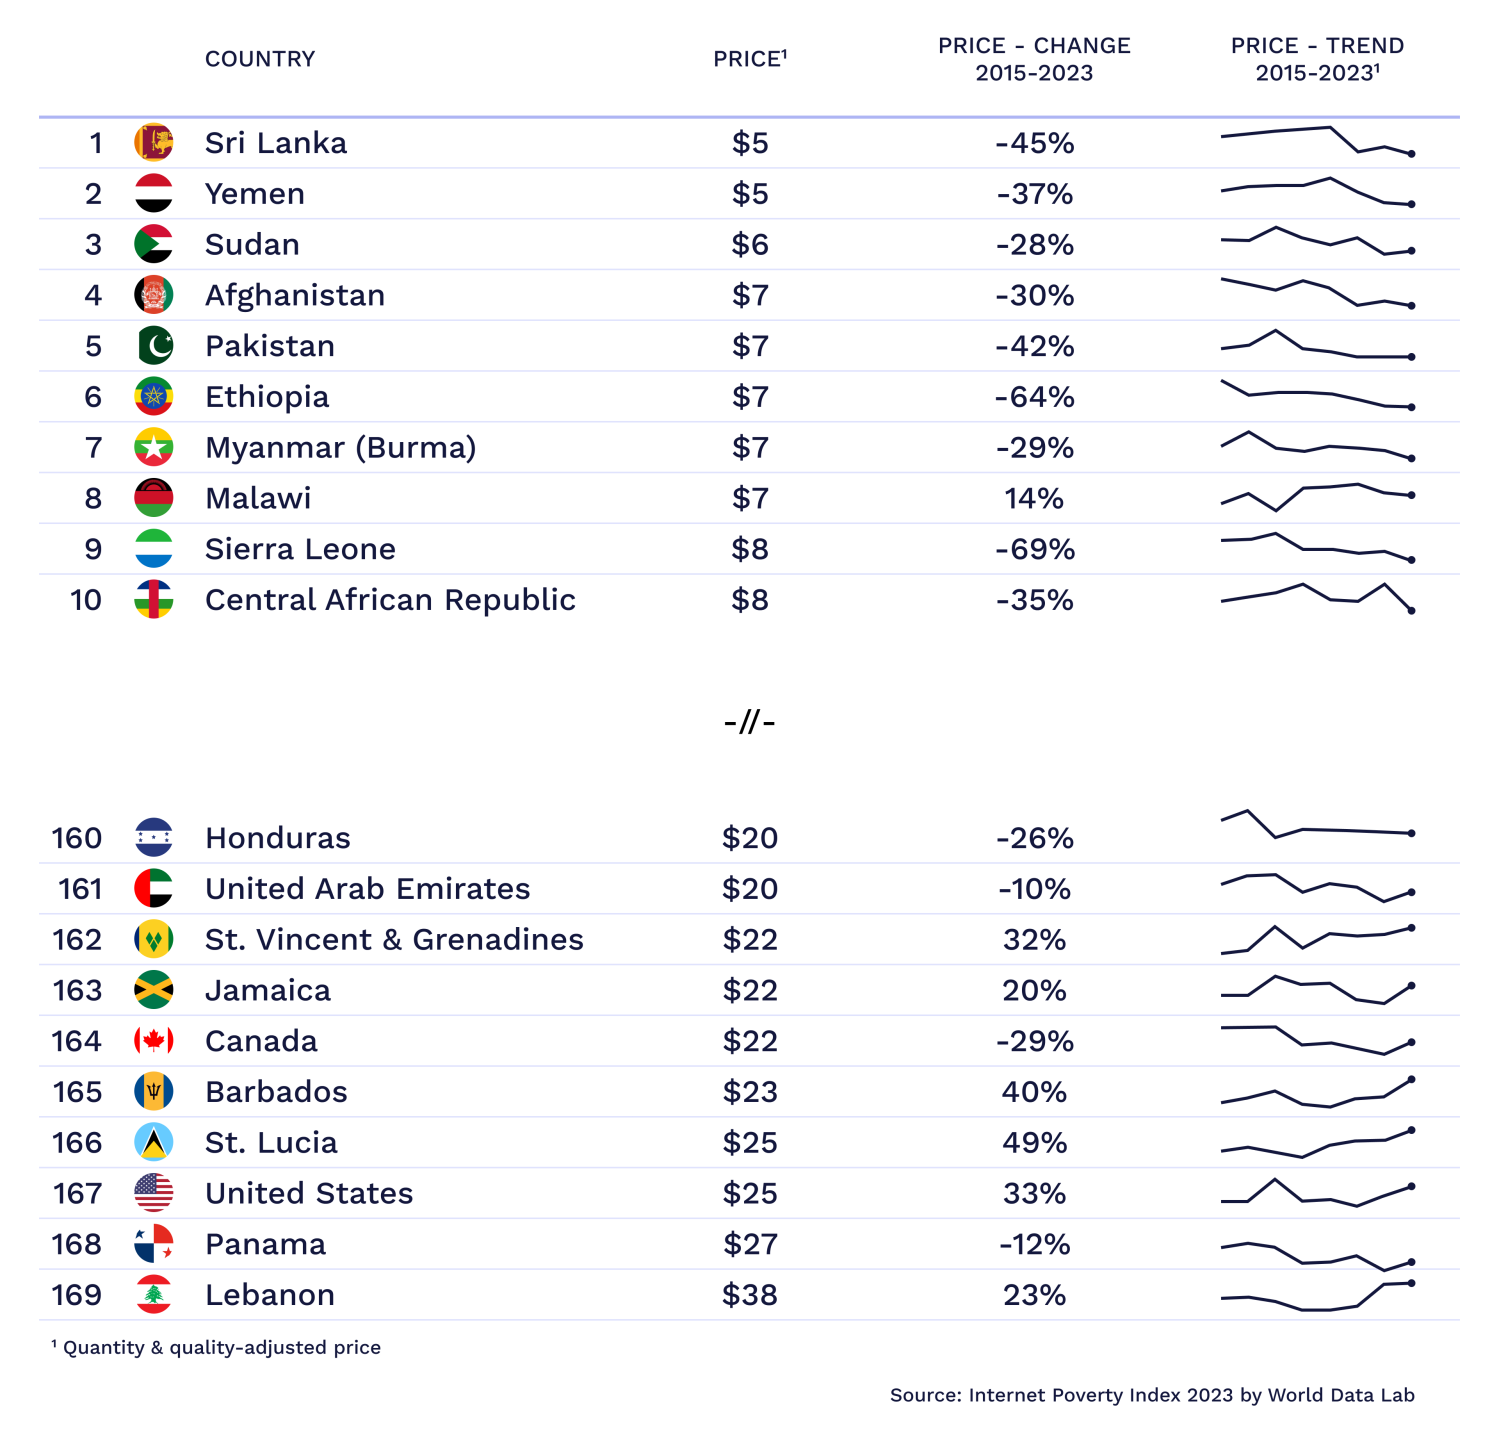
Since 2015, countries have experienced an average price reduction of 24%. However, certain geographic, demographic, and policy factors have led to divergent performances. In the Caribbean, prices have actually increased by 17% since 2015. The region’s challenging geographic environment, which makes it difficult to develop cost-effective infrastructure, coupled with the absence of competition within telecommunication markets have undermined progress. In contrast, many West African countries have experienced significant price reductions due to infrastructure developments, with Angola (90%) Guinea Bissau (75%), Gambia (72%), Sierra Leone (69%), and Cote D’Ivoire (59%) all benefitting from a recently laid submarine cable connecting them to Europe’s telecommunications network.
One factor that has a significant influence on pricing is the policies that govern the telecommunications market. Crucially, policies can be amended by stakeholders relatively swiftly and inexpensively, making them an area of focus when analyzing the drivers of prices. Data from the IPI indicates that promoting a competitive market environment can be an effective way to drive down internet prices and improve the quality on offer as new service providers entering the market may invest in infrastructure expansions and look to acquire customers by offering competitive prices. An example of this can be seen in Botswana, which has experienced a price reduction of 76% since 2015. This has been driven by a comprehensive range of policy initiatives aimed at “making markets work more efficiently by enhancing competition,” exemplified by the implementation of the National Broadband Strategy (2016) and the Universal Access and Service Fund (UASF) (2015).
Figure 2 shows the breakdown of the lowest and highest internet prices by country. One notable trend is that all of the countries with the lowest internet prices are themselves low or low-middle-income economies, whereas the majority of the countries with high prices are upper-middle or high-income countries. While this trend is relatively consistent across the global dataset, GDP per capita does not explain a significant amount of variation in prices as many poor countries have high prices, such as Lebanon ($38), Honduras ($20) and Eswatini ($19), and many rich countries have relatively low prices; examples include France ($11), Spain ($11) and New Zealand ($11).
Figure 2. Lowest and highest internet prices in 2023
 Over the last years, the world has made great progress to reduce internet poverty. While income poverty stagnated since COVID, internet poverty declined due to a near-universal decrease in internet prices. Additional price reductions will be crucial to achieving further progress, as low prices give poor people a chance to connect and proactively use the internet. One encouraging takeaway from the latest data is that monthly prices of below $7 for a basic package of internet have been achieved already in eight low-income countries, most of which face many other infrastructure constraints. If every country in the world had such a low price for a minimum package of internet services, internet poverty would decline by another 44%.
-
Acknowledgements and disclosures
The authors of this commentary are affiliated with World Data Lab, including its non-profit division. Data from the World Data Lab mentioned in this post are all publicly available to other researchers. As with all Brookings research publications, the opinions and views articulated in this commentary are exclusively those of the authors and do not reflect, nor are they endorsed by, the Brookings Institution.
The Brookings Institution is committed to quality, independence, and impact.
We are supported by a diverse array of funders. In line with our values and policies, each Brookings publication represents the sole views of its author(s).






Commentary
Ending internet poverty
October 11, 2023