Average inflation in 2022 reached 8%, the highest inflation rate since the early 1980s in the wake of the second oil shock. The COVID-19 inflation surge followed over two decades of low and stable inflation and—inevitably—raised the question whether pandemic-era stimulus was excessive, causing the economy to overheat. This blog post is our last in a three-part series that uses new data to disentangle supply versus demand in the COVID-19 inflation shock. We draw two conclusions. First, the vast majority of the COVID-19 inflation surge is accounted for by supply-linked factors, especially a rise in company margins that followed severe delivery delays at the height of the pandemic. Demand-linked factors, notably indicators of labor market overheating, play almost no role. As a result, the argument that policy stimulus was excessive is weak. Second, margins have yet to normalize from their elevated levels, which means there is more disinflation ahead as fallout from COVID-19 continues to unwind. The effects of supply chain disruptions on inflation are thus both more severe and longer lasting than existing studies of this episode have flagged. If this is true, it suggests that the Fed may have overtightened—as its hikes may have done little to slow inflation—and now needs to shift to cutting the policy rate in rapid fashion.
Supply versus demand in the COVID-19 inflation shock
The pandemic made social distancing necessary, requiring large parts of the economy to be shut down. As a result, the fall in economic activity was deeper and more abrupt than during the Great Recession, raising the possibility that lasting damage—in the form of persistent output gaps—could result. Policy stimulus was therefore aggressive and—given the subsequent rise in inflation—there is now understandable debate whether this was excessive. We examine this issue using new data on supply chain disruptions, most notably on how firms raised margins at the height of COVID-19. But before we turn to margins, it is worth noting that the case for overheating in the data is not strong. While GDP has largely recovered, it remains below its pre-COVID trend, a point against overheating (Figure 1). Moreover, while goods consumption rose sharply during COVID-19, services consumption suffered steep declines and is only now nearing its pre-COVID trend (Figure 2).
Figure 1. US real GDP
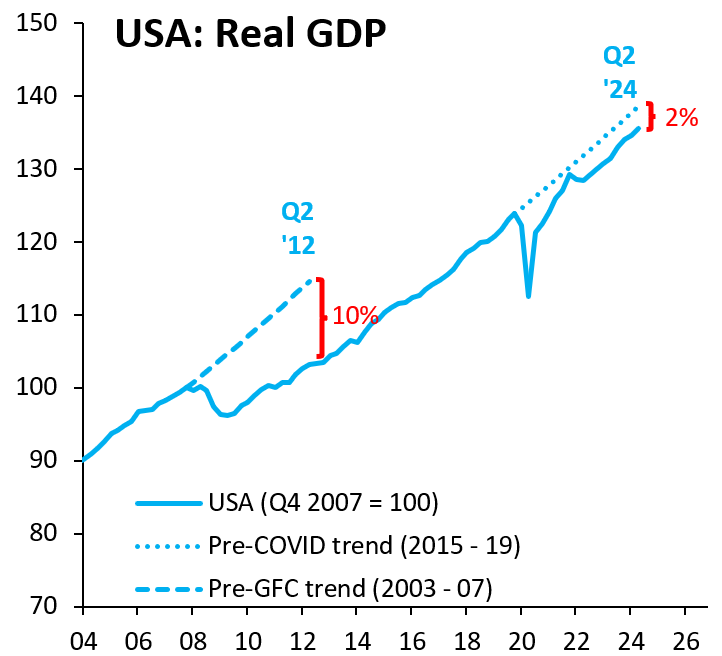
Source: Haver Analytics
Figure 2. Real personal consumption expenditures
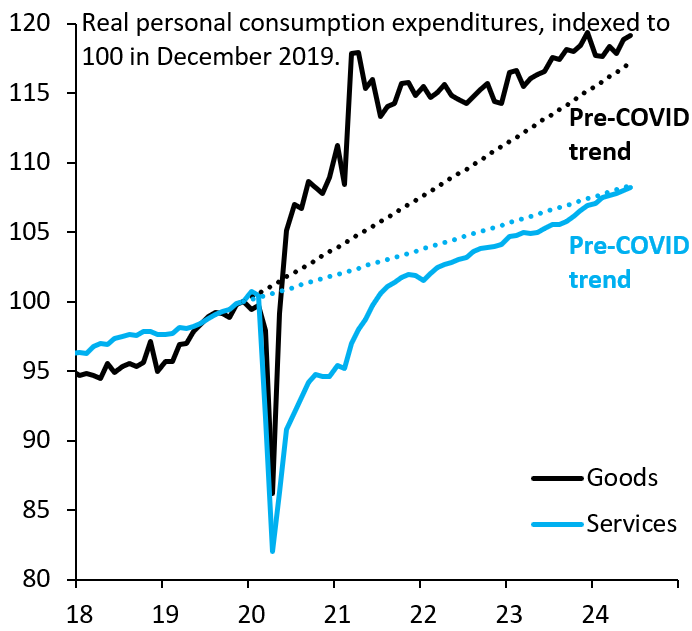
Source: Haver Analytics
We use data from S&P Global on purchasing manager indices (PMIs) for 45 economies. These are monthly balance of opinion surveys covering supplier delivery times, input prices (what firms pay suppliers) and output prices (what firms charge customers), as well as new orders and inventory levels. Our first post used these data to discuss the massive size of supply chain disruptions during COVID-19, which rivaled in magnitude what Japan saw after the Fukushima nuclear disaster in 2011, only that COVID-19 supply disruptions in the U.S. lasted far longer. Our second post examined firm margins, which rose sharply after the spike in delivery delays and have yet to normalize. We believe this rise in margins reflects increased efforts by companies to preserve inventory after the shock of bare shelves at the height of COVID-19, an explanation for margin-expansion that is distinct and perhaps more plausible than “greedflation.” This post looks at how much of the COVID-19 inflation shock can be attributed to supply chain disruptions, including via higher margins, and draws conclusions for the pace of disinflation going forward.
Figure 3. The supply shock: Company output and input prices
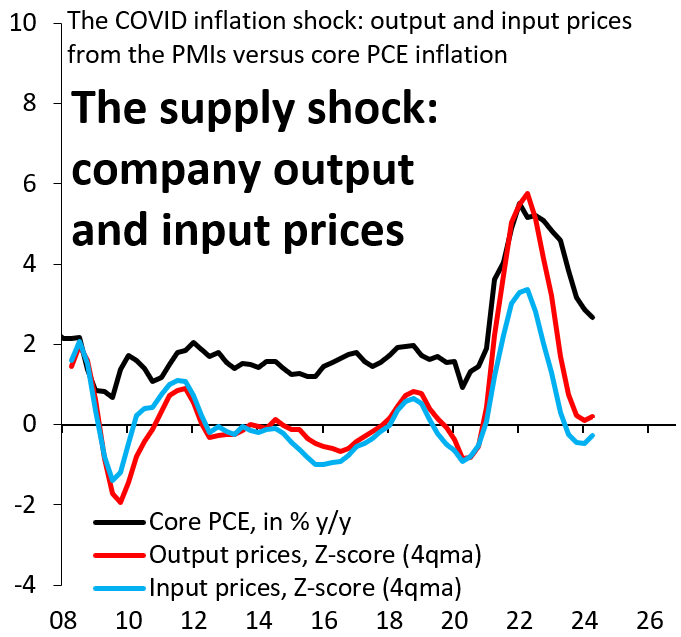
Source: Haver Analytics
Figure 4. The supply shock: Delivery times and company margins
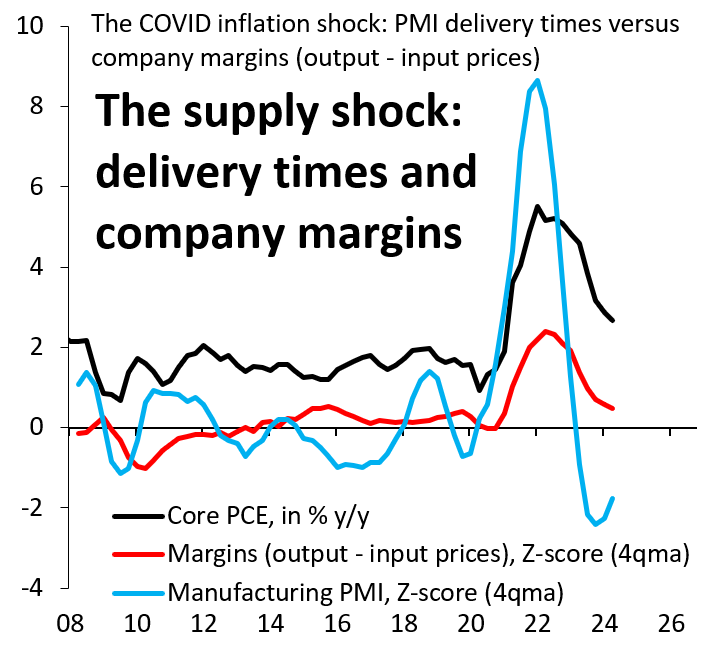
Source: Haver Analytics
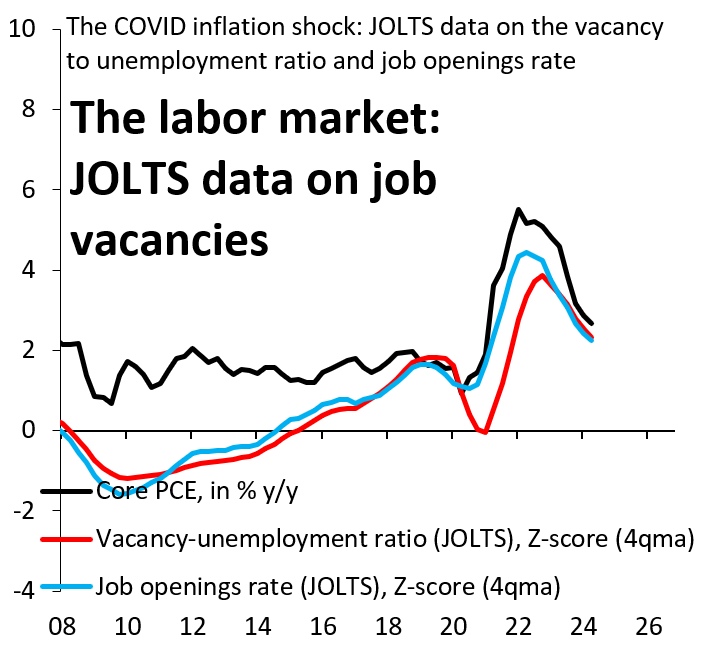
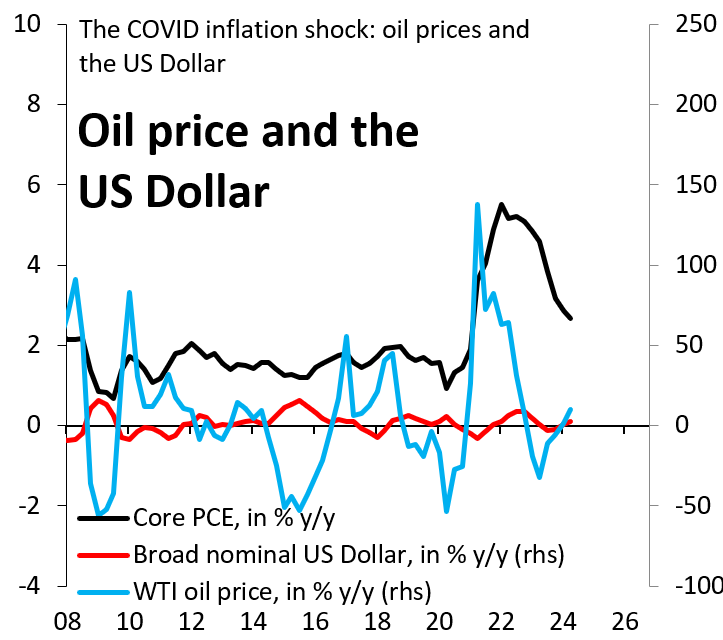
We now run through key potential drivers of the COVID-19 inflation surge. Figure 3 shows output and input prices from the PMIs, which we have transformed into Z-scores by de-meaning and scaling by their historical standard deviation (a Z-score of one can be interpreted as a value that is one standard deviation higher than the pre-COVID average). This chart shows that output prices rose more than input prices, a rise that correlates with the COVID-19 inflation spike. Figure 4 uses the difference between our output and input price Z-scores to proxy for firms’ margins, a novel measure of supply chain disruption we have not seen used in other related work. Figure 4 shows that delivery times normalized to pre-COVID levels in late 2022, while our margins proxy has fallen much more slowly and is only now about to go into negative territory (a sign margins are falling). The preferred measure for labor market tightness is the vacancy-to-unemployment ratio—shown in Figure 5—which rose sharply during the pandemic suggesting that the high number of vacancies relative to unemployed may have contributed to rising inflation. Lastly, two other potential drivers are shown in Figure 6: oil prices, which rose sharply as the global economy recovered from COVID-19, and movements in the broad, trade-weighted dollar, which also potentially impact inflation.
Figure 5. The labor market: JOLTS data on job vacancies
Source: Haver Analytics
Figure 6. Oil price and the US dollar
Source: Haver Analytics
A bigger role for supply chains in the COVID-19 inflation surge
We use an econometric model to link year-over-year core PCE (personal consumption expenditures) inflation to measures of supply chain disruption, labor market tightness, oil prices, and the trade-weighted dollar. As measures of supply chain disruption, we use three metrics: (i) PMI delivery delays, which are widely used in the literature; (ii) our margins proxy; and (iii) new firm orders minus inventories, where we construct the latter in a similar manner to our margins proxy (the difference between the new orders and inventories Z-scores). Our measure of labor market tightness is the vacancies-to-unemployment ratio. In addition to oil prices and the broad dollar, we control for long-term inflation expectations, for which we use the expected inflation rate over the next 10 years from the Federal Reserve Bank of Philadelphia.
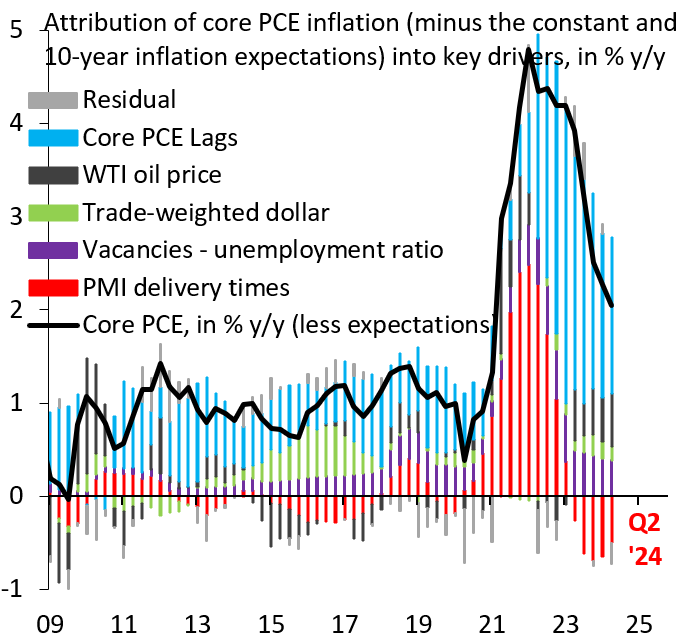
Figure 7. Drivers of core PCE inflation, baseline model
Source: Haver Analytics
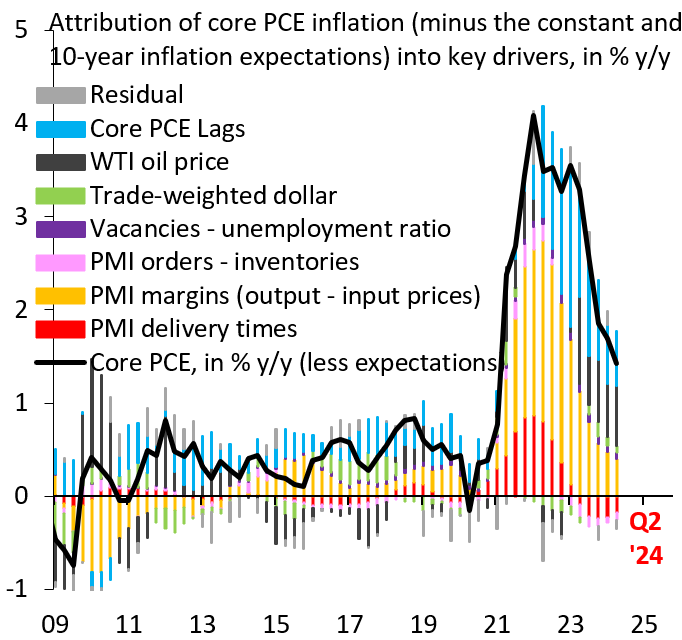
Figure 8. Drivers of core PCE inflation, augmented model
Source: Haver Analytics
Figure 7 breaks down the drivers of core PCE inflation in our baseline model, which uses only delivery times as a proxy for supply chain disruptions. Figure 8 shows the same thing for our augmented model where—in addition to delivery times—we also use margins and new orders minus inventories to proxy for supply chain problems. In both cases, the black line is year-over-year core PCE inflation, where we have subtracted the constant in our regression and the contribution from 10-year inflation expectations. The bars show the contributions from various drivers. Three conclusions emerge. First, regardless of which model we use, supply disruptions explain the bulk of COVID-era inflation. Using delivery times only, supply chains explain 58% of year-over-year inflation in Q4 2021, while in the case of our expanded list of supply chain variables this number grows to 79% (these shares are 25% and 62%, respectively, in Q4 2022). Second, margins are by far the most important supply chain variable and crowd out any role for the vacancies-to-unemployment measure. The share of Q4 2021 inflation accounted for by delivery times goes from 58% in our simple model to 24% when we include margins. Labor market tightness—and thus excessive policy stimulus—look to have played a minor role. Third, margins lag the normalization in delivery times substantially. Indeed, this lag is so important that the overall supply chain effect in Q4 2023 in our expanded model is positive at 13%, while this number is -27%in the delivery times only model. Indeed, margins are only about to go negative in the latest data, which means this may be an important source of disinflation going forward.
Our finding that margins play a key role—and usurp delivery times—is a key result. The fact that delivery times stopped driving inflation in late 2022 leads Bernanke and Blanchard to conclude that demand must be the explanation for still-elevated inflation more recently. Our result provides an alternative explanation. Inventory managers may be slow to normalize margins because the shock of empty shelves at the height of COVID-19 was so severe. High inflation after delivery times normalized may thus still have supply disruptions as its primary driver.
The importance of margins as a lagged transmission channel also has important implications for the Fed. We attribute much of the fall in inflation since the peak of the pandemic to supply-linked factors as opposed to demand, which—by extension—means that Fed hikes may have played only a modest role in bringing inflation down. If this is true, it suggests that the Fed may have overtightened in 2022 and should now shift to easing policy, potentially in rapid fashion.
Of course, our analysis is subject to important caveats. One issue that bedevils all work in this area is that the COVID-19 episode is unique, which means our results may not generalize out of sample and into the future. This is an issue that Bergholt and co-authors highlight. A further complication stems from the fact that stretched delivery times and elevated margins inevitably have a demand component. Our reading of the existing literature is that it largely attributes variation associated with supply chain variables to “supply,” but this may understate the role of demand. Lastly, it is possible that tight labor markets have a disproportionate effect on inflation, an argument in favor of a nonlinear Phillips curve as proposed by Gagnon and Collins. Bernanke and Blanchard do not find evidence of such nonlinearity during COVID-19, but—again—this raises the possibility that the role of demand could be understated.
Authors


Related Content

-
Acknowledgements and disclosures
Peter Orszag is the chief executive officer of Lazard, which provides financial support for Brookings.
The Brookings Institution is financed through the support of a diverse array of foundations, corporations, governments, individuals, as well as an endowment. A list of donors can be found in our annual reports published online here. The findings, interpretations, and conclusions in this commentary are solely those of its authors and are not influenced by any donation.
The Brookings Institution is committed to quality, independence, and impact.
We are supported by a diverse array of funders. In line with our values and policies, each Brookings publication represents the sole views of its author(s).

Commentary
COVID-19 inflation was a supply shock
August 15, 2024