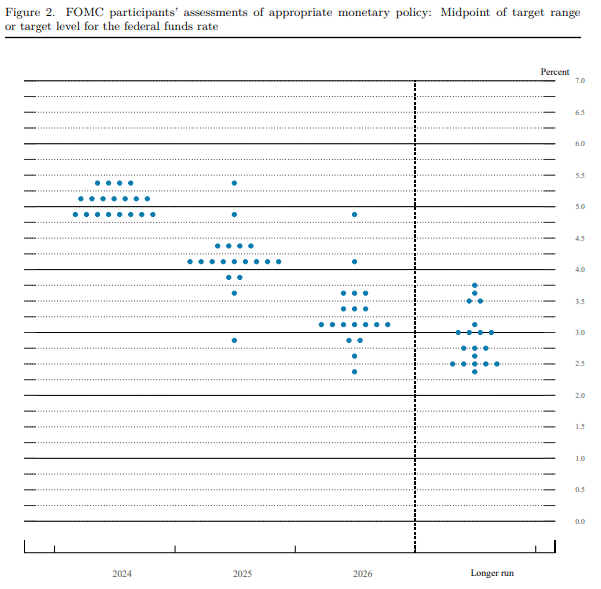
The Federal Reserve began publishing what’s become known as “the dot plot” in its Summary of Economic Projections in 2012. The dots show the path of short-term interest rates that each of the 19 members of the Federal Open Market Committee deems appropriate for the next few years. Here’s the dot plot released in June 2024:
Source: Federal Reserve Board of Governors, https://www.federalreserve.gov/monetarypolicy/files/fomcprojtabl20240612.pdf
The dots proved an effective tool of forward guidance following the Global Financial Crisis when the Fed wanted to send a strong signal that it hadn’t any immediate plans to raise interest rates.
The dots have a couple of shortcomings. One, the dots are sometimes seen as a signal about the future path of interest rates even when the Fed isn’t trying to send one or is genuinely unsure about the near future. Second, the median dot is often regarded by Fed watchers as a strong indication of the Fed’s plans, even though Fed chairs have cautioned against reading too much into them.
If not the dots, then what? Scenarios, perhaps.
How do scenarios work?
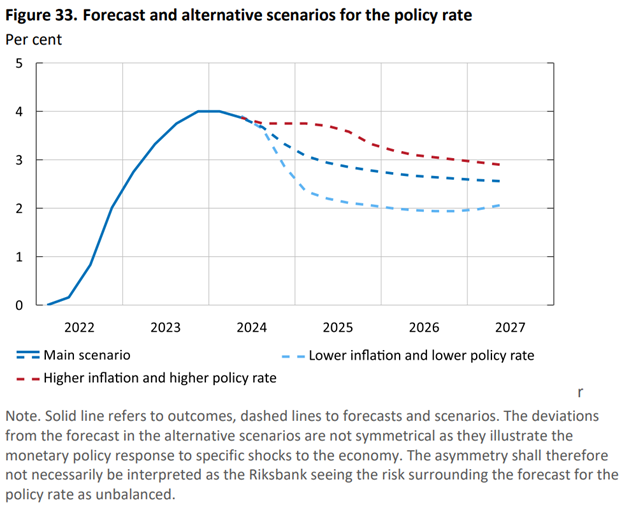
Scenario analysis is essentially a detailed “what if.” How would a central bank’s forecast of GDP and inflation change if, say, oil prices plunged or soared? How would its plans to move interest rates change? Most central banks do such analysis as part of their deliberations, but only a few disclose them publicly—including the Swedish Riksbank. It routinely provides an interest rate forecast and alterative scenarios. In June 2024, for instance, the central bank left its policy rate unchanged at 3.75% and said in its Monetary Policy Report that it was “likely that it may be cut two or three times during the second half of the year if the inflation prospects remain the same.” It then offered two alternative scenarios. In one, it assumed that inflationary pressures would be greater both in Sweden and abroad and said it would hold off on rate cut. In the other, it described how it anticipated responding if inflationary pressures are weaker than in its main forecast: It would cut rates more sharply. The chart below is from the report.
Source: The Riksbank, https://www.riksbank.se/globalassets/media/rapporter/ppr/penningpolitiska-rapporter-och-uppdateringar/engelska/2024/monetary-policy-report-june-2024.pdf
The Federal Reserve staff economists routinely present alternative scenarios (known internally as “altsims”) to Fed policymakers, but they are not made public until transcripts of FOMC meetings are released five years later. At the January 2018 FOMC meeting, for instance, Fed staff provided simulations of six alternatives to its baseline forecast:
To illustrate some of the risks to the outlook, we construct alternatives to the baseline projection using simulations of staff models. The first two scenarios illustrate some of the uncertainty surrounding the macroeconomic effects of the Tax Cut and Jobs Act. In the first scenario, the effects on the economy are larger as investment and labor supply respond more than in the baseline. In contrast, in the second scenario, supply constraints in tight labor and product markets, together with a lower marginal propensity to consume, weaken the economic effects of the tax reform. The third scenario illustrates the consequences of a lower natural rate of unemployment that is initially misperceived by the central bank. In the fourth scenario, we study a downside risk for inflation in which households and businesses have lower inflation expectations than in the baseline because they perceive that monetary policy will be too tight to return inflation to the FOMC’s 2 percent objective over the medium term. In contrast, the fifth scenario examines the upside risk that the response of wages and prices to the further tightening of labor market conditions will be stronger than we have assumed, and that inflation expectations will be more responsive to a rise in actual inflation. In the sixth scenario, we present the implications of a substantial correction in global asset valuations. The last scenario considers the effects of stronger foreign economic growth in combination with a faster normalization of monetary policy in the advanced foreign economies.
For each scenario, the staff showed how GDP growth, unemployment, inflation, and the federal funds interest rate would differ from its baseline.
The table the staff prepared for the FOMC is on page 70 of the Teal Book, as the staff forecast is known.
What’s the case for central banks publishing scenarios?
In his review of the Bank of England’s forecasting and communications, former Fed Chair Ben Bernanke (now at Brookings) recommended that the Bank’s Monetary Policy Committee (MPC) augment the forecast it already publishes with “alternative scenarios, with the specific scenarios ideally decided upon at an early stage of each forecast round.”
Publishing a single MPC forecast, he said, doesn’t give the public all the information needed to understand the policy that the committee has adopted, nor does it provide much insight into the risks influencing the MPC’s decision. Publishing selected scenarios alongside the central forecast, he said, would address those shortcomings, would allow sophisticated observers to better understand the Bank’s reaction function (i.e. how it would response to changes in the economic outlook), and could give MPC members who disagree with the committee’s decision a way to explain their views.
In response to Bernanke, the Bank of England said: “Scenarios have the potential to offer a better means of articulating the balance of risks around the outlook. To implement scenarios the Bank will need to ensure that the forecasting system is sufficiently flexible and efficient to support the production of multiple alternative views of the outlook.”
A former top Fed staff economist, David Stockton, made similar recommendations to the Bank of England in 2012, arguing that “the use of alternative scenarios could help to illustrate how sensitive the forecast is to different critical judgments.” The MPC has published alternative scenarios since then, but not routinely.
What do Fed officials say about publishing scenarios?
Current Fed officials recently have been talking about the virtues of scenarios. “The path of the economy is so uncertain—which means that our response to it, a change in monetary policy, may also be uncertain—so why not entertain various scenarios?” Fed Governor Lisa Cook said in June 2024. “That could be a very useful tool.”
St. Louis Fed President Alberto Musalem, also in June, said, “I believe it is critical to communicate both about the most likely scenario and about less likely scenarios that could be consequential if they materialize. Communicating about a range of scenarios, rather than only the most likely, is an important component of robust policymaking.
And Fed Governor Christopher Waller, in a July 2024 speech, said, “It is important to not only lay out your base case, but also alternative paths for policy if your base case is disrupted by incoming data. And for monetary policy, it is even more important to communicate those alternative policy paths to the public so that they can also make plans.” He outlined his economic outlook and then discussed three different scenarios about inflation in the second half of 2024 and how those would affect his views on the appropriate level of interest rates.
What challenges would the Fed face in publishing scenarios?
To publish alternative scenarios, the Fed would need first to publish a central forecast, as the Bank of England and the Riksbank do. It doesn’t do so currently. The Summary of Economic Projections provides each of the 19 FOMC participants’ forecasts for the economy and interest rates, but these don’t represent the FOMC’s consensus or an official forecast.
In 2012, the FOMC experimented internally with developing a consensus forecast, but reaching agreement among the 19 participants proved impossible, and the Fed abandoned the effort. An alternative would be to publish the Fed staff forecast, and then present alternative scenarios to that. The Fed, might for instance, show how it would react if the unemployment rate or some other measure of the labor market deviated—up or down—from its forecast.
Minutes of FOMC meetings occasionally summarize the staff forecast, but details are kept from the public for five years. Public release of the staff forecast could create problems. The staff might, for instance, be uncomfortable with public scrutiny of its forecast—and, for that reason, might be reluctant to change its forecast as circumstances change. In addition, the staff forecast incorporates assumptions about fiscal policy that could be politically delicate. For instance, the current Fed staff forecast has to make an assumption about what Congress will do when the tax cuts in the Tax Cuts & Jobs Act expire in 2025. Disclosing the Fed staff’s expectations could be uncomfortable for the Fed. Moreover, policymakers at the Bank of England and the Riksbank own the forecasts; in contrast, the Fed staff forecast may not represent the views of FOMC participants.
-
Acknowledgements and disclosures
The Brookings Institution is financed through the support of a diverse array of foundations, corporations, governments, individuals, as well as an endowment. A list of donors can be found in our annual reports published online here. The findings, interpretations, and conclusions in this report are solely those of its author(s) and are not influenced by any donation.
The Brookings Institution is committed to quality, independence, and impact.
We are supported by a diverse array of funders. In line with our values and policies, each Brookings publication represents the sole views of its author(s).





Commentary
Could the Fed replace the dot plot with scenarios?
August 1, 2024