In this edition of Charts of the Week: education and earnings; size of government; and COVID-19’s spread into red states.
EARNINGS BASED ON YOUR LEVEL AND TYPE OF EDUCATION

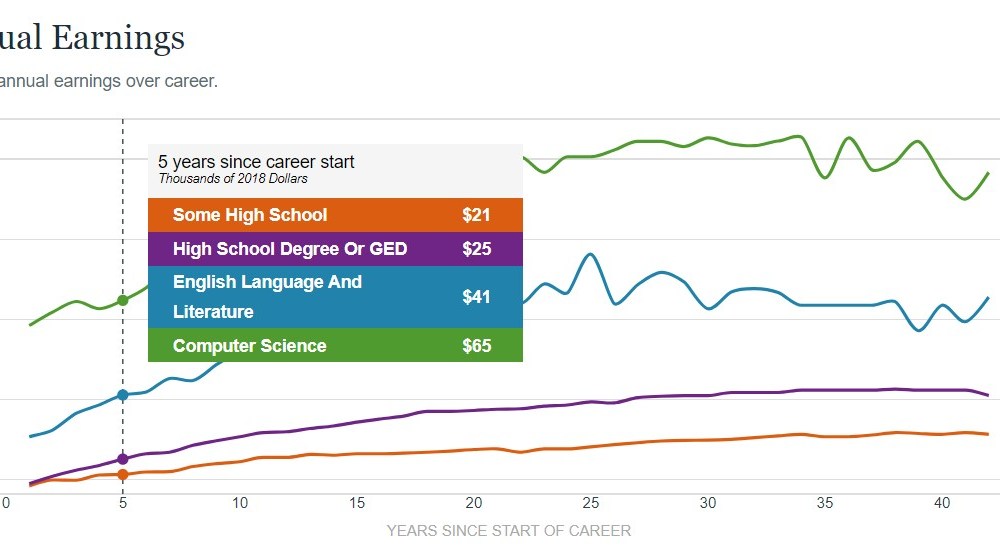
Scholars Kristen Broady and Brad Hershbein updated data in a 2014 Hamilton Project analysis of earnings of college graduates by major, and also for those with other levels of education. The interactive chart allows users to select different levels of education (e.g., less than high school, high school or GED, some college, nearly 100 college majors, and graduate degrees). The chart above shows one permutation: a comparison of earnings after five years of those with some high school, high school/GED, an English degree, and a computer science degree.
THE FEDERAL GOVERNMENT NEARING RECORD SIZE
Paul C. Light tracks the “true size” of the federal government, a number that includes civil servants, postal workers, active duty military, contractors, and grantees. This “blended workforce,” Light shows, has grown during the Trump administration, particularly in the contract and grant sectors in the Departments of Defense, Transportation, and HHS. Read more to learn why Light argues that “the federal government’s blended workforce may have become a threat to the very delivery it guarantees.”
CORONAVIRUS SPREADING INTO RED STATES

William Frey continues his analysis of the demographic and political aspects of COVID-19’s spread across the country. “[W]hile the overall rate of the spread has diminished somewhat from mid-summer,” Frey observes, “the disparity in cases between red and blue areas has continued, and is now widening in parts of the Midwest and in smaller communities.” In the early months of the pandemic’s spread, blue states were hit harder, but since July new cases of the virus have surged more in red states.
The Brookings Institution is committed to quality, independence, and impact.
We are supported by a diverse array of funders. In line with our values and policies, each Brookings publication represents the sole views of its author(s).

Commentary
Charts of the Week: earnings and education; size of government; COVID-19 in red states
October 9, 2020