
Introduction
Back in the throes of the COVID-19 pandemic, several commentators began to promote the “urban doom loop” theory, suggesting that the demographic and economic vibrancy of big cities would continue to wane. This perspective arose in reaction to the pandemic-related exodus of residents from such cities, the rise of video conferencing platforms such as Zoom, and an abatement of city living. Yet newly released U.S. Census Bureau statistics through 2022–2023 reveal that—contrary to the urban doom loop theory—many cities have arrested the demographic declines they suffered during the peak of the pandemic and have begun to turn a corner.
The discussion below examines recent demographic shifts in the nation’s 91 big cities with populations exceeding 250,000 based on recently released population estimates from the Census Bureau.1 It also examines city-suburban population shifts within the nation’s 56 largest metropolitan areas, those with populations exceeding 1 million. Statistics on individual city growth trends, rankings, and city-suburb population shifts can be found in three supplementary, downloadable tables (see tables A, B, and C) and in map 1.
A return to big city population growth and reduced losses
To put recent growth patterns in perspective, figure 1 shows the population growth rates in each year from 2000–2001 to 2022–2023 for the aggregate populations of the aforementioned 91 big U.S. cities. City growth was high between 2007 and 2015 due in large part to the 2007–2009 Great Recession, which put a damper on the suburban housing market and allowed many cities to retain young adult millennials, who might otherwise have relocated to the suburbs. In fact, most of the nation’s individual large cities had their highest growth rates of the 2010s in the first half of that decade (see downloadable table A). As the U.S. economy and housing market picked up in the mid-to-late 2010s, city growth rates began to decline. During the prime pandemic year, 2020–2021, the aggregate population of the big cities dropped nearly 1 percent, the first such decline since at least 2000. In that same year, a record 56 of the 91 individual big cities registered population declines, well above the corresponding figure for the big city growth years of the 2010s. In 2011–2012, by comparison, just four of the cities had their populations fall (see figure 2).
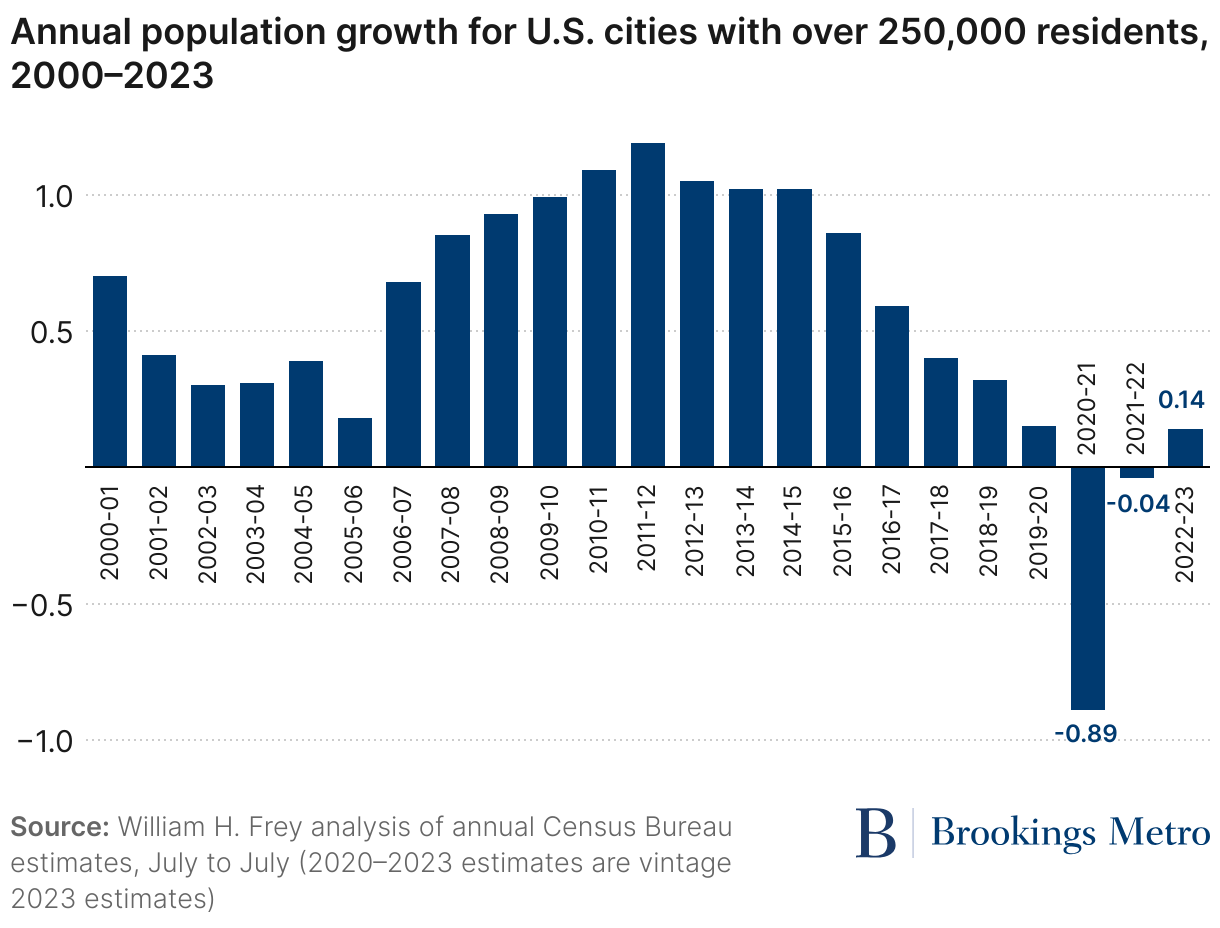
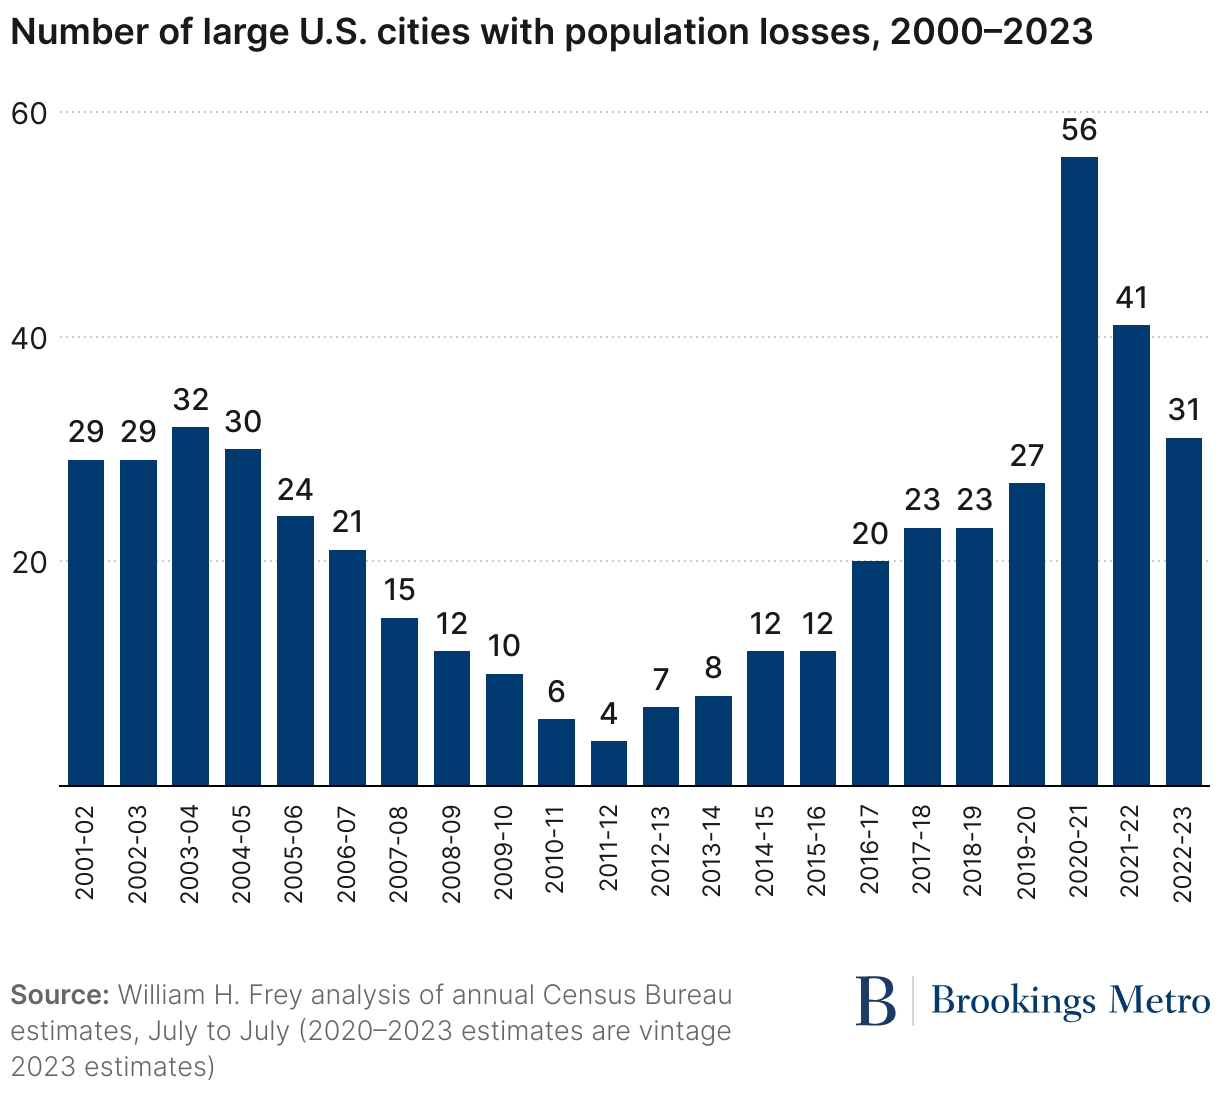
In the two years since the pandemic’s peak, aggregate city growth was negative by a smaller magnitude in 2021–2022 and returned to positive growth in 2022–2023. Meanwhile, the number of major U.S. cities that weathered population losses fell from 56 in 2020–2021 to 41 in 2021–2022 and then dropped again to 31 in 2022–2023.
Map 1 displays the population gains and declines for major U.S. cities for the three periods 2020–2021, 2021–2022, and 2022–2023. In 2020–2021, cities located in all regions of the country faced declining populations. The cities of San Francisco, Houston, Boston, Seattle, Atlanta, Detroit, Minneapolis, Miami, and Washington, D.C. all turned population declines in 2020–2021 into gains in the subsequent two years. Some cities—such as New York, Los Angeles, and Chicago—continued to weather population drops, but they slowed their declines in the past two years.
Larger cities have done demographically better since the prime pandemic year
Demographic progress was most evident in the nation’s very largest cities. Overall, two-thirds (64) of the 91 large cities did demographically better—registering larger population gains, smaller declines, or flips from declines to gains in 2022–2023 compared to the prime pandemic year of 2020–2021. This was especially true for the 38 cities with at least 500,000 residents. As shown in table 1, seven of the nine cities with populations of at least 1 million, and 27 of the remaining 29 cities with populations between 500,000 and 1 million, exhibited demographic progress in terms of population gains or slowing population decline (see table 1 and downloadable table A).

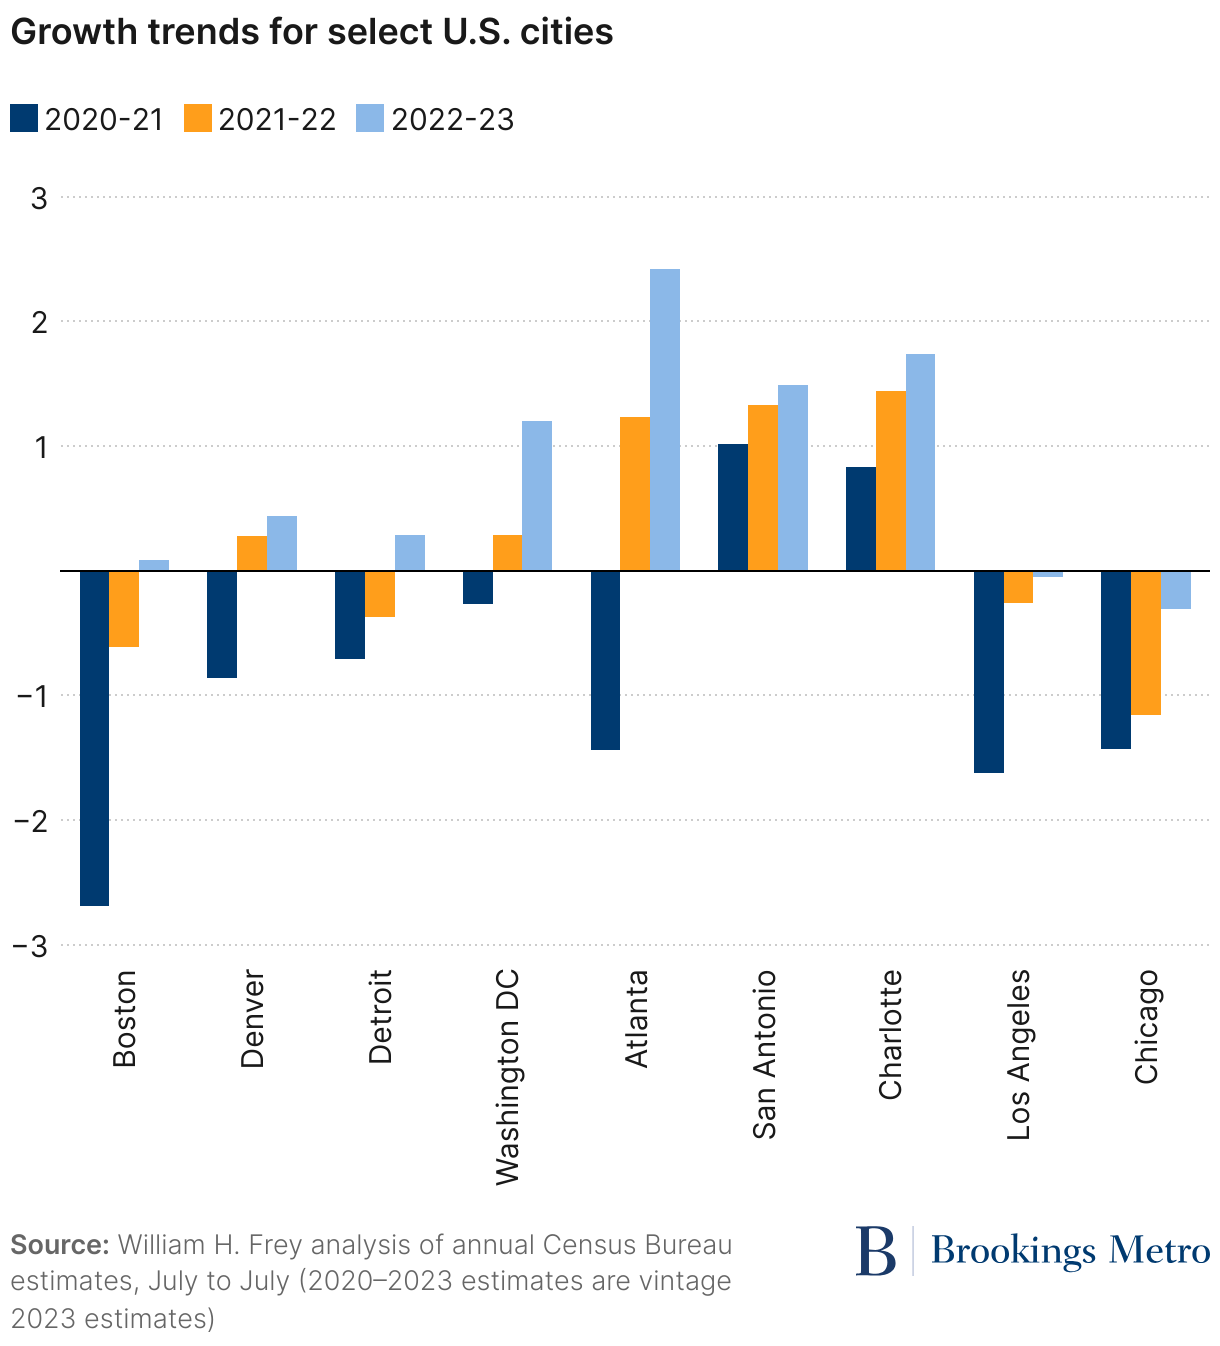
Among the 34 very large U.S. cities that did demographically better in 2022–2023 than in the prime pandemic year, 15 flipped from declines to gains, including Boston, Denver, Detroit, Washington DC and Atlanta; 8 posted larger gains including San Antonio and Charlotte; and 11 experienced smaller declines, including Los Angeles and Chicago (see downloadable table A).
Although most of these demographic improvements might be attributable to domestic migration with other parts of the U.S. (either greater in-migration or reduced out-migration), the post-pandemic period was also characterized by higher immigration from abroad and natural population increases (fewer deaths and more births) than occurred during the prime pandemic year. The relative impacts of these components on 2010–2023 growth levels for the cities of New York and San Francisco are portrayed in figure 4.
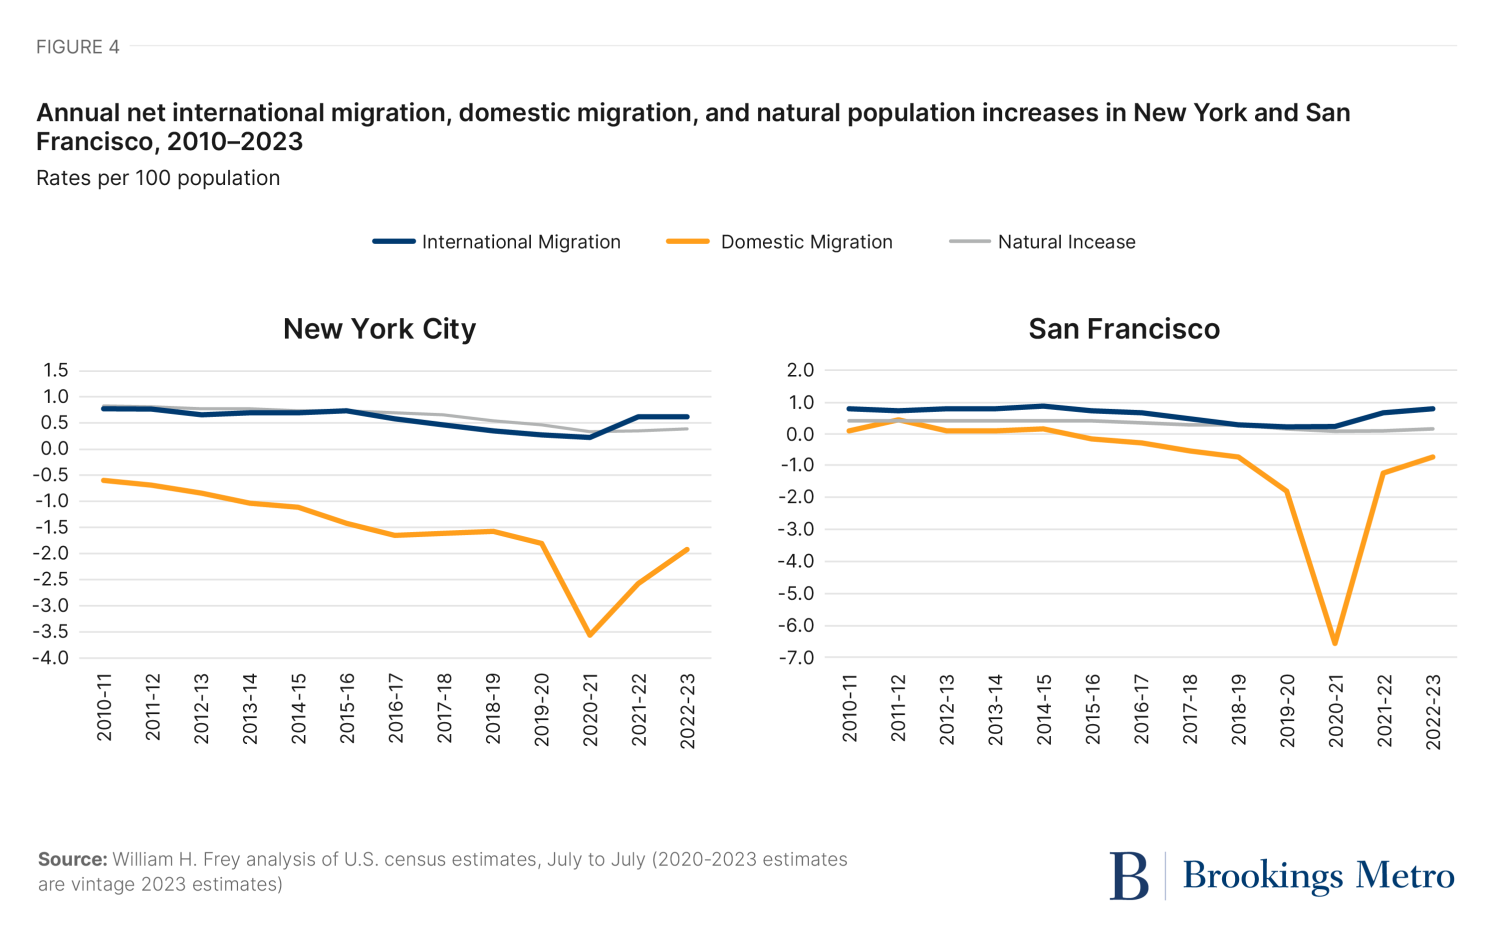
These findings show that, in both cities, the sharp domestic migration decline in 2020–2021 was most responsible for their dramatic population drops in that year and their improved showing in the subsequent two years. However, these figures also make plain that some of these gains were attributable to increased immigration from abroad, while natural population increases remained static or rose modestly.
Southern U.S. cities continue to grow most rapidly
As discussed above, cities in all parts of the country took demographic hits during the prime pandemic year. Still, big southern cities grew faster than those in other regions and increased their growth in 2022–2023. Figure 5 shows that, while cities in the Northeast and the Midwest bore the brunt of pandemic-era population declines, southern cities also took a hit—with Atlanta, Dallas, Houston, and Miami, among others, registering sizable population losses in 2020–2021. Yet in the subsequent two years, several southern cities not only continued to grow more rapidly than those in other regions; their growth rates actually increased.
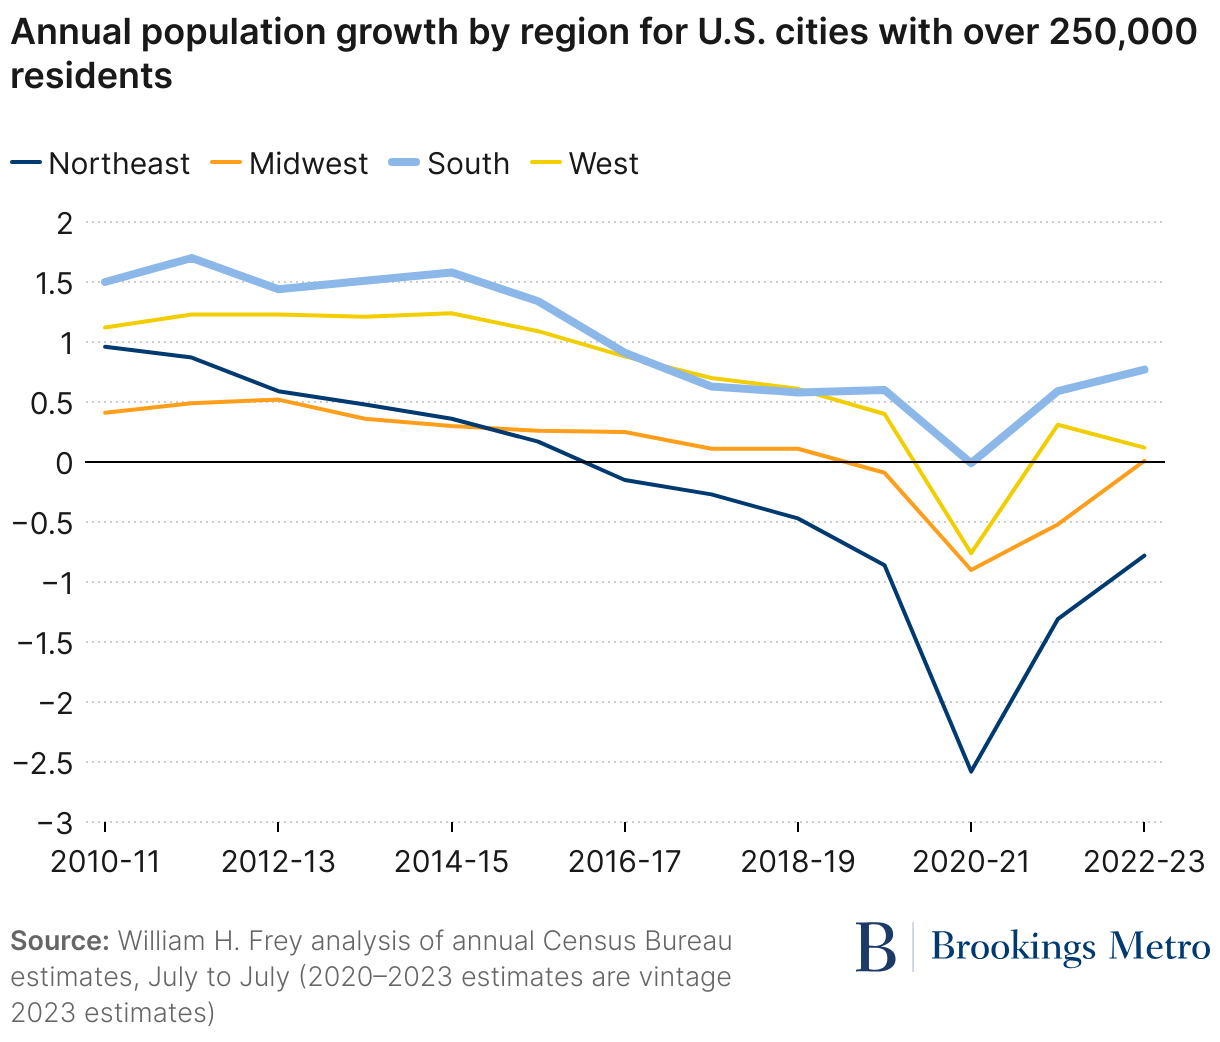
A look at big city growth rankings in 2022–2023 (see downloadable table B) shows that 13 of the 15 fastest-growing big cities are in the South, including Atlanta, Charlotte, Fort Worth, Jacksonville, Orlando, Raleigh, and San Antonio. Southern cities also account for 12 of the 15 cities with the largest numeric population gains, led by San Antonio and Fort Worth. Despite the South’s noted dominance, there were southern outliers with less robust growth including New Orleans (ranked last in big city growth rates), Memphis (fifth to last), and Baltimore (seventh to last).
Western cities exhibited a more mixed demographic performance. While Henderson, Nevada; Phoenix; and Seattle rank among the top 12 cities in numeric gains, Portland, Oregon, and several Californian cities (such as Anaheim, Long Beach, Los Angeles, and San Jose) posted declines that ranked in the 15 largest population losses among the big cities.
City and suburban population growth rises
As city population growth dipped, reversed, and then resumed, the demographic relationship with surrounding suburbs shifted, too. Using a Brookings classification scheme, figure 6 displays annual primary city and suburban growth from 2010–2011 to 2022–2023 for 56 major metropolitan areas with populations exceeding 1 million.2
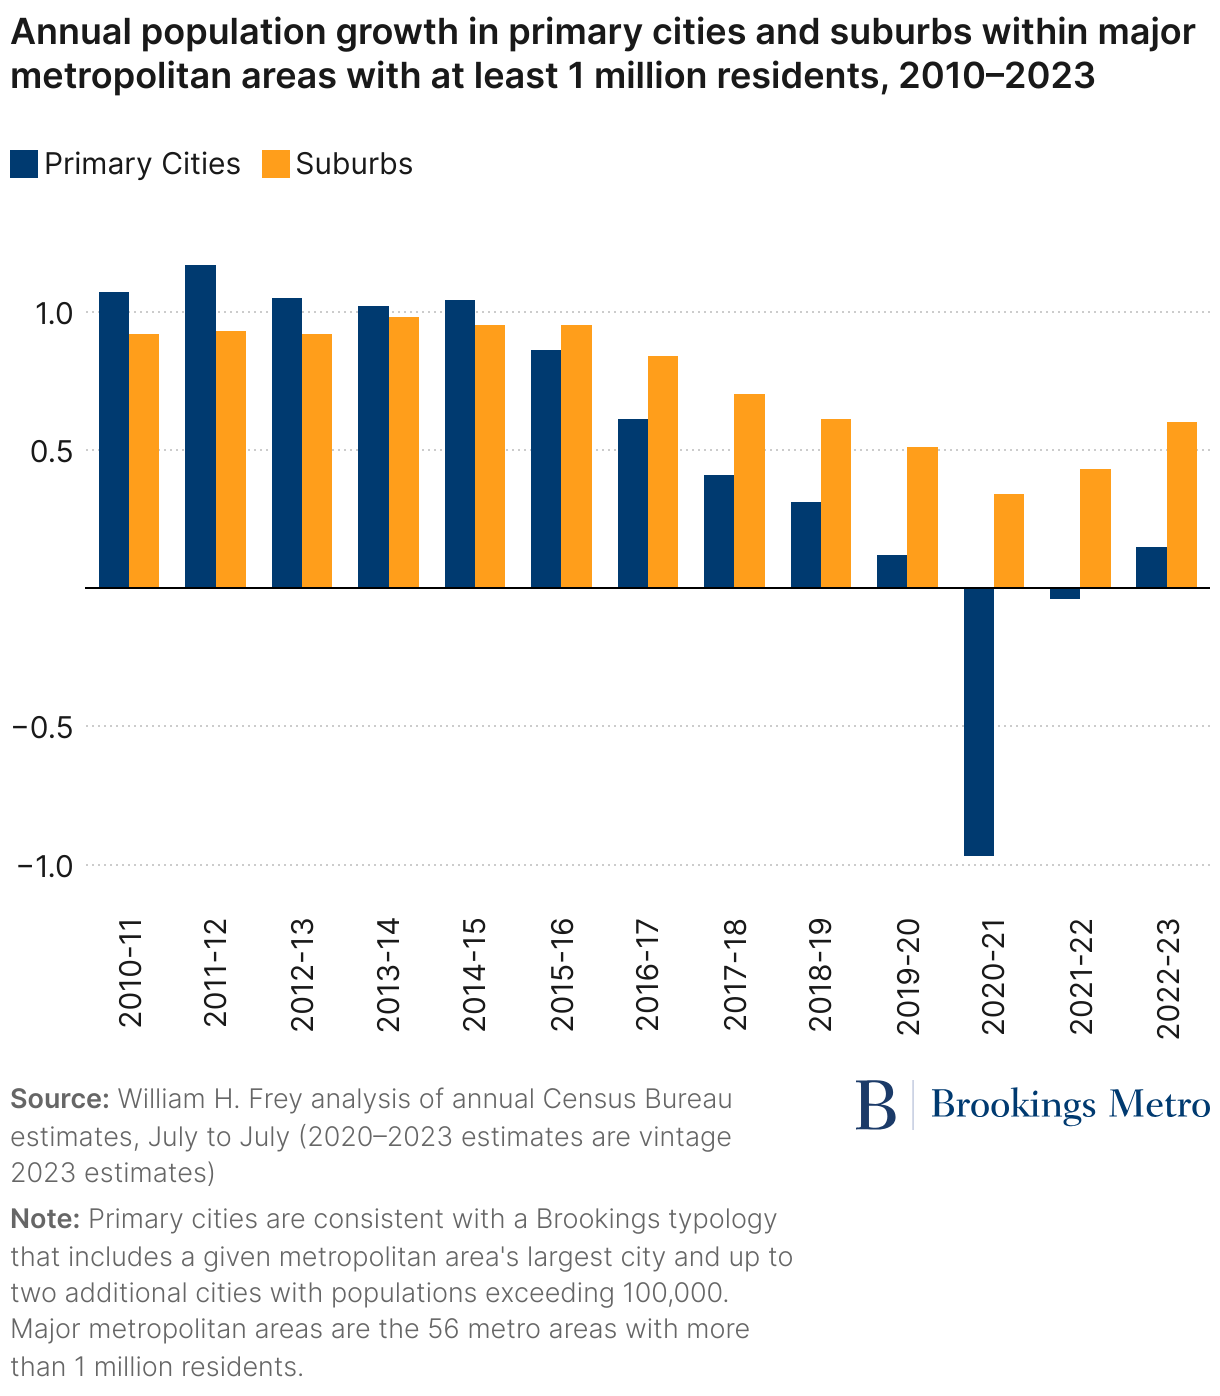
As big cities retained more residents in the early 2010s, their aggregate growth rate outpaced that of surrounding suburbs between 2010–2011 and 2014–2015. During this time, growth favored primary cities in many individual metropolitan areas including New York, Los Angeles, Chicago, Washington, D.C., Boston, Seattle, Minneapolis, Denver, Orlando, and Charlotte. In 2011–2012, for instance, city growth surpassed suburban growth in fully 30 of the 56 major metro areas (see downloadable table C).
Midway through the 2010s, overall growth in large metro areas declined as the nation’s population began to disperse to smaller areas. During this period, as table C shows, primary city growth slowed more than suburban growth in many metro areas, falling from 1.04% in 2014–2015 to 0.12% in 2019–2020 (compared to a slump in suburban growth from 0.95% to 0.51% over that time frame). Because city growth fell below suburban growth, this was a period of increased suburbanization within these metro areas.
The prime pandemic year of 2020–2021 was a period of sharp population decline in primary cities, widening the demographic divide between cities and suburbs. That year, aggregate primary city populations dropped by 0.97%, while aggregate suburban populations grew by 0.34%. Especially large disparities in city-suburb growth were evident in the New York, Dallas, Houston, Atlanta, Boston, and San Francisco metro areas. During that year, primary cities grew faster or shrank slower than their suburbs in just seven metropolitan areas.
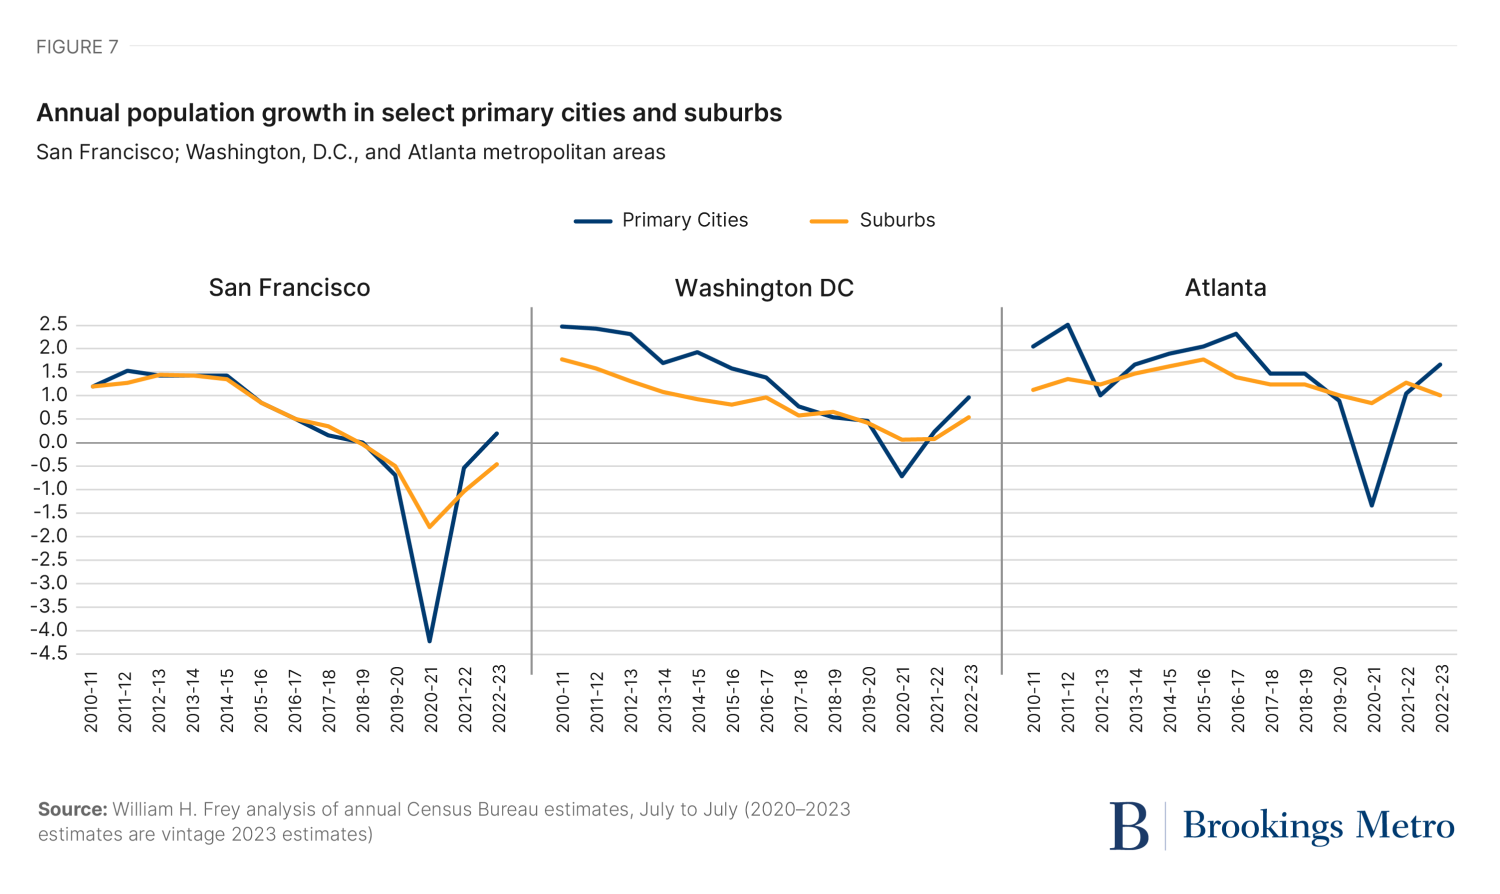
Over the past two years, primary city population growth showed some signs of rebounding, even as growth in major metropolitan areas also rose. As a result, the suburban growth advantage over cities shrank, though growth still favored suburbs whose growth levels also rose. In 2022–2023, the number of metro areas where city growth rates dominated those of their suburbs rose to 15, including in San Francisco, Washington D.C., and Atlanta (see figure 7). Thus, while suburbanization continues in major metro areas, primary cities are rebounding as well.
Looking ahead
The new census population estimates do not show a wholesale revival of the nation’s biggest cities. The data now reflect just two years since the prime pandemic year, when cities suffered historic population losses. What these statistics do reveal is a continued demographic improvement for most cities in the form of greater population gains, reduced losses, or flips from losses to gains. Most of these cities are located within major metropolitan areas that also have experienced post-pandemic demographic improvements.
At least when it comes to big city demographic shifts, the “urban doom loop” scenario is not holding up. Of course, there are still many unanswered questions about the dynamics of further urban growth: these involve considerations such as the future of remote work; the revival of urban-centered jobs in a more advanced, high-tech economy; the likely contributions of new immigrant waves; and the preferences of younger generations (especially Generation Z’s 68 million members) who have traditionally favored cities. The new data show some reasons for urbanists to be optimistic, but these findings also counsel continued patience and vigilance as cities navigate future uncertainties.
Author

Related Content


-
Footnotes
- This data is compiled by the Census Bureau’s population estimates program: it includes annual evaluation estimates for the period July 2010–July 2020 and vintage 2023 estimates for July 2020–July 2021, July 2021–July 2022, and July 2022–July 2023.
- Brookings Metro defines “primary cities” as one or more cities in an official metropolitan area with populations exceeding 100,000. (See table C for the list of metropolitan areas.)
The Brookings Institution is committed to quality, independence, and impact.
We are supported by a diverse array of funders. In line with our values and policies, each Brookings publication represents the sole views of its author(s).