
Last month, the Census Bureau released new data for geographic areas which provide a glimpse of how the nation’s population has been changing over the first third of the 2020s decade. It emphasizes that people of color are the main drivers of population growth for the nation as well as shifts across states, metropolitan areas and counties.
The 2020 census showed that the 2010s was the first decade in the nation’s history when the white population declined and the second consecutive decade when the white population under age 18 declined. The new census estimates for the period between April 2020 and July 2023 have made plain that both of these trends are continuing though the 2020s. This is leaving the growth of many areas reliant on the rise of members of other races and ethnic groups, especially among their youth. All of this reinforces my earlier view that the nation’s “diversity explosion” represents an important part of its future, a phenomenon that American policies and politics need to recognize.
National growth depends on minority groups, particularly Hispanic Americans
The post-2020 period has been impacted by a pandemic, a decline and then an uptick in immigration, and shifts in both births and deaths—all of which has affected overall population gains and losses.
The national population changes by race, depicted in Figure 1, show that basic patterns that were evident in the 2010s still apply after 2020. Between April 2020 and July 2023, the nation’s white population declined by 2.1 million, a figure more than countered by the combined gains of people of color, including those identifying as Hispanic, Asian (including, here, Hawaiian and other Pacific Islander), Black, American Indian and Alaska Native (AIAN), and as two or more races.1
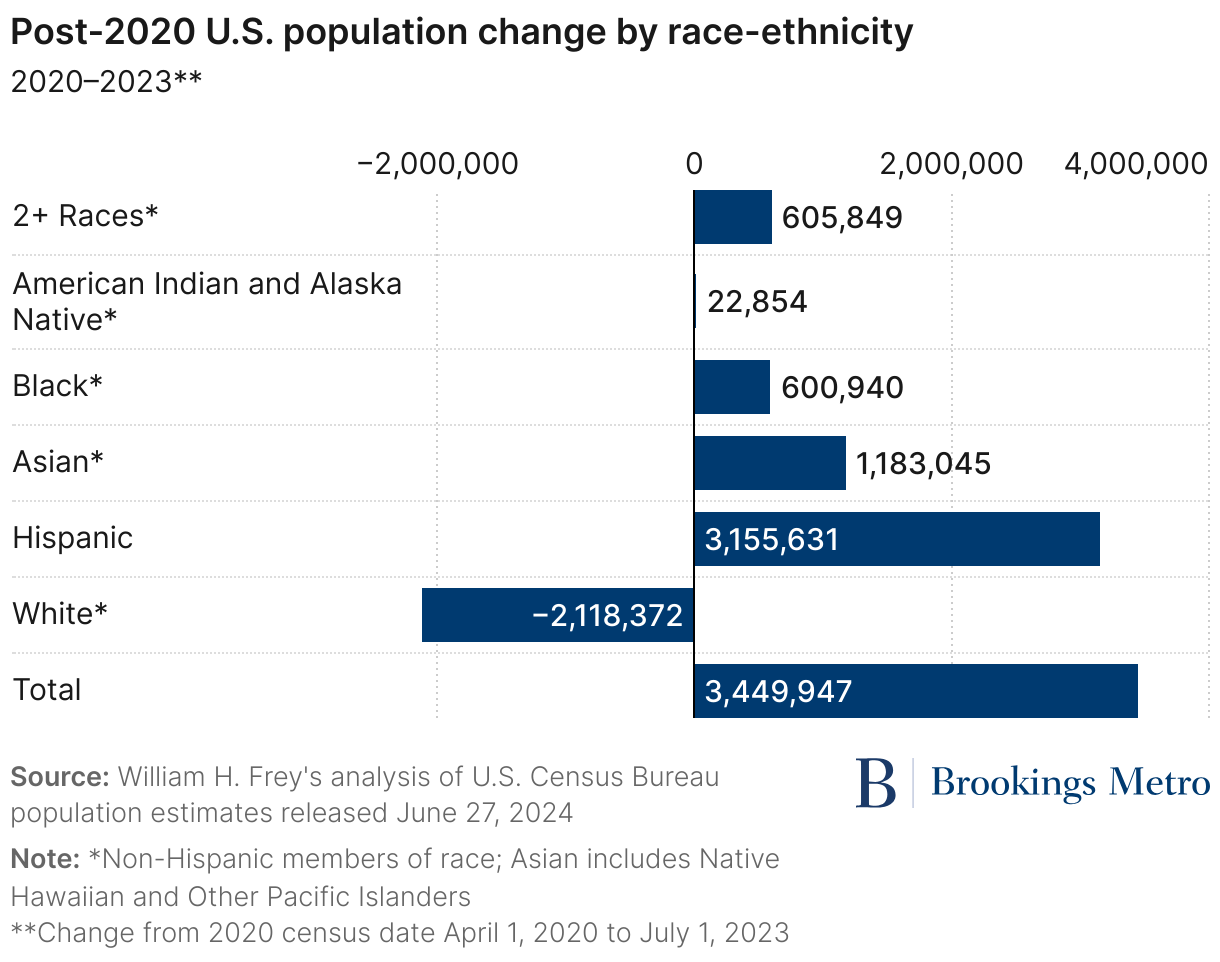
The Hispanic population contributed the most to these gains, accounting for 3.2 million, or 91% of the total U.S. population gain of 3.4 million for this three-plus year period. Within this period, the peak pandemic year of 2020–2021 showed smaller annual gains (or greater declines) for each group, but the gains picked up through 2022–2023 (see downloadable Table A).
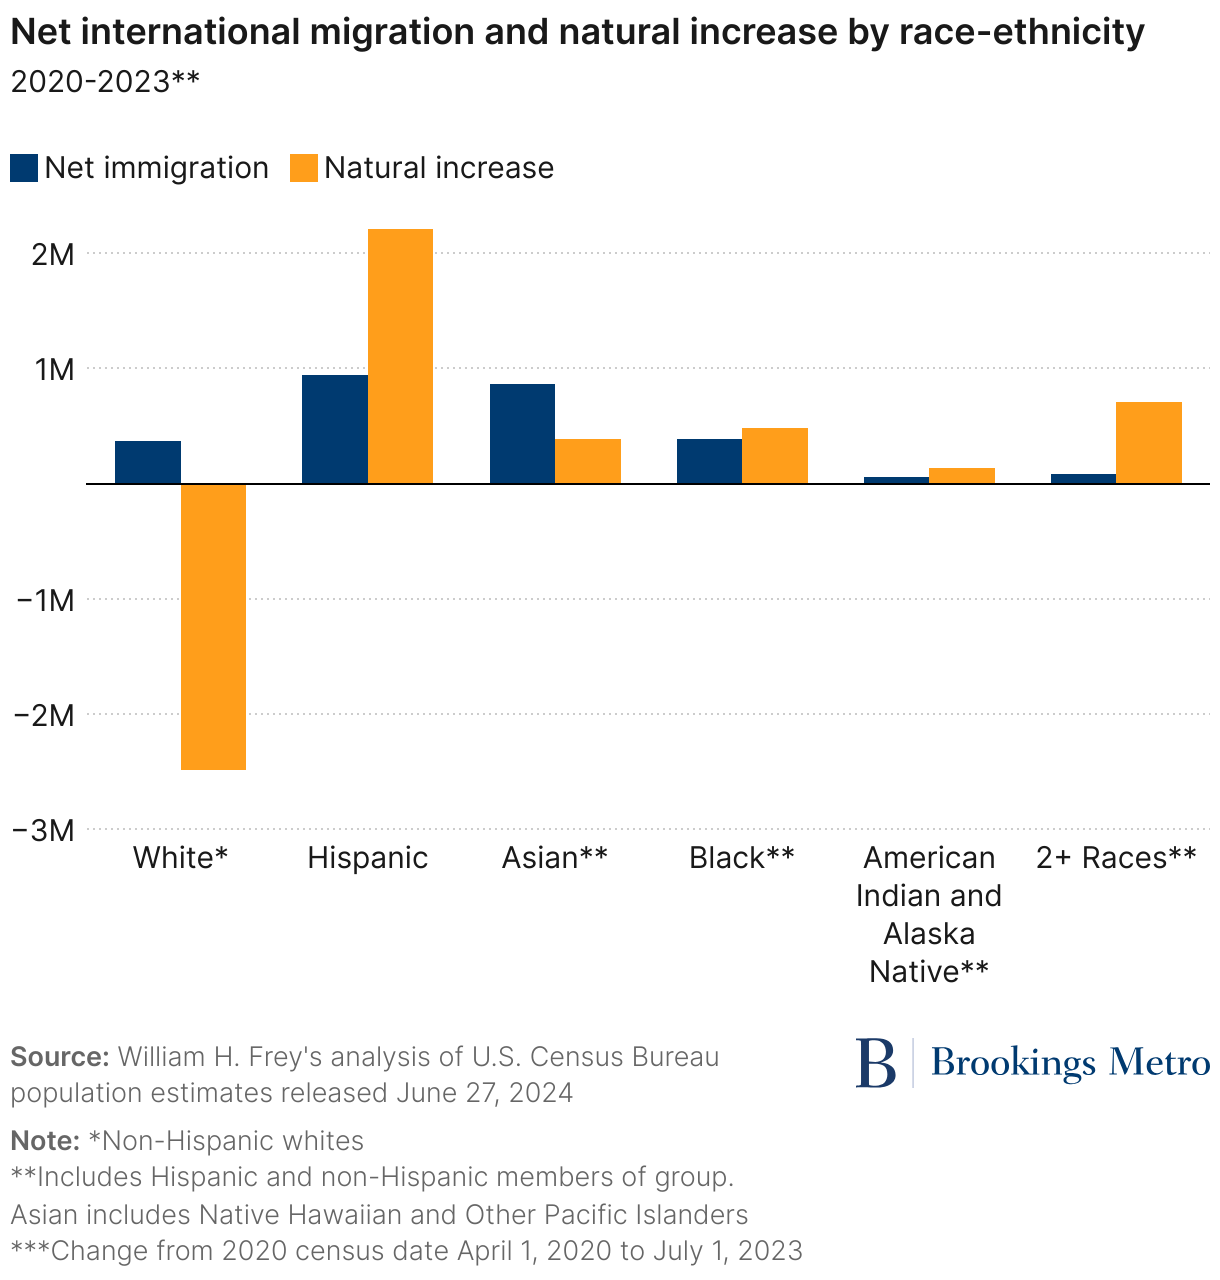
When looking at the primary demographic components of change—net international migration and natural increase (births minus deaths)—it is clear that the white population’s negative natural increase (or natural decease) contributed the most to the white population’s decline, only partially offset by white net international migration. For all other groups, except the Asian population, natural increases contributed more than immigration. And on both demographic measures, Hispanic contributions were greater than those of any other group (see Figure 2).
People of color are most responsible for state population gains
Minority populations fueled population growth across all parts of the U.S., especially in growing states. This is because white population decline is spread broadly across the nation. Over the 2020–2023 period, fully 34 states (a count that includes the District of Columbia) registered white population losses, with only 17 experiencing white gains (See downloadable Table B).
Map 1 shows that broad national picture: 17 states experienced white and total population growth (where minority gains generally outnumbered white gains), 19 states registered total gains despite white losses, and 15 states lost population size overall including substantial numbers of whites.
People of color contributed most, if not all, of the population gains in the fastest-growing states. This is depicted in Figure 3 for the five states with the greatest gains: Texas, Florida, North Carolina, Georgia, and Arizona. Although all of these states except Georgia received some white gains, the main contributions for each came from minority groups. Hispanic gains were substantial in each of these states, but in most, especially Texas, there were significant Black and Asian contributions. And in Georgia, a state with white losses, Black gains outnumbered those of the other minority groups.
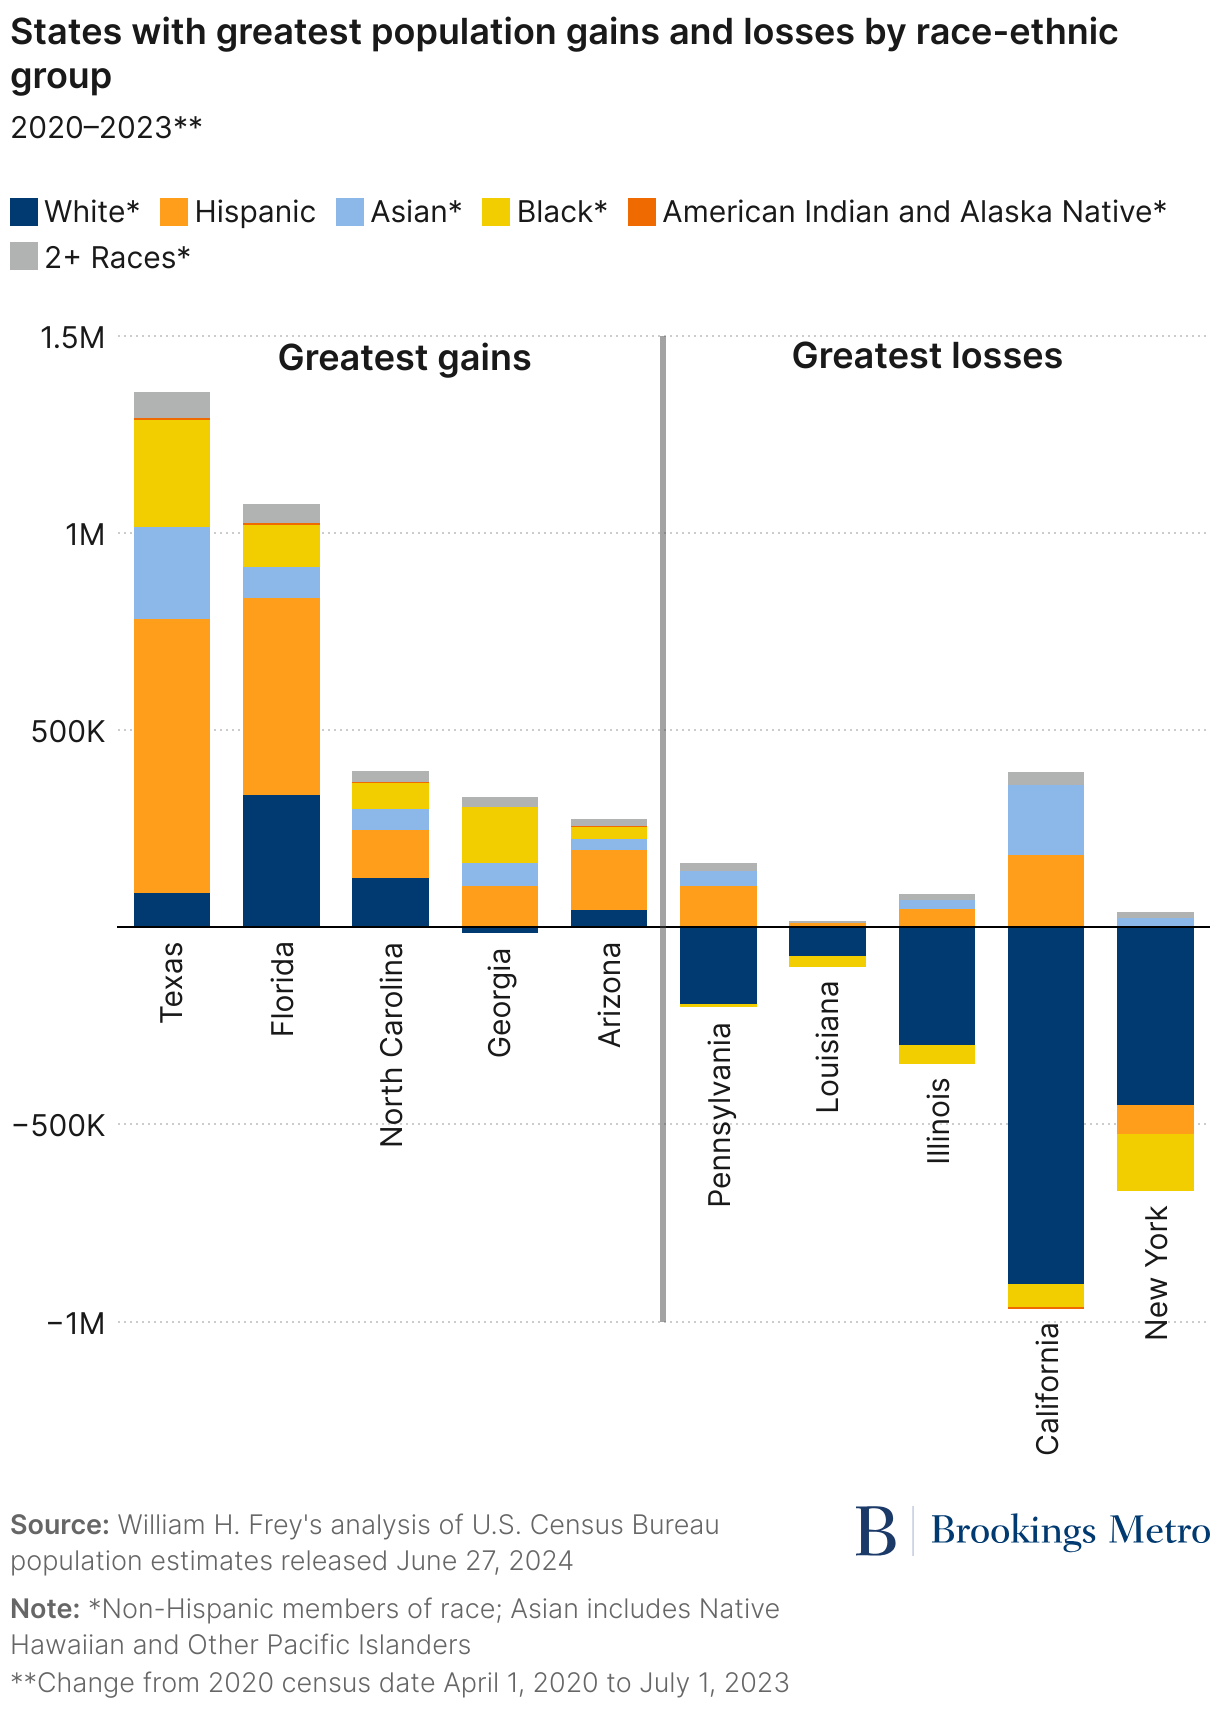
A different story emerged among the states with the greatest population losses. Among these, white populations accounted for most of the declines. This trend is depicted in Figure 3 for the states that weathered the greatest population losses: New York, California, Illinois, Louisiana, and Pennsylvania. In each of these states, white losses dominated overall losses, though in New York there also were significant Black and Hispanic population losses. In contrast, minority gains in California and Pennsylvania were sizable enough to reduce overall population losses for those states.
In contrast to the pervasive white population losses across states, most other racial groups showed widespread population gains (see downloadable Table C). Both Hispanic and Asian populations registered gains in all states except one (New York and Hawaii, respectively), with Hispanic residents showing the greatest gains in the Sun Belt states of Texas, Florida, California, Arizona, and North Carolina. The states with the biggest Asian population gains were Texas, California, Washington, Florida, and Georgia. The Black populations grew in 37 states, led by Texas, Georgia, Florida, and North Carolina, with the greatest losses in New York, California, and Illinois. And the AIAN population showed small gains in 40 states.
Major metro areas reflect extremes: minority gains and white losses
Just as state population shifts highlight minority growth in the states with the greatest population gains and white losses in the states with the biggest population declines, this pattern is magnified among major metro areas—those with populations exceeding 1 million (see downloadable Table D).
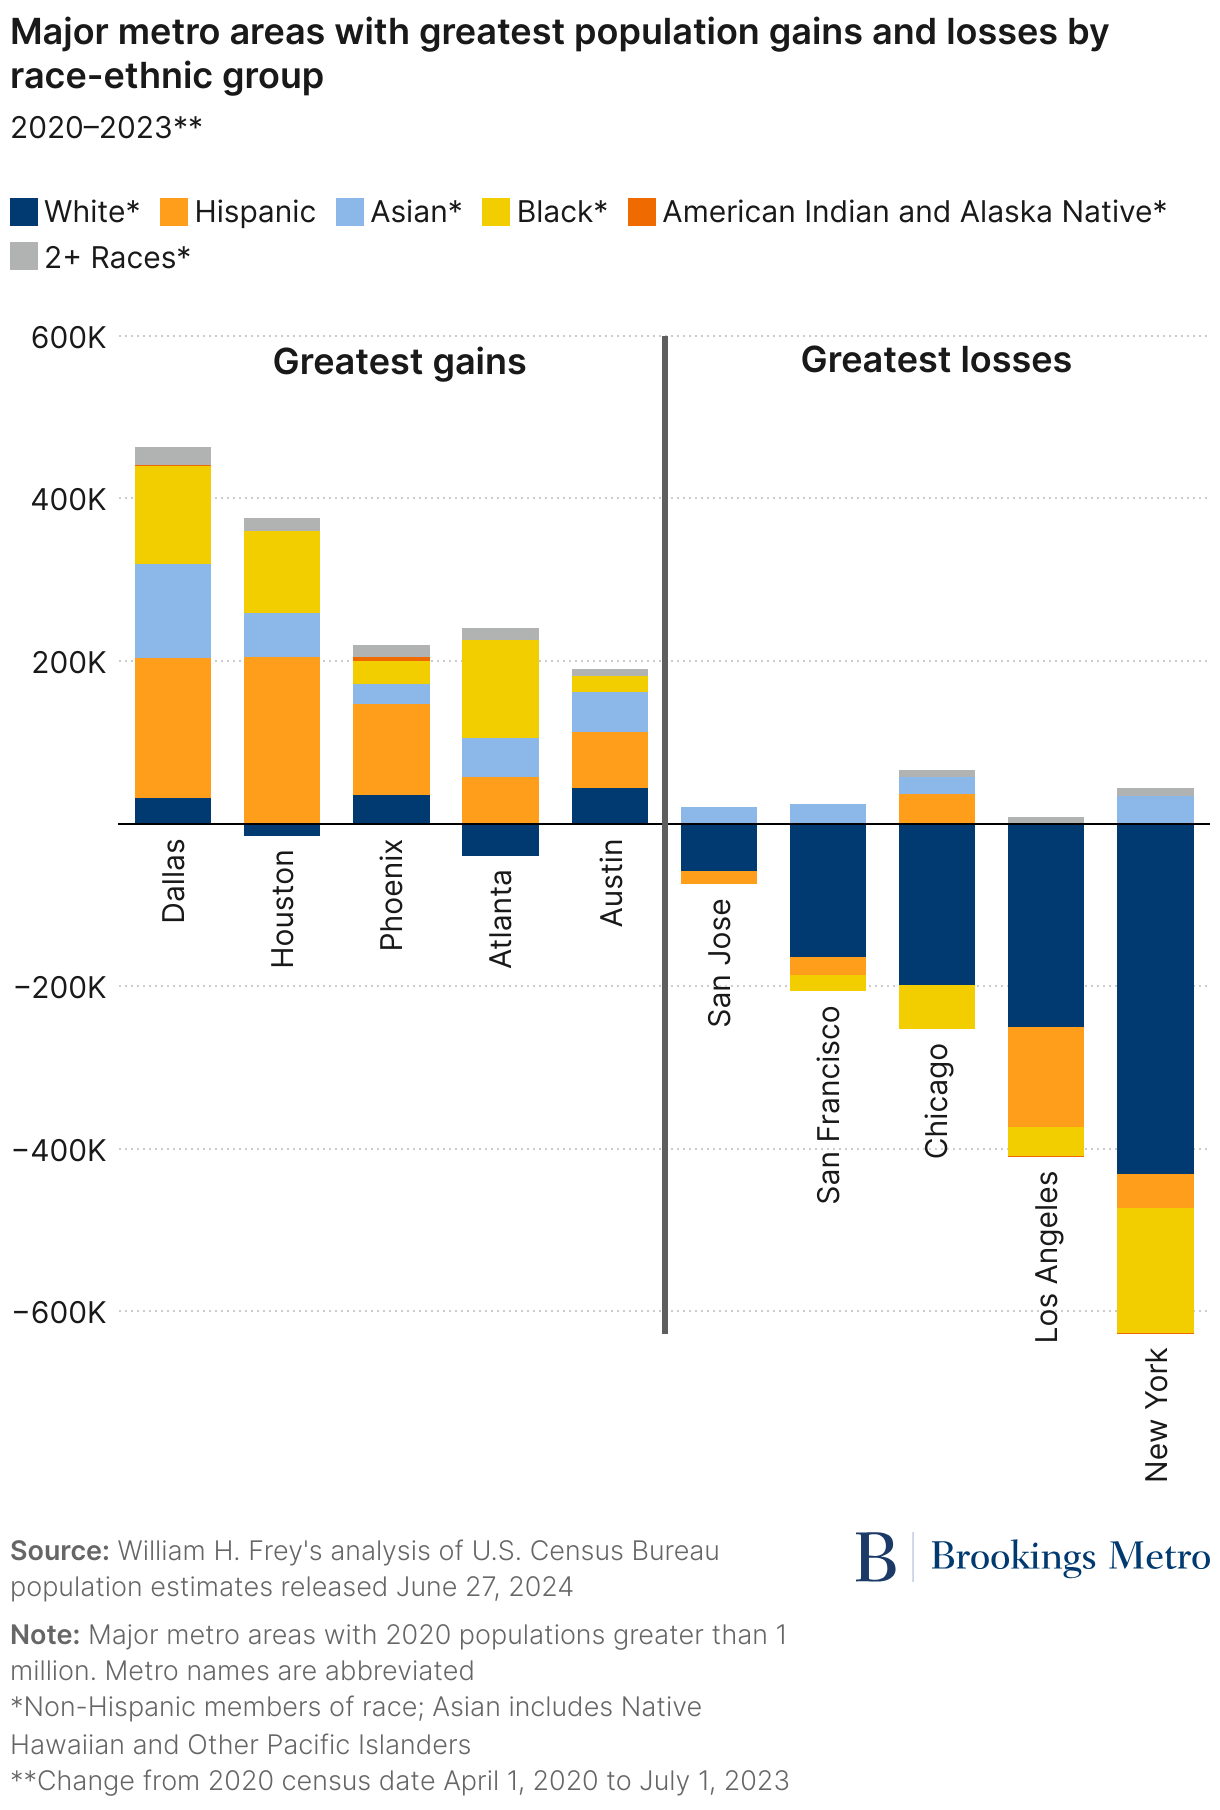
Figure 4 depicts the five metros with the greatest population gains—the Texan trio of Dallas, Houston, and Austin along with Phoenix and Atlanta. In each of these metros, minorities made up the largest contributions to 2020–2023 population gains, with Houston and Atlanta experiencing white losses over this period.
The largest growth contributions in four of these metros came from the Hispanic population though substantial Black and Asian contributions occurred in Dallas and Houston. The outlier among these metros was Atlanta, where the Black contribution was biggest. Dallas, Atlanta, and Houston showed the largest gains among Black populations of all metros in 2020–2023. Dallas, Houston, Austin, and Atlanta were among the five metros that gained the most Asian residents, and Houston, Dallas, and Phoenix were in the top four for greatest gains in their Hispanic populations.
The five major metros with the greatest population declines included three Californian areas (Los Angeles, San Francisco, and San Jose) as well as New York (the largest decliner) and Chicago. In each, white losses were by far the greatest, though in New York, Los Angeles, and San Francisco, there were sizable losses in the Hispanic and Black populations as well. Notably, these areas registered sharp overall population losses during the prime pandemic year of 2020–2021. Chicago also experienced a decline in its Black population, the second-largest drop after New York.
Map 2 provides an overview of growth and decline patterns for the 56 major metro areas, emphasizing the contribution of white population changes to overall population change. Among these 56 areas, 41 experienced white population losses during the 2020–2023 period. Overall, 15 metros gained both total and white populations, 22 registered total population gains despite white losses, and 19 sustained both total and white population losses. Among the 15 that gained both total and white populations (including areas such as Dallas, Phoenix, and Austin), the white contributions to these gains were far less than half in most of them.
White losses are most pervasive in Snow Belt and non-metropolitan counties
The breadth of white population declines and widespread minority gains were also apparent across the nation’s 3,141 counties. Among these counties, 1,974 (63%) had white population losses in 2020–2023. The overall growth patterns are depicted in Map 3, which shows that 1,125 counties gained both total and white populations, 553 experienced total gains while seeing white population losses, and 1,421 counties weathered losses of their overall and white populations. (An additional 42 counties had white population gains but had overall population losses.)
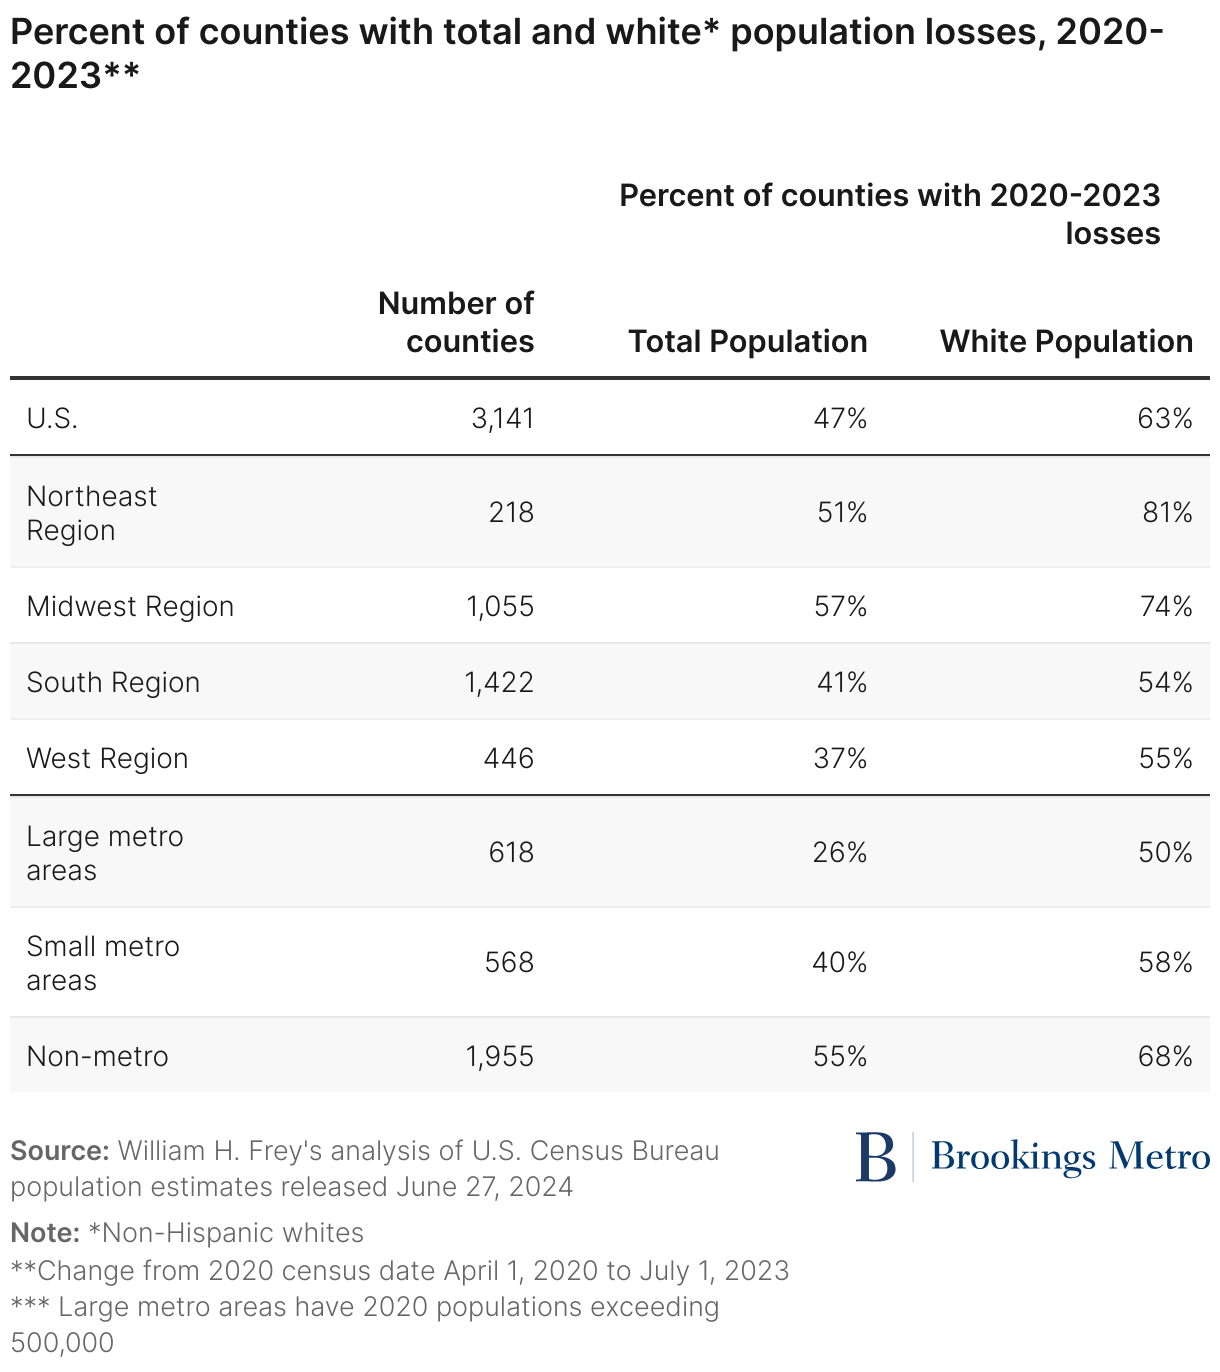
Table 1 provides a useful breakdown depicting the share of counties that lost population by region and metropolitan size. The shares of counties with white population losses were highest in the Northeast and Midwest regions (81% and 74%) and in non-metropolitan areas (68%). The share of counties with total population declines was lower in each region, especially in large metropolitan areas where only 26% of counties—mostly in urban cores—registered total population losses. Of the counties in large metros that experienced population gains, more than one-third also experienced white population losses. These counties contain some of the largest populations in the country. Thus, minorities have contributed substantially to large metropolitan population growth.
Minorities are essential for the growth of the youth population
Minority growth is especially vital for the nation’s youth under the age of 18. The white youth population has been declining nationally since 2000 and has continued to do so since the 2020 census. This is because proportionately fewer white women are in their prime childbearing ages, and fertility rates are lower among white than minority populations. Even with gains among some minority groups, the population decline in white youth has led to a total population loss in the nation’s youth.
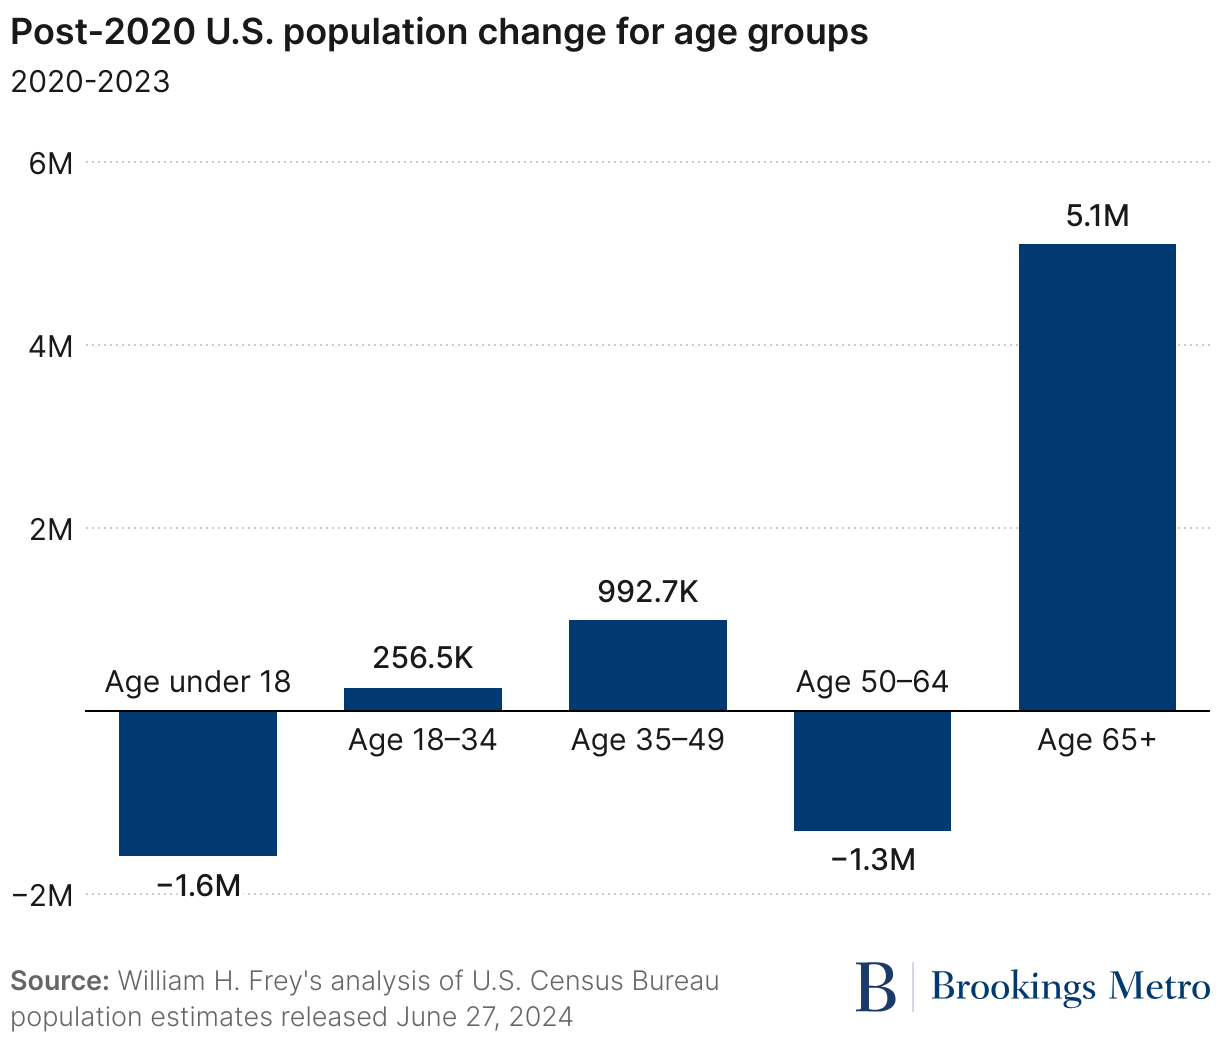
The left panel of Figure 5 shows that the nation’s total youth population declined by 1.6 million in the three-plus years between the 2020 census and 2023, mostly due to the population loss of white youth. In comparison, the age group with greatest gains (over 5 million) were seniors (age 65 and above), due primarily to the continued aging of the largely white baby boomer population.
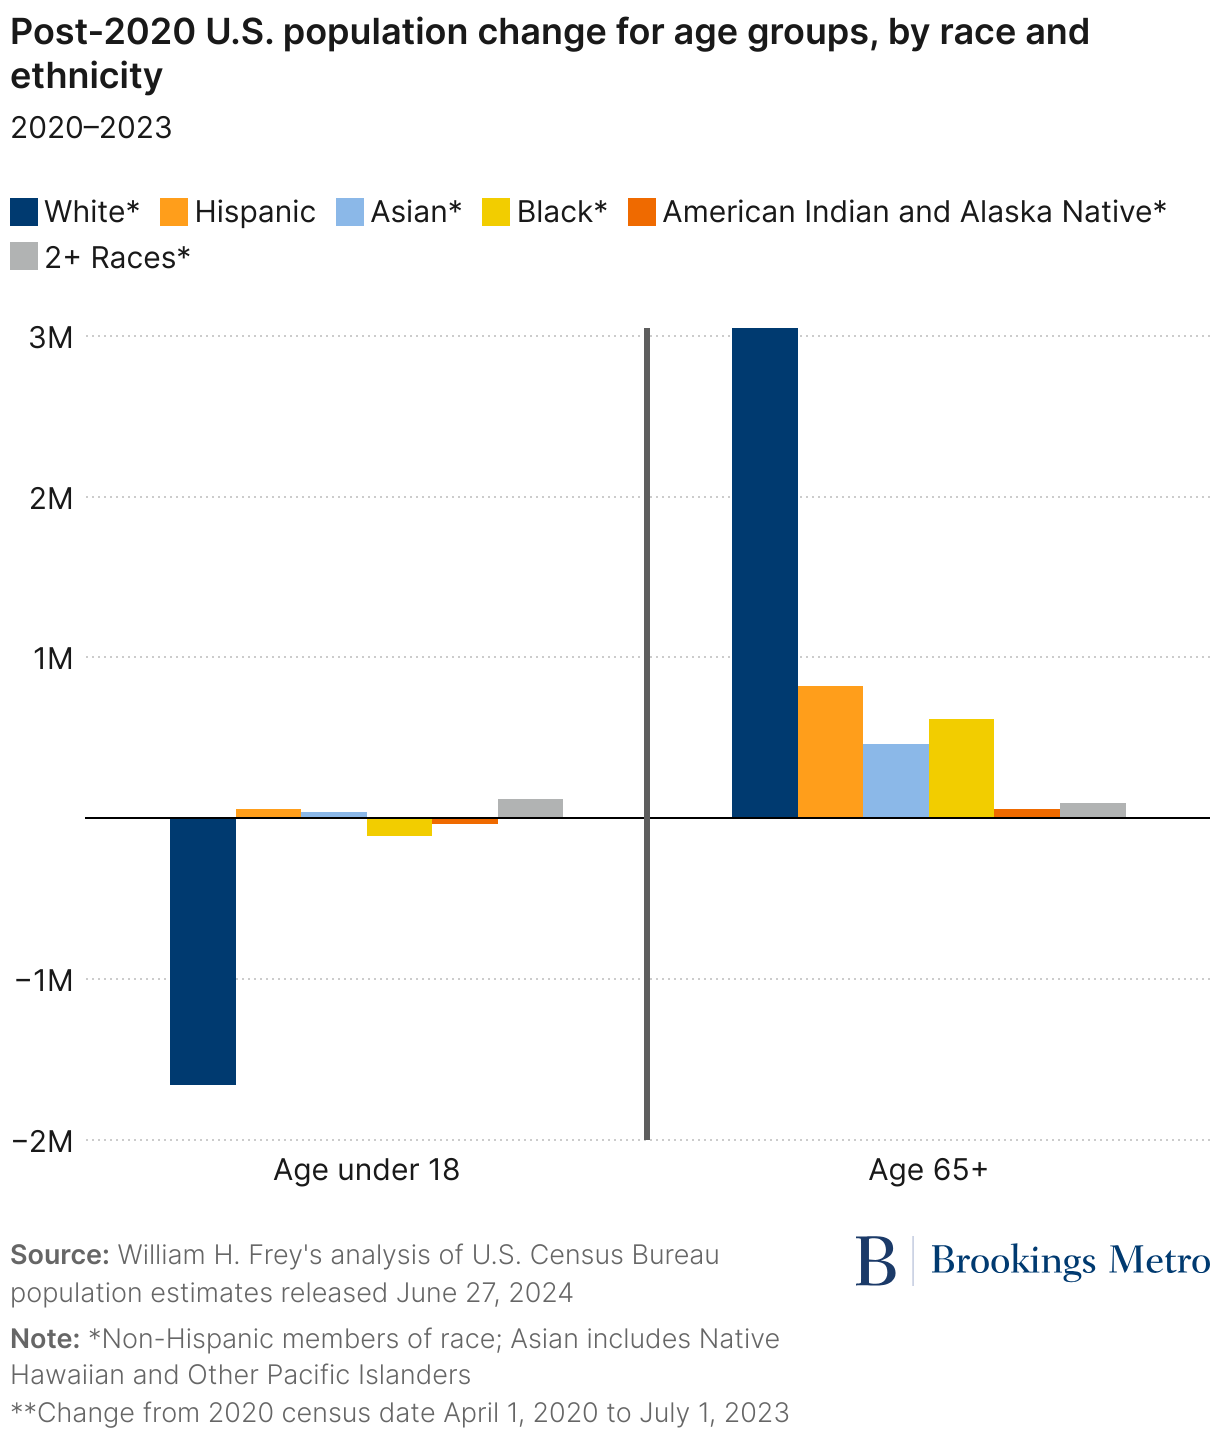
The continued decline of the nation’s youth population has contributed further to America’s overall aging. As was the case in the recent past, the white-dominated decline of this age group was mitigated somewhat by gains in some minority groups. As Figure 5 shows, the biggest gains in the youth population from 2020 to 2023 occurred for Hispanic and Asian youth as well youth identifying with two or more races. There were small population declines for Black and AIAN youth over this period.
Youth gains did occur in some states due mostly to the contributions of minority groups. Among the 50 states and the District of Columbia, just 12 showed youth population gains from 2020 to 2023, and only five of these exhibited white population gains as well. The remaining 39 states displayed both white and total youth population losses. While most of these showed minority youth gains, those gains did not outnumber white losses (see Map 4).
The states with the greatest youth population gains—Florida, Texas, South Carolina, North Carolina, and Tennessee—are all in the nation’s South region. In each of these states except Texas, Hispanic youth gains outnumbered all others, while population gains among Black youth predominated in the Lone Star State. The remaining seven states with overall youth population gains were in the West (Idaho and Montana), South (Oklahoma, Delaware, and Alabama), Midwest (South Dakota), and the District of Columbia (See downloadable Table E).
The states with the greatest youth population losses were California, New York, Illinois, Pennsylvania, and Michigan. Although white losses outnumbered those of all other groups in these states, each except Pennsylvania showed losses among their minority youth populations as well. California and New York registered youth declines among their Hispanic, Asian, Black, AIAN, and two-or-more race populations. Illinois and Michigan showed youth losses for each group except the latter. And in Pennsylvania, Black youth showed the largest minority declines.
Clearly, the decline of the white youth population is pervasive, both nationally and in all but five states. The Hispanic youth population was much more dispersed, registering gains in all but six states, while youth identifying as two or more races made gains in all but seven states, and Asian youth gained in all but 19 states. Each of these groups, together, continue to dominate national growth and represent the best hope of driving future growth in the nation’s young population.
Today’s diverse growth will lead to tomorrow’s multiracial America
The diversity of population gains, shown here for the post-2020 period, continues patterns observed in the past two decades when the nation’s white population began to slow and then eventually decline. Moreover, the transition is most important for the younger population, which experienced both overall and white losses. The overall losses would have been greater had it not been for minority population gains—especially in the Hispanic, two-or-more- races, and Asian populations. These groups are also benefitting from past and likely future immigration, though natural population increases (an excess of births over deaths among existing U.S. residents) are driving the bulk of gains among Hispanic residents and those of two or more races.
A useful picture of where the country is heading draws from recent Census Bureau population projections, which assume continued white population losses overall and at most young ages, as well as a level of immigration consistent with the nation’s recent past (see Figure 6).
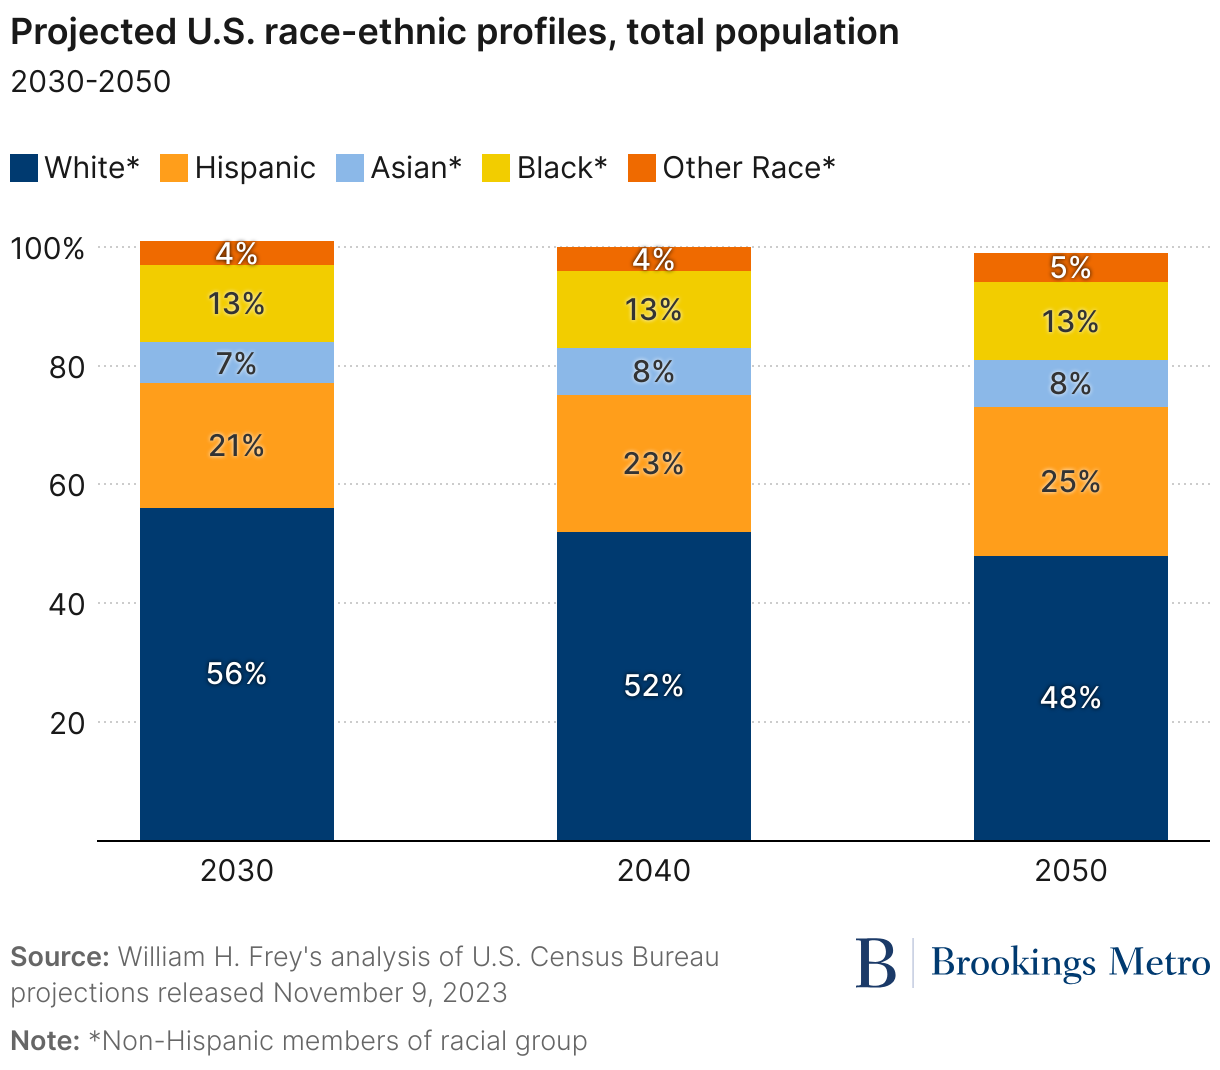
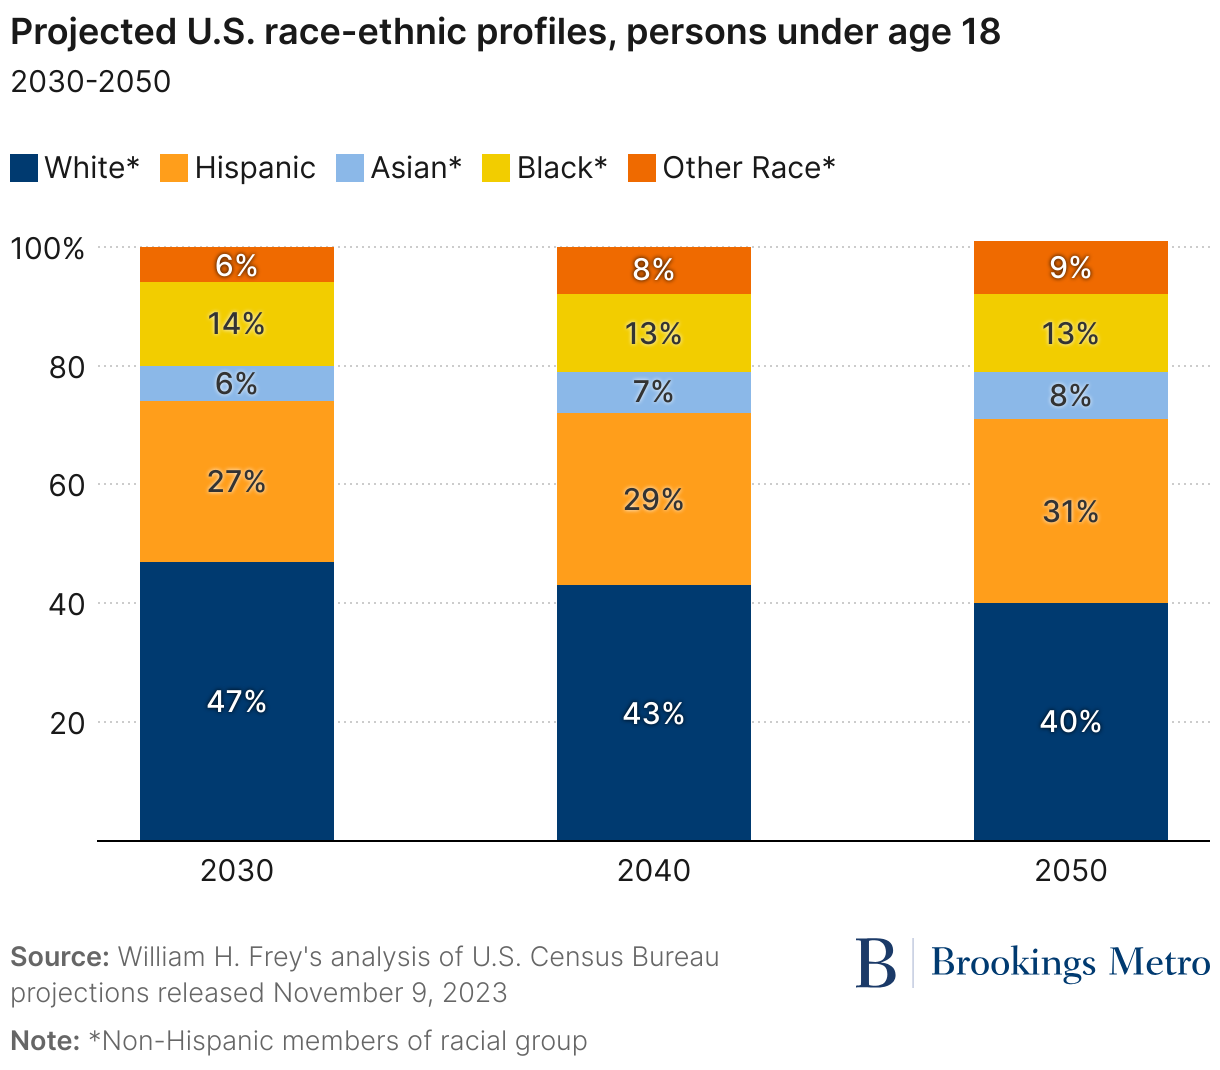
The projections show that Hispanic and other nonwhite groups will comprise 44 percent of the U.S. population in 2030, with Hispanic residents making up 21 percent. By 2050, these groups will make up more than half of the U.S. population with Hispanic residents comprising one-quarter of Americans. More importantly, the youth population, which is already “minority white,” will be 53 percent minorities in 2030 and 60 percent minorities in 2050, with the Hispanic shares of youth rising from 27 percent to 31 percent.
Immigration will certainly keep this aging nation growing and more diverse. But even with lower levels of immigration, the U.S. population will become more racially diverse. As a result, the future of the nation’s labor force productivity and economic well-being will rely heavily on the success and integration of today’s and tomorrow’s increasingly multiracial younger population. Although the term “diversity” has become a politically divisive one in conversations about policies ranging from affirmative action to diversity, equity, and inclusion programs, the changing demographics evident in these census statistics underscore the need to make education, employment, and related opportunities available to young populations of all racial and ethnic groups.
Author

-
Footnotes
- Other than Hispanic, all racial groups discussed here are non-Hispanic members of those races. Also, racial categories refer to persons identifying with one race alone. Those identifying with more than one race are classified in the category “two or more races.”
The Brookings Institution is committed to quality, independence, and impact.
We are supported by a diverse array of funders. In line with our values and policies, each Brookings publication represents the sole views of its author(s).