

Michigan has one of the nation’s largest Black populations, and its many Black-majority cities, towns, and neighborhoods have made substantial contributions to the state’s culture and history. According to the 2022 American Community Survey (ACS), Michigan has 1,550,153 Black residents (more than Louisiana, Alabama, and South Carolina), who represent 15.3% of the state population and 3.2% of the total U.S. Black population.
While Michigan is home to the nation’s largest Black-majority city—Detroit, which has an overall population of over 600,000—the state also has many more Black-majority cities and towns, including midsized cities such as Pontiac and Flint, and smaller municipalities such as Benton Heights and Muskegon Heights.
As we have demonstrated in other publications, including our Black Progress Index and study of well-being across American cities, while some Black-majority area populations have shorter life expectancies, lower rates of well-being, and less wealth, others show higher rates of longevity, thriving, and economic security despite living under similar federal or state policy realities. By comparing outcomes between Black-majority places, researchers can find areas that stand out and use them to better understand the community and economic factors, including civic action, that correlate with a higher quality of life.
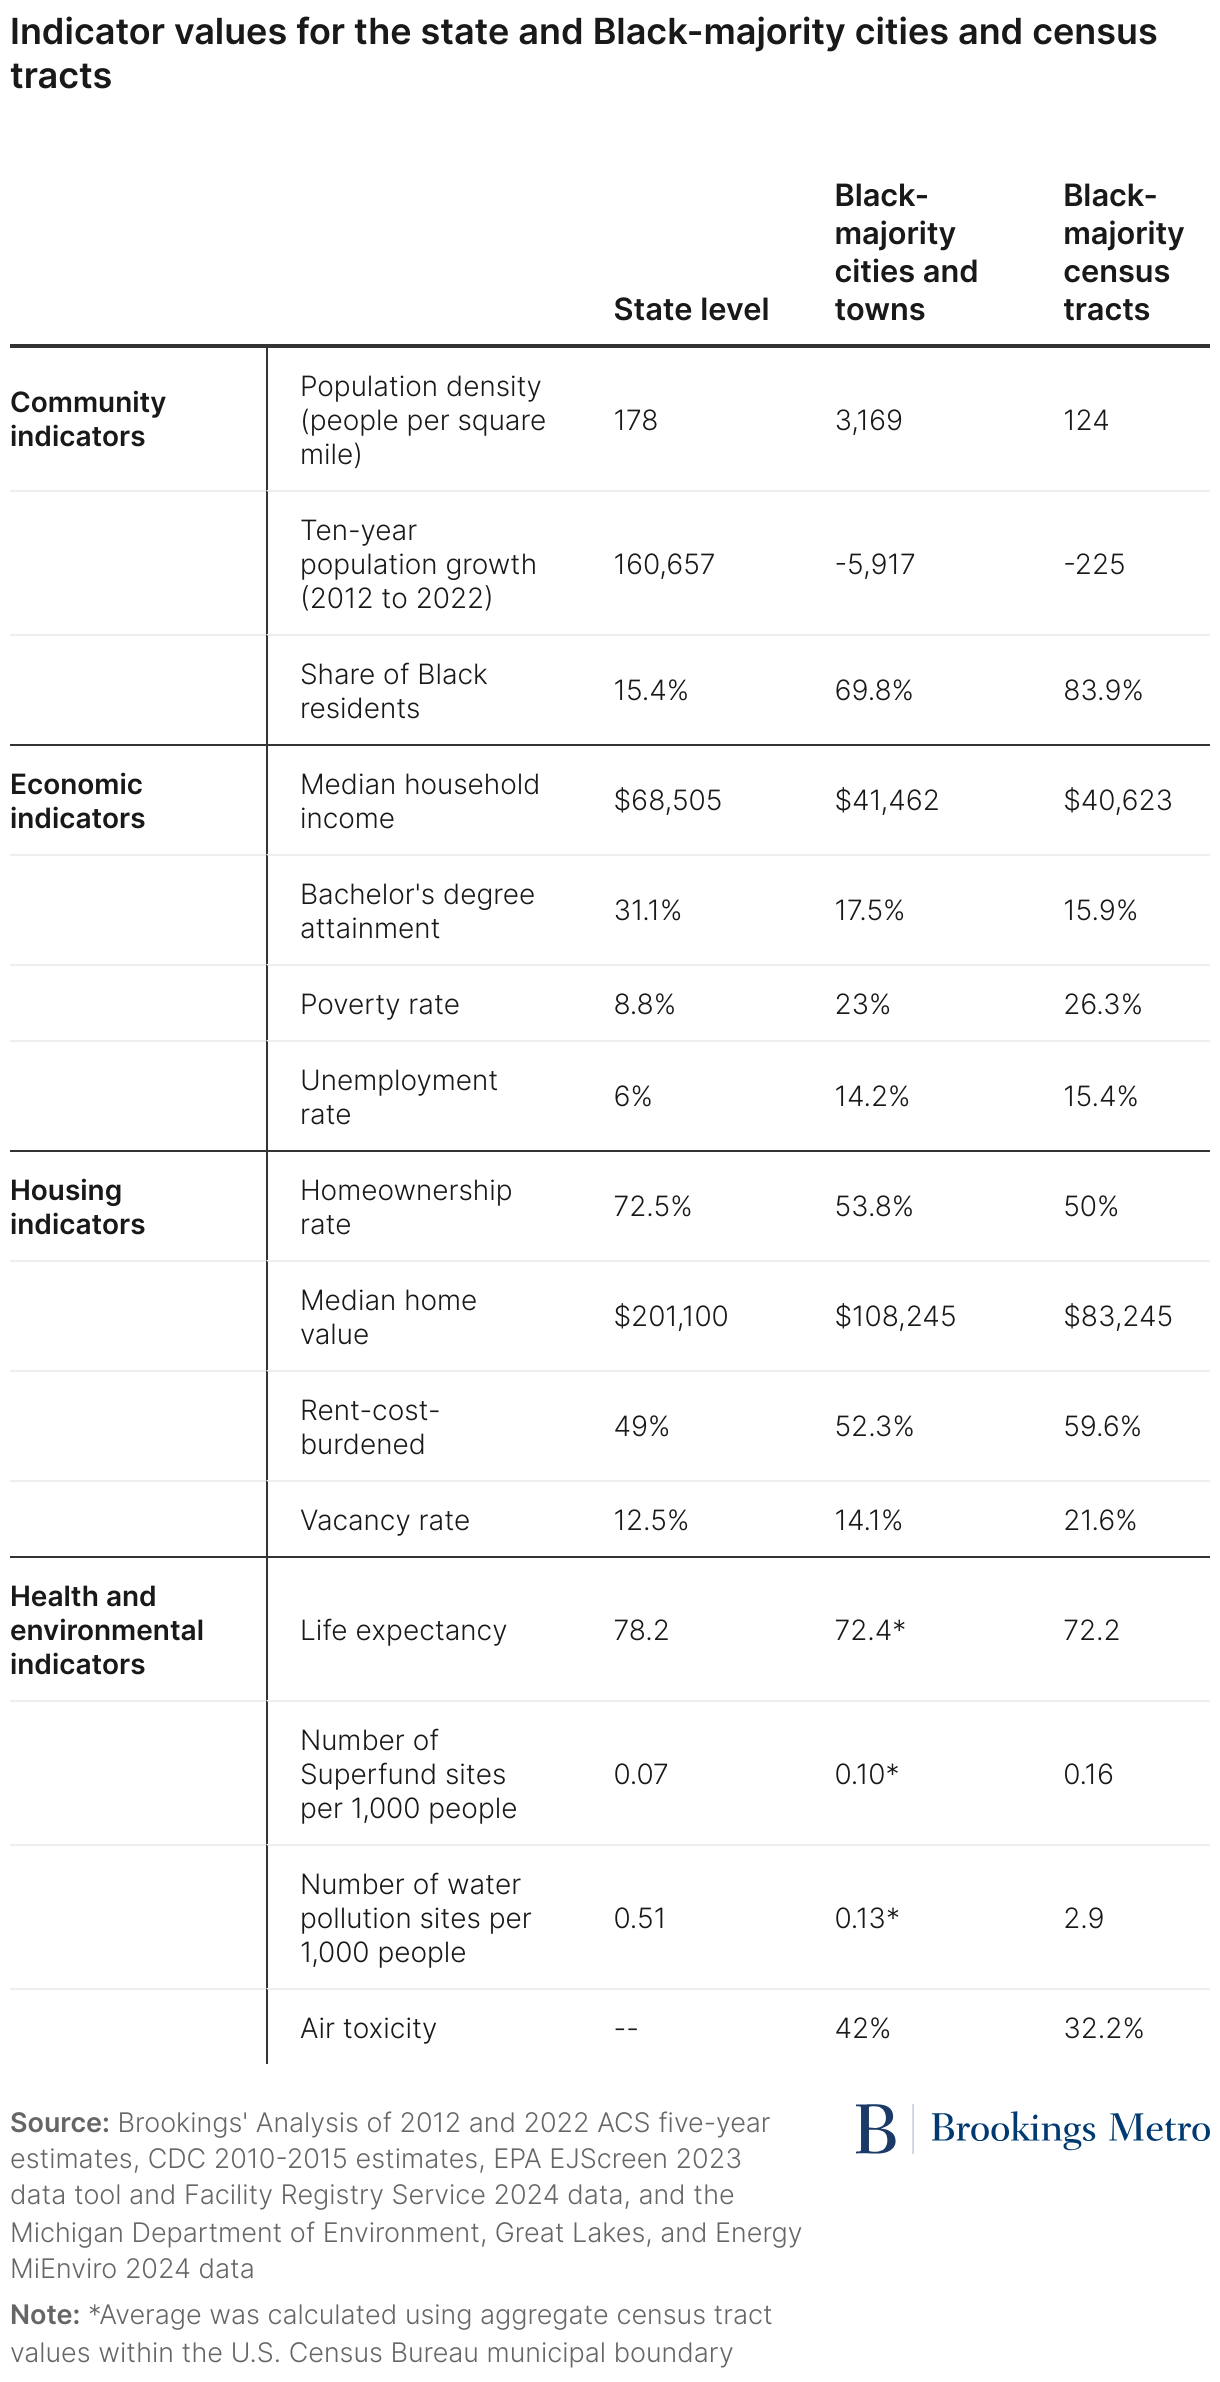
This analysis focuses on Black-majority places in Michigan—specifically, 39 cities, towns, and census tracts, which represent roughly 1,016,359 Black residents and comprise 65.6% of the state’s total Black population. To determine where quality of life for Black Michiganders is relatively high, the report compares outcomes across community, economic, housing, health, and environmental indicators. These comparisons highlight places that may hold lessons for how to improve quality of life among Black populations within the state and other cities as well.
While many of these places perform lower than the state average on different indicators (including homeownership, median household income, and life expectancy), some consistently score higher. In particular, suburbs in the wider Detroit metropolitan area (e.g., Southfield and Lathrup Village) as well as cities in the western part of the state (including Kalamazoo and Grand Rapids) are outperforming other Black-majority cities and neighborhoods, and in some cases, outperforming statewide averages. This report and interactive map explore these cases and others across Michigan to assess the quality of life for Black Michiganders.
How the Great Migration, redlining, and urban renewal shaped Michigan’s Black cities
The state of Black-majority cities and neighborhoods across Michigan was influenced by at least three overlapping periods of place-based racial policy: the Great Migration (1910 to 1970), redlining and white flight (1935 to 1940), and urban renewal and highway expansion (1950 to 1970). For Black Michiganders, these periods led to substantial policy changes that affected where people lived, the types of housing they could afford, and the character of their neighborhoods.
From 1910 to 1970, about 6 million Black Americans moved from the American South to the Northern, Midwestern, and Western United States in what would become known as the Great Migration. This was the most influential factor contributing to the influx of Black Americans into Michigan during the early to mid-20th century. Their motivations were numerous: Many were fleeing the violence of the Jim Crow South, while others came in search of factory jobs in the nascent automotive industry, where General Motors and Ford provided a prime opportunity for Black workers seeking jobs. In 1900, approximately 53% of Michigan’s Black population was born in the state; by 1940, this number decreased to only about 28%, with most Black migrants arriving from Southern states. Between 1910 and 1920 alone, Detroit experienced a 611% surge in its Black population.
However, Black migrants’ arrival in the North was not the end of their struggle. Motivated by the racist fear of Black people and the desire to perpetuate white economic supremacy, from 1935 to 1940, the Home Owners’ Loan Corporation divided neighborhoods throughout the nation into racially separated risk maps that determined residents’ eligibility to receive public and private housing loans—a process known as “redlining.” Areas with a large Black and BIPOC presence were marked as red (or “hazardous”) while locations with fewer people of color were marked as yellow (“declining”) or green (“best”). Eleven Michigan metro areas and their adjacent municipalities were redlined, all of which are included in this analysis. The effects of this policy can still be felt today, as many Michigan communities remain racially divided in ways similar to their redlined maps. White flight from these Black-majority areas—during and after redlining—exacerbated Black-white segregation between municipalities, creating Black-majority places and white-majority places adjacent to one another. While redlining in other states segregated communities within cities, in Michigan, almost whole portions of Black-majority cities were redlined, helping to cement the state’s city-by-city segregation.
Finally, the period of public infrastructure construction in the mid-1900s known as “urban renewal” further disrupted Black household stability. Legislation such as the Housing Act of 1949 and Federal-Aid Highway Act of 1956 enabled government entities to legally raze Black communities by deeming them “slums,” and then replace them with infrastructure such as highways and irrigation systems. These included neighborhoods such as Detroit’s Black Bottom and Paradise Valley, which were destroyed entirely. Bereft of their homes and stability, Black households were relocated into housing projects, which were often of lower quality.
These three periods helped shape where Black people in Michigan live today, their wealth profiles, and their livelihoods—and the effects are visible, for example, in Black Michiganders’ higher poverty and unemployment rates compared to the state average. This report does not examine changes in outcomes from these periods, but they do offer context.
Methodology
This report aims to provide an overview of the health, wealth, and environment of Black Michiganders and their communities in order to find where Black people in the state are doing well. We focus on cities, towns, and census tracts as units of analysis rather than households, to capture the complex history between place, racism, and public policy. For the purposes of this study, “neighborhoods” refer to any cluster of census tracts within a city or town. Moreover, this study does not compare Black Michiganders to residents of other races, but rather compares Black-majority places to each other, using statewide averages as a baseline. High-performing places are those that exceed this baseline.
To locate Michigan’s Black communities, we compiled a list of 39 cities and towns (see Map 1) that were either Black-majority or contained at least one Black-majority census tract, using demographic data from the 2022 ACS five-year estimates. This report categorizes both census tracts and cities as Black-majority if 50% or more of the population identifies as “Black alone or in combination with any other race.” These places house roughly 1,045,400 Black residents, comprising 67.4% of Michigan’s total Black population. Of the 39 cities and towns identified, 17 are Black-majority, while the remaining 22 have less than 50% Black residents but at least one Black-majority census tract. Additionally, 18 municipalities are located within the wider Detroit-Warren-Dearborn metropolitan statistical area (MSA). The Benton Harbor, Flint, and Saginaw metro areas—which include the surrounding municipalities—have some of the highest concentrations of Black communities in Michigan. All 39 cities and towns are in the southern half of the state, with none found north of the Bay City metro area.
For each place, we selected indicators across four categories listed in Table 1 and visualized in Map 1: community, economy, housing, and health/environmental. We chose these categories to supply a multifaceted look at life in the places where Black Michiganders live. Economic, housing, and community indicators were compiled using 2022 ACS five-year estimates. This includes the dissimilarity index, which measures racial segregation within each place following the methods laid out by Rodney Green of Howard University.
Health and environmental indicators were compiled for 788 census tracts using the Environmental Protection Agency’s (EPA) EJScreen data tool and Facility Registry Service; the Michigan Department of Environment, Great Lakes, and Energy’s MiEnviro Portal; and the Centers for Disease Control and Prevention’s (CDC) life expectancy estimates. Due to a lack of data in nonresidential areas, 23 census tracts were excluded from some demographic estimates.
Environmental data was chosen to reflect pollution across air, land, and water sources and are used as indictors of environmental and physical health in Black-majority places. Firstly, we track proximity to Superfund sites—places where hazardous waste has been dumped or improperly managed and poses a health risk to those around it, and which can contain a myriad of toxins and life-threatening chemicals according to the EPA. Similarly, we track water pollution sites, which are places that have at least one violation under the Clean Water Act, including pollutants from industrial, municipal, and agricultural discharges to any water source, including groundwater. Water pollution was specifically added to reflect the many water crises in Black-majority Michigan communities such as Flint and Benton Harbor. Lastly, we track air toxicity, which includes chemicals that can cause various health problems, including cancer and other reproductive, developmental, and respiratory issues. The indicator we use is based on the EPA’s Risk-Screening Environmental Indicators (RSEI) model, which communicates the toxicity of an area’s air. This report converts a place’s air toxin measurement into a percentage, which can be understood as a portion of the state’s total air pollution.
Comparing Black-majority places to the state baseline
While many quality-of-life indicators in Michigan’s Black-majority places are on average lower than the state baseline, there are also Black-majority places that score higher. Table 1 summarizes the average values of our indicators at the state level, for Black-majority cities and towns, and for all Black-majority census tracts combined. This section discusses these differences, while also comparing outcomes across Black-majority places. Acknowledging that every place has its strengths and weaknesses, there are no places that outperform all others in every category. Rather, this report highlights three case studies that perform relatively well in different categories.
Community indicators
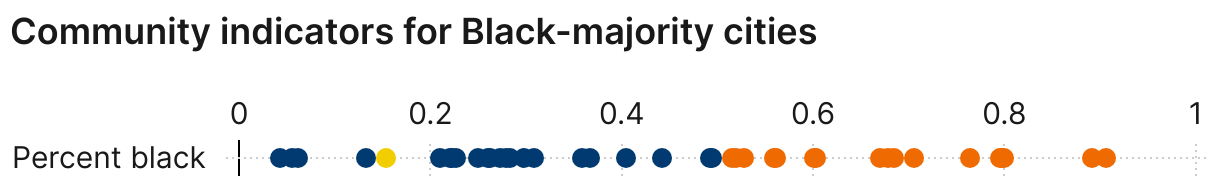
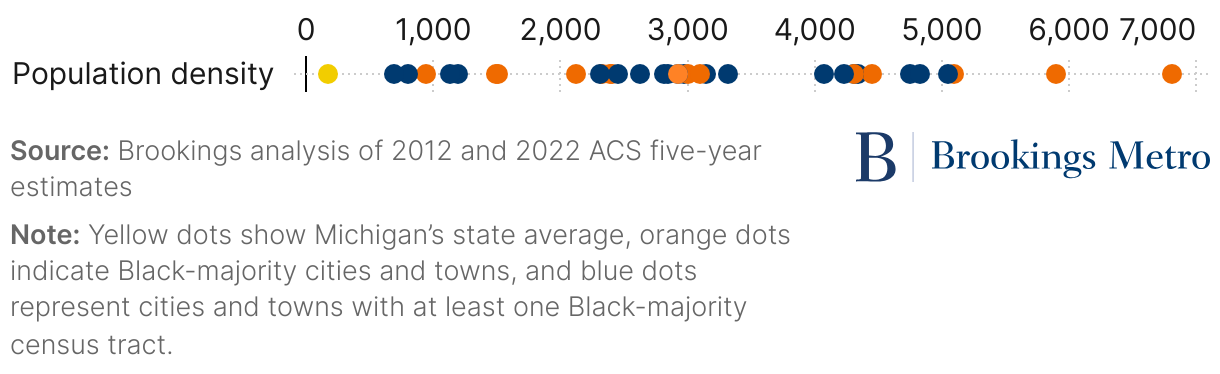
Community indicators show population change and density, the share of Black residents in an area, and a unique measure of racial segregation called the “dissimilarity index.” From 2012 to 2022, Michigan’s total population increased by 160,657, or 1.6%, while Michigan’s Black population increased by 3%. In the same period, the population living within Black-majority cities declined marginally: about 6,000 residents. Compared to Michigan as a whole, Black-majority cities and towns are more densely populated than the state average, while Black-majority census tracts, which are spread across the state, are less densely populated. While 15.4% of Michigan residents are Black (slightly higher than the national average), roughly 70% of Michigan’s Black-majority city and town residents are Black, and 84% for Black-majority census tracts.

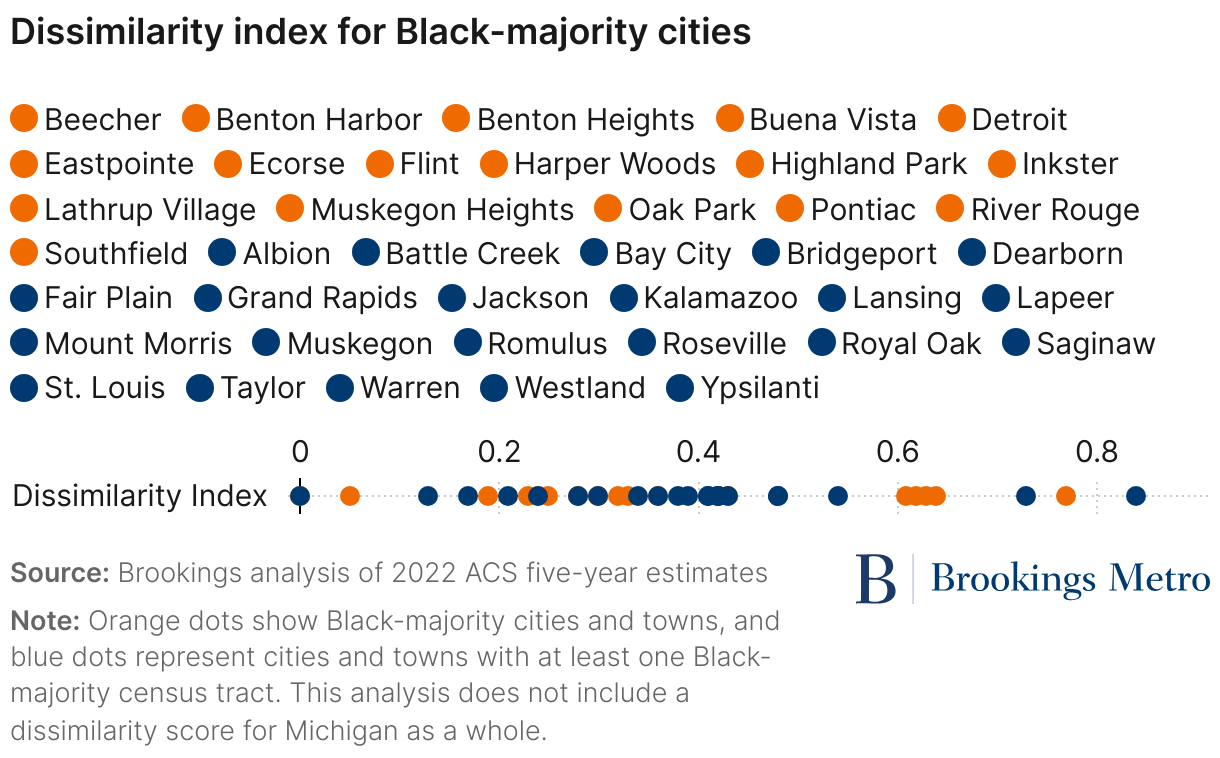
The dissimilarity index in Figure 2 shows the spectrum of racial segregation within the 39 Michigan cities and towns in this report, with zero representing full integration and 1 representing full segregation. Compared to other states, segregation in Michigan occurs on a city-by-city basis. Perhaps unsurprisingly, then, in the state’s more racially diverse cities—such as St. Louis, Benton Heights, and Flint—racial segregation is comparatively higher.
There is a wide variety of dissimilarity within these Black-majority places, with no strong correlation to density or size. (Lathrup Village and Mount Morris have been left out of the dissimilarity index since they contain fewer than three census tracts.) There is a cluster of cities between 0.6 and 0.7, which is on the higher end of the dissimilarity index; these include Detroit, Flint, River Rouge, and Ecorse. On the other end, Beecher and Muskegon Heights—two suburbs of larger metro areas—rank lower on segregation, likely due to their relatively high concentration of Black residents. Beecher (which sits north of Flint) is 67% Black, and Muskegon Heights (outside of Muskegon) is nearly 80% Black.
Economic and housing indicators
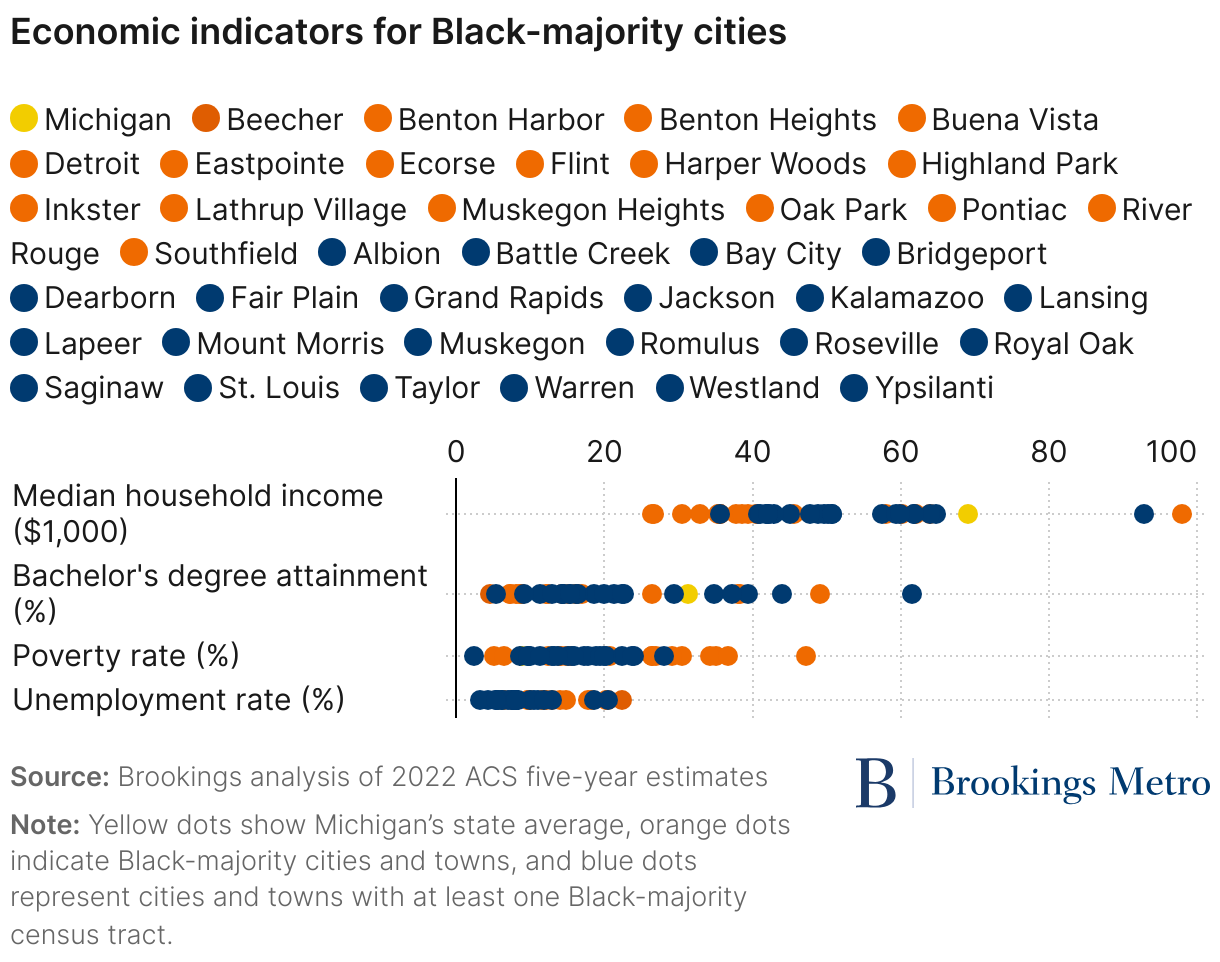
Economic and housing indicators include eight standard variables, as shown in Table 1. On average, Black-majority cities and towns in Michigan have lower median household incomes and educational attainment than the state average. Median income is roughly $27,000 less and educational attainment, at 17.5%, is roughly half the state average. However, when breaking up indicators by location, the economic security of Black Michiganders varies. As Figure 3 shows, Lathrup Village and Royal Oak—two Northwestern suburbs of metro area Detroit—boast median household incomes over 30% higher than the state average (roughly $97,750 and $92,800, respectively). Bachelor’s degree attainment also varies widely, from 4.5% of adults in Beecher to 49.1% in Lathrup Village. In descending order, seven cities and towns all rate higher in educational attainment than the state average of 31.1%: Lathrup Village, Ypsilanti, Grand Rapids, Oak Park, Southfield, Kalamazoo, and Dearborn.
Poverty and unemployment rates in Michigan’s Black-majority places are on average higher than throughout the state. Poverty rates—or the percentage of families living below the poverty level of $23,280 per year—are nearly three times higher in Black-majority places than the statewide average. However, in four towns, all of which are concentrated in the suburbs around Detroit, the poverty rate is lower than the state average of 8.8%, dipping down to 2.3% in Royal Oak.
Unemployment rates are nearly double in Black-majority cities and towns compared to the state average of 6%, but more geographically varied. The lowest unemployment rates are found in Royal Oak, Lapeer, Westland, Bridgeport, and Grand Rapids.
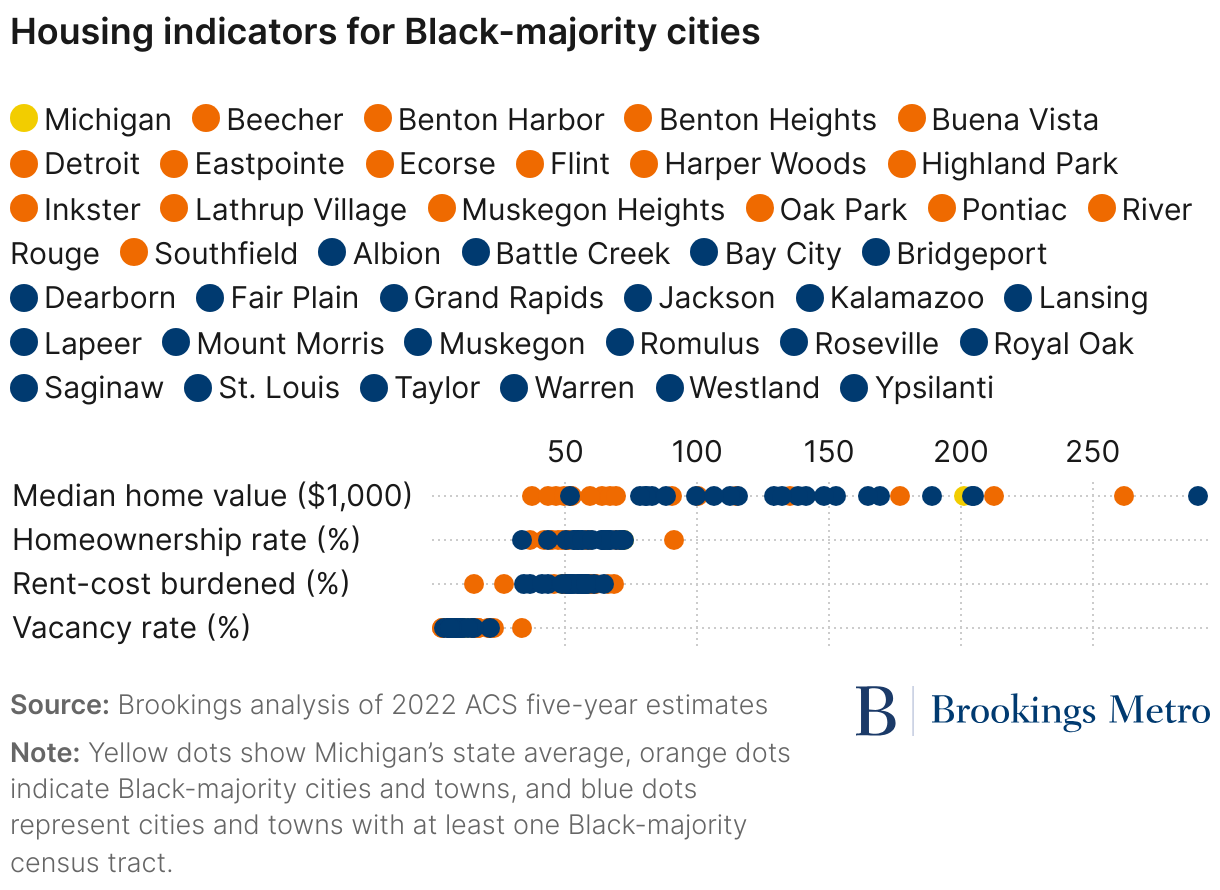
In terms of housing, Michigan’s homeownership rate is relatively high: 72.5%, compared to the national average of 64.8%. However, vacancy rates are also high: 12.5%, compared to 10.8% nationally. Michigan’s Black-majority cities and census tracts fall below both the state and national homeownership averages, but as shown in Figure 4, the rate varies widely, with 12 cities in this study above the national average and one, Lathrup Village, ranking above the state average, at 91.2%. On the other hand, vacancy rates in Black-majority places are higher than the statewide average, yet two-thirds, or 26 cities of the cities in this report, have lower vacancy rates than the state average.
Median home values in Black-majority census tracts are less than half that of the state average, but again, value varies substantially by city. In Beecher, for example, the median home value is $37,500—substantially lower compared to Royal Oak, where the median value is $289,800. The median home value for all Black-majority cities and towns was $108,245. Five cities and towns rank above the state average of $201,100: Royal Oak, Lathrup Village, Southfield, Ypsilanti, and Grand Rapids.
In terms of housing affordability, the statewide percentage of rent-cost-burdened households—or those paying more than 30% of their income on rental costs—was 49%, compared to 52.3% for Black-majority cities and towns on average and 59.6% for Black-majority census tracts. However, in nine of the 39 cities (varying in population and size), proportionally fewer renters were cost-burdened compared to the state average: Lathrup Village, Benton Heights, Royal Oak, Bridgeport, Taylor, Romulus, Ecorse, and Westland.
Health and environmental indicators
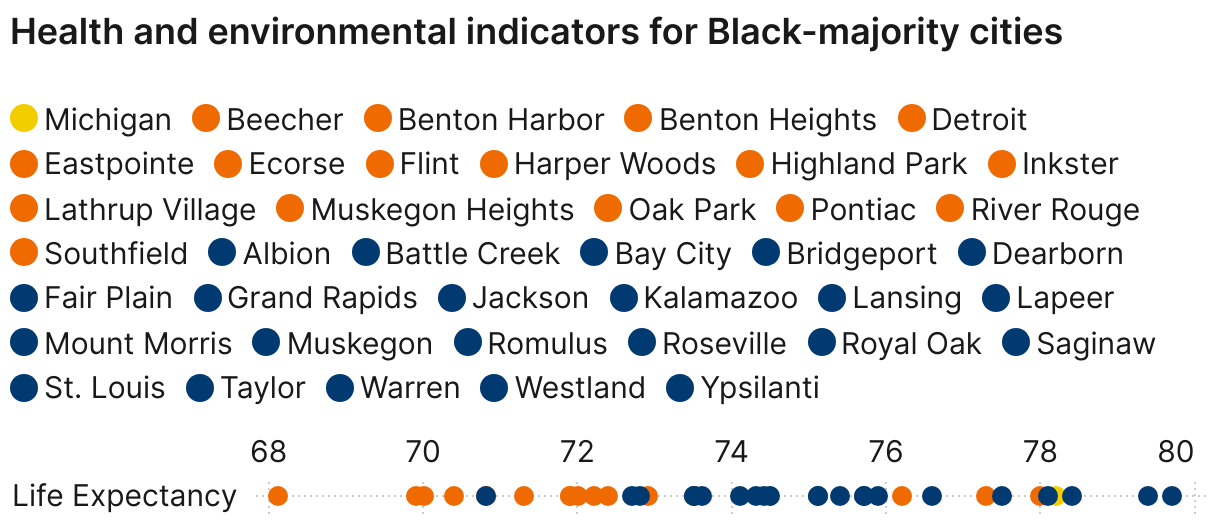
Health and environmental indicators include life expectancy and measures of exposure to various types of pollution. According to our Black Progress Index, the predicted life expectancy for Black people in the United States is 74.5 years. In Michigan, life expectancy for all residents is about four years longer: 78.2. But in Michigan’s Black-majority cities and census tracts, the average is lower: 72.4 and 72.2 years, respectively. Of the cities in our study, Bridgeport, Dearborn, and Royal Oak have higher life expectancies than the state average.
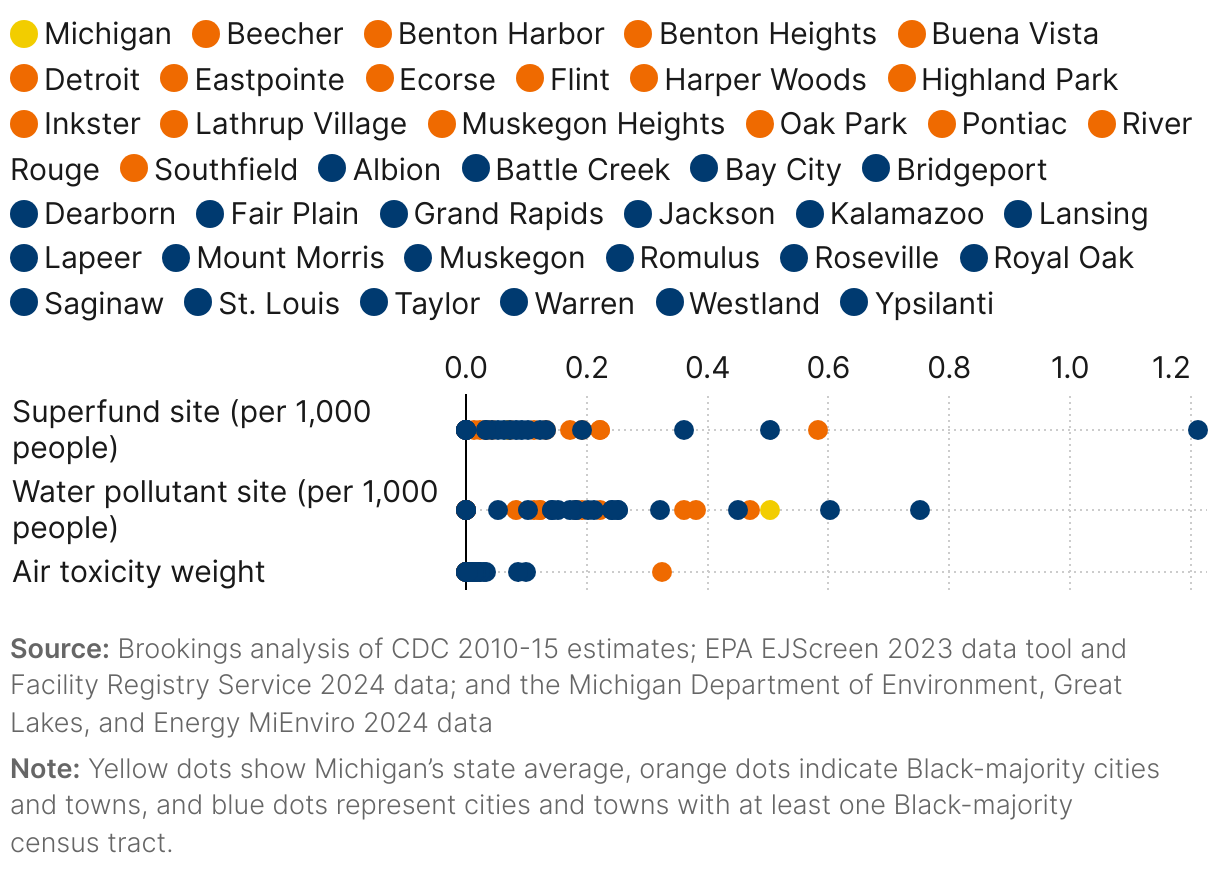
Focusing on other environmental indicators can discern what else might be affecting the health of Black-majority area residents. Table 1 shows that in Michigan, for every 1,000 people in a census tract, there is less than one Superfund site: a rate of .07 per 1,000 people. However, in Black-majority cities and census tracts, this likelihood increases, with an average of 0.10 and 0.16 Superfund sites per 1,000 people per census tract, respectively. For water pollution, the likelihood of an EPA violation is lower in Black-majority cities and towns (0.13 per 1,000 people) than the state average (0.5 per 1,000 people). But the average number of EPA water pollution violations is much higher in Black-majority census tracts: 2.9 per 1,000 residents. Lastly, air toxins are measured by concentration and can be understood as a portion of the state total; these vary the least of all environmental indicators across place. Black-majority cities and towns collectively contain 42% of air toxins in the state of Michigan, and Black-majority census tracts collectively contain 32.1% of air toxins, despite being a geographic minority of the state.
Which indicators impact life expectancy?
This analysis finds Black-majority places vary widely across economic, housing, health, and environmental indicators. However, there are trends found throughout the 39 cities and towns in this report indicating that some variables, such as median home value and education, are stronger and more consistent predictors of a longer life expectancy than others. Life expectancy is frequently used as a proxy for quality of life in studies of well-being because it summarizes many of the place-based factors that can impact peoples’ lives in positive or negative ways. This section discusses the correlations between life expectancy and the other indicators in this study to better understand which indicators may be driving a higher quality of life in certain cities and towns across the state.
Across Michigan, life expectancy in Black-majority cities differs by almost 12 years, ranging from 79.7 in Bridgeport to 68.3 in Benton Harbor (well below the state average of 78.2). Black-majority cities’ average life expectancy in our sample is 74.1—roughly four years below the state baseline. As shown in Figure 6, while life expectancy is negatively correlated with the percentage of Black residents (meaning that cities with a higher proportion of Black residents typically had a lower average life expectancy), some cities such as Lathrup Village, Oak Park, Southfield, and Saginaw have both higher-than-average life expectancy and a Black population greater than 50%.
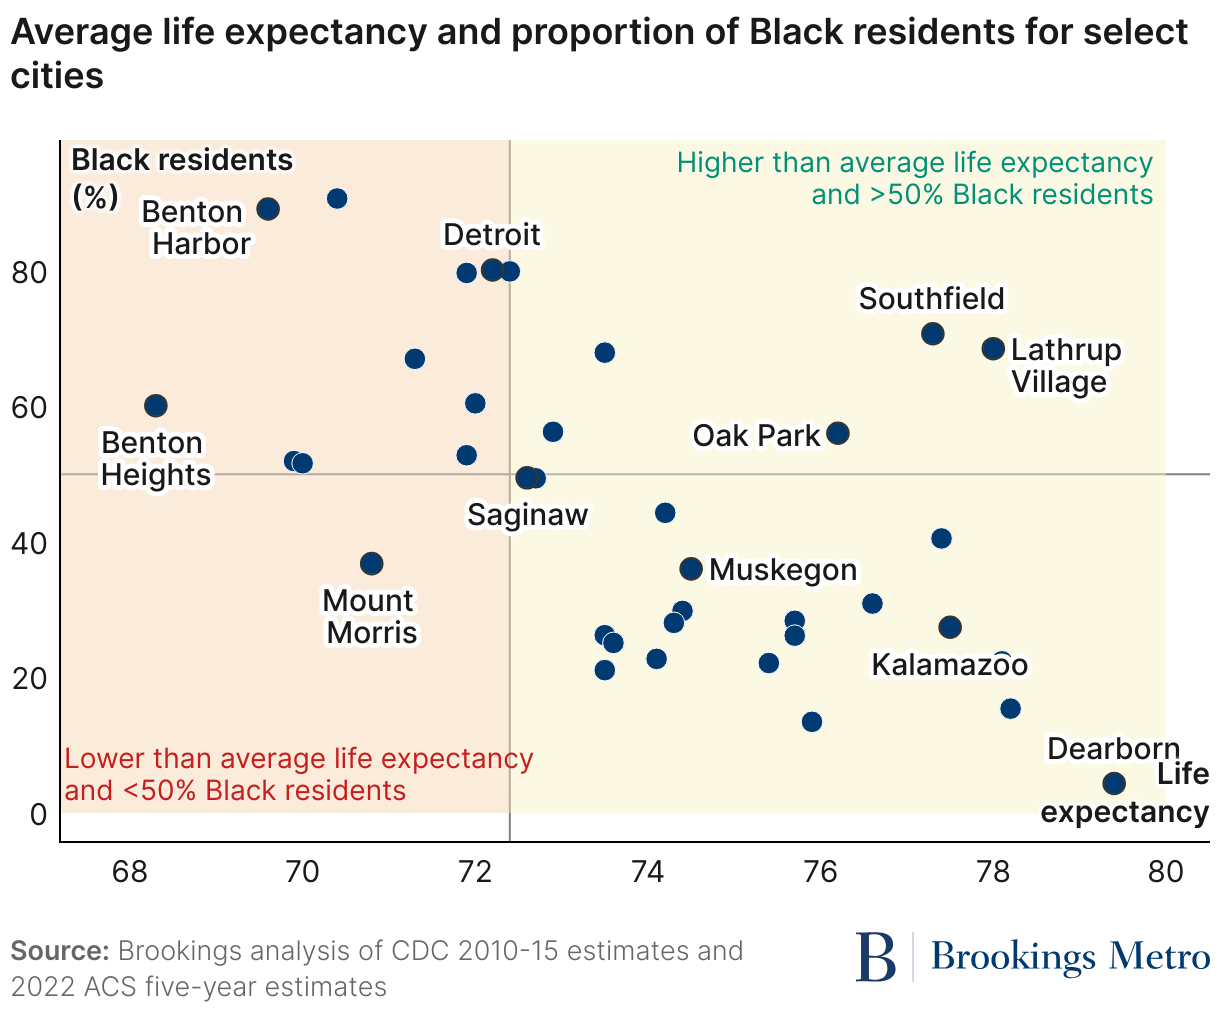
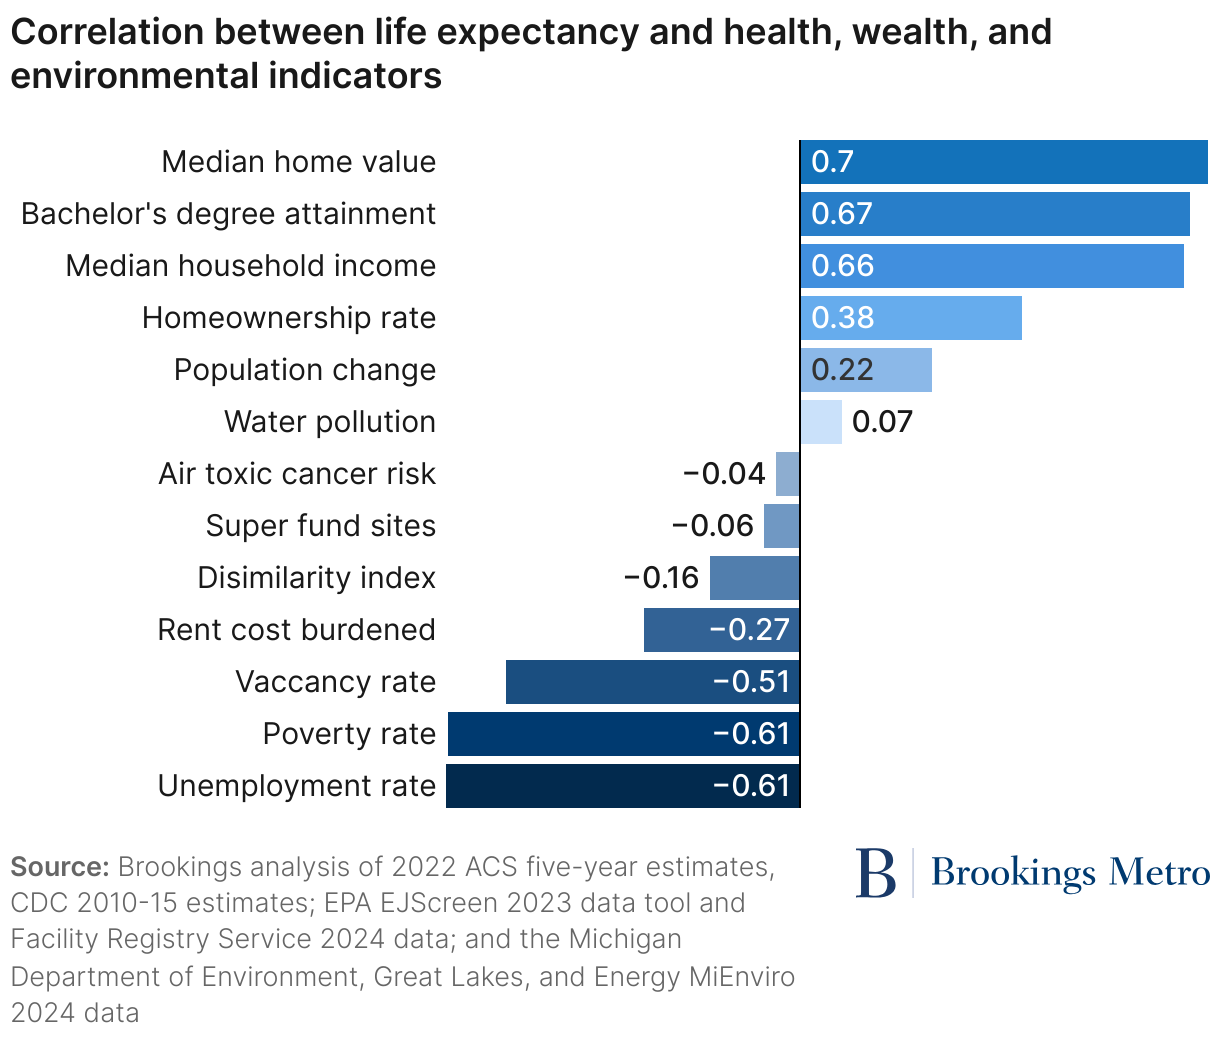
Figure 7 shows the correlation between life expectancy and other indicators explored in the previous sections, showing both the direction of correlation (whether the indicator is likely to be correlated with a higher or lower life expectancy) and magnitude (how influential that indicator is on life expectancy). These indicators impact quality of life for Michiganders within our 39 cities, and a few—such as median home value, educational attainment, poverty rate, and unemployment rate—have relatively strong correlations with actual life expectancy. In practice, the home one can afford, their education, and their income have direct and indirect effects on health and longevity. In contrast, environmental indicators—although still important to quality of life—are less strongly correlated with life expectancy. This may be due to the variable type, which measures the number of Superfund and water pollution sites rather than the density of pollution in an area (a figure that is much more challenging to quantify).
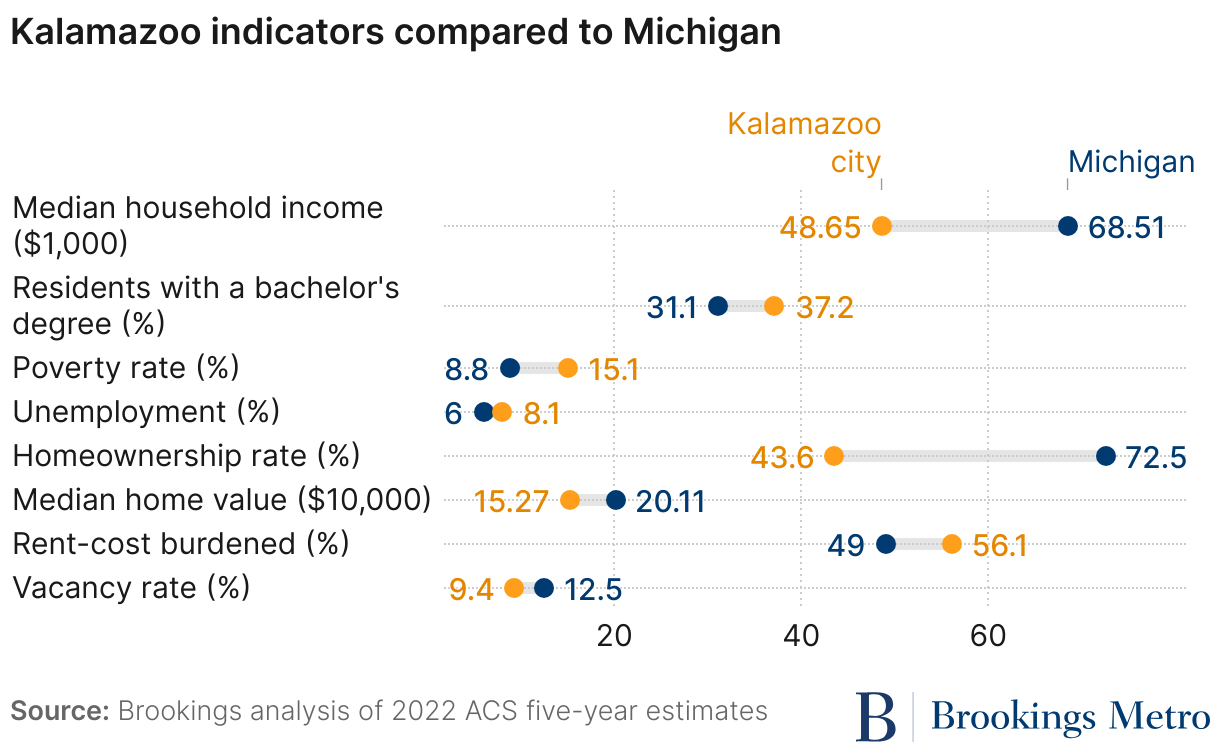
One city in which these relationships play out is in Grand Rapids, where life expectancy is 78.1. The homeownership rate there is 54.5%; 39.3% of residents hold a bachelor’s degree or higher; and the median household income is $61,634. By contrast, life expectancy in Kalamazoo is 77.5, and substantially fewer residents own their own home (43.6%), while median household income is on the lower end of our study cities ($48,649). However, as we cover in the next section, Kalamazoo’s educational attainment rate is relatively high for the state, boding well for potential gains in quality of life for its residents.
Case studies: Spotlight on Kalamazoo, Grand Rapids, and Southfield and Lathrup Village
This section provides more detail on three Black-majority places in Michigan that score highly across quality of life indicators: Kalamazoo, Grand Rapids, and Southfield and Lathrup Village. These three places also provide a cross-section of the geographic and demographic diversity of Black-majority cities and neighborhoods that are thriving across Michigan, representing a small, midsized, and large city, with varying proportions of Black residents.
Kalamazoo
Kalamazoo, on the southwestern side of Michigan, stands out for its low poverty rates (15.1%), low unemployment (8.1%), and a high rate of residents with bachelor’s degrees (37.2%). Like many other major Michigan cities, Kalamazoo was redlined in the 1930s; government appraisers redlined northside neighborhoods with the mention of “negro homes are all through the industrial area,” as well as south-central Kalamazoo, and a neighborhood between Kalamazoo College and Western Michigan University. This act segregated the city and denied housing opportunities to Black families for years.
With the turn of the 21st century, however, the city of Kalamazoo has taken a fairly reparative approach to their education policies. In 2006, the city established the Kalamazoo Promise, a scholarship system through which all public school graduates in Kalamazoo are entitled to have their tuition and fees paid for to attend any postsecondary institution in the state, including the University of Michigan and Michigan State University. With Black students representing the largest racial-ethnic identity in the Kalamazoo Public Schools system, this policy has torn down the economic barriers to higher education that often limit BIPOC students in the area from attaining a higher education. It has also motivated hundreds of BIPOC students to consider life paths that originally may have seemed impossible, and established a culture of educational attainment that persists to this day.
In 2020, Kalamazoo Vice Mayor Patrese Griffin passed an anti-discrimination ordinance that established fair housing protocols for the city. The ordinance prohibits discrimination in housing based on many categories and created a civil rights board to offer opinions when the city receives a complaint. It also bans landlords from creating “blanket policies” designed to limit prospective tenants’ housing opportunities based on characteristics such as their criminal background and source of income. Kalamazoo also received $12.3 million from the U.S. Department of Transportation to transform Kalamazoo and Michigan Avenues into two-way streets with added turn lanes, pedestrian infrastructure, and bike lanes. The roads were originally designed to be busy barriers separating the redlined Black northside communities from the white central business district.
Southfield and Lathrup Village
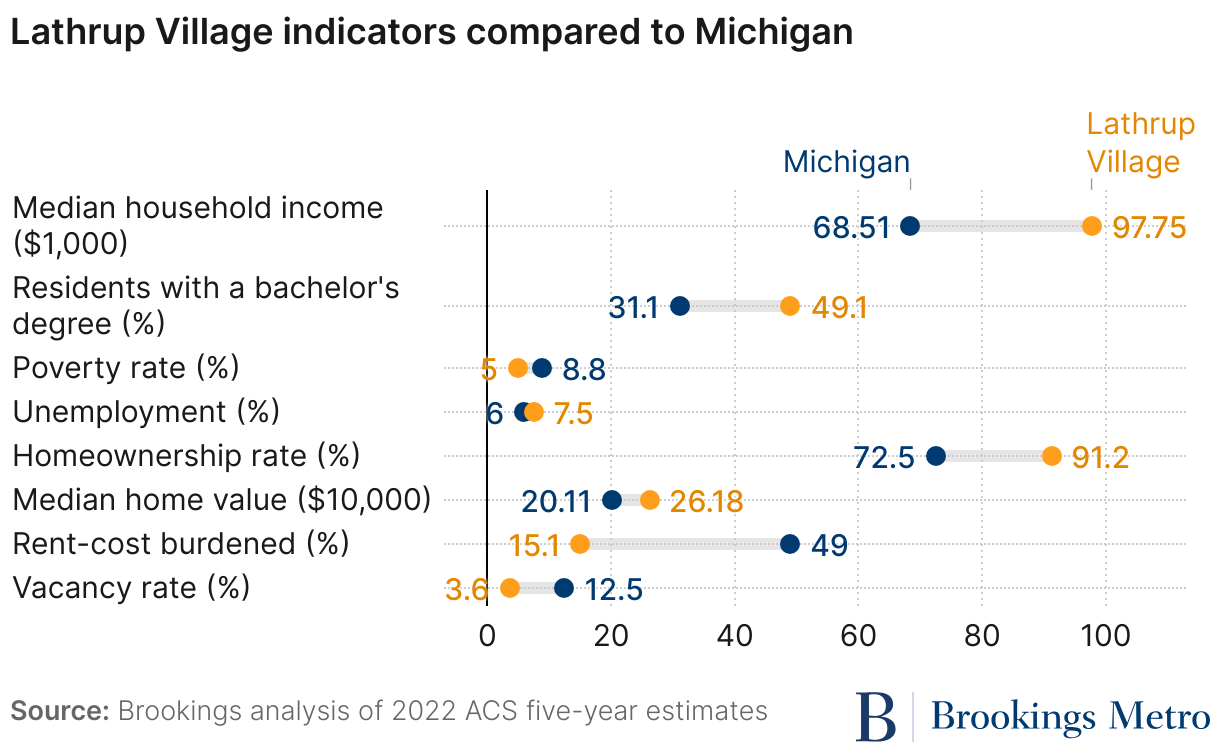
Southfield and Lathrup Village are two of the highest-performing Black-majority cities in Michigan on the metrics of economic prosperity, homeownership, and business ownership. Figure 9 shows these indicators for Lathrup Village.
Both cities were almost completely white in the 1970s. Less than 1% of Southfield’s population was Black in 1970, with most of its population being white and Jewish. Lathrup Village was closed off to people of color from its inception into the 1920s, and its school system remained completely segregated for decades after. It was predominantly white until the 1990s.
These demographics changed substantially throughout the 1980s and 1990s due to a massive exodus of the Black middle class from neighboring Detroit, stemming from a loss of industrial jobs and the rapid decline of the city’s economy. Both cities are now majority-Black: Southfield is 65.3% Black and 25.5% white, and the remaining residents are a mix of Asian American, Native American, Latino or Hispanic, and multiracial. Additionally, 37.9% of Southfield residents hold a bachelor’s degree. Lathrup Village, which is encapsulated by Southfield, has similarly positive indicators that consistently beat Michigan averages, as shown in Figure 9. Southfield and Lathrup Village are also the only two Black-majority cities in Michigan with a higher median household income than the state average—positioning both as examples of high Black economic well-being.
Part of this success is thanks to the pronounced growth in the Black middle class in the Detroit metro area. Between 2010 and 2017, Detroit ranked 19th nationally for growth of households in middle-class census tracts. One contributing factor might be the growth in Black-owned businesses. Our research on Black-owned businesses showed that in 2021, the wider Detroit area had the 13th-highest number of Black-owned employer businesses out of 187 surveyed metro areas, with Black people owning 3% of all employer businesses and 23% of nonemployer businesses—both above the national average.
Grand Rapids
The history of Black residents in Grand Rapids follows a similar trajectory as other Michigan cities, with most arriving through the Great Migration. A combination of redlining and highway construction later displaced around 4,000 families, and in 1967, protests erupted following those in Detroit. More recently, Grand Rapids has become a core member of the Government Alliance on Race and Equity, joining in 2017. The city is actively combatting the impacts of decades of racial division that have left it with the largest racial wealth gap in Michigan. However, despite these challenges, the Black residents of Grand Rapids still boast higher economic and health indicators than other Black-majority places.

Grand Rapids has the fourth-highest life expectancy of all 39 cities and towns in this study. The city also beats the statewide average for multiple indicators, including educational attainment and unemployment rate. The city is 22.4% Black, with four Black-majority census tracts in the southeast section of the city, centered around Hall Street and Eastern Avenue. These census tracts also perform above average compared to Black-majority cities and towns. Median household income is approximately $47,300, educational attainment is 22.2%, and the unemployment rate is 7.2%.
Conclusion
In this analysis of Michigan’s Black-majority places, it’s clear that the diversity and complexity inherent in these communities mirror the varied experiences and potential outcomes for Black Michiganders. Just as it is impossible to generalize Black people across America, the same holds true for Black-majority places in Michigan. Each possesses unique attributes and faces distinct challenges influenced by deep-seated historical, economic, and social factors. Yet despite these disparities, certain places in Michigan— including Kalamazoo, Grand Rapids, and Southfield and Lathrup Village—demonstrate notable indicators of thriving. This suggests that potential and growth often lie beneath the surface of broader statistical generalizations, masked when only racial disparities are considered without a deeper local context.
Local initiatives and community-driven strategies have led to higher educational outcomes, economic prosperity, and improved health indicators. These positive deviations from broader trends illustrate that when local efforts align strategically with the needs of the community, significant improvements in quality of life can be achieved. This fact underscores the importance of targeted, place-based policies and interventions that reflect the specific socioeconomic dynamics of each community.
The findings from this report also highlight the importance of examining specific factors that contribute to better outcomes in various Black-majority cities. Cities with higher life expectancies, lower poverty rates, and substantial economic activity (such as Grand Rapids) demonstrate how policy, community engagement, and local governance can converge to create conducive environments for Black quality of life and prosperity. These cities serve as crucial case studies for understanding the dynamic interplay of factors that support thriving Black communities, and they offer valuable lessons that can be transposed to similar contexts elsewhere.
This investigation into the state of life in Michigan’s Black-majority places not only challenges the common narrative of struggle associated with Black communities, but also illuminates the strength, diversity, and dynamism that define these areas. By continuing to explore and learn from the successes of higher-performing cities, policymakers and community leaders can better design interventions that harness unique strengths and address the specific challenges of each community. This tailored approach is essential for fostering sustainable progress in Black-majority cities across Michigan and beyond, reflecting the rich tapestry of experiences that constitute the Black American narrative in today’s society.
Authors


-
Acknowledgements and disclosures
This report is part of a series on Black communities in Michigan made possible by support from the W.K. Kellogg Foundation. The views expressed in this report are those of its authors and do not represent the views of the W.K. Kellogg Foundation, its officers, or employees.
The Brookings Institution is committed to quality, independence, and impact.
We are supported by a diverse array of funders. In line with our values and policies, each Brookings publication represents the sole views of its author(s).