

This publication is part of a broader series examining the potential of office-to-residential conversions across six U.S. case studies. The project is part of a cooperative agreement with the US Department of Housing and Urban Development, and the research team is composed of contributors from Gensler, HR&A Advisors, Brookings, and Eckholm Studios.
Houston’s downtown faces challenges that are relatively unique. Ironically, the city’s overall lack of a zoning code has meant that despite generally extensive infill development within city limits, the downtown itself has long remained relatively sparsely built up. In the post-pandemic era, an oversupply of office buildings and a paucity of residential structures have led to declining usage of downtown and a renewed interest in reimagining the neighborhood as an attractive, mixed-use environment. New residential deliveries have tripled in the past decade, outpacing absorption (especially after the pandemic), yet downtown still faces steep challenges with affordability.
Coalitions of business groups and quasi-governmental bodies point to the publicly funded Living in Downtown incentive program from 2012 as a success story. However, political conflicts at the state level make a renewal of the incentive uncertain, while the city suffers from internal conflicts over permitting. Moreover, a cap on property tax growth prevents the city from promoting further development through reinvesting existing property tax revenue. The clear necessity of office-to-residential conversions in downtown notwithstanding, Houston will likely have to rethink its taxation and spending policies.
Houston history and context
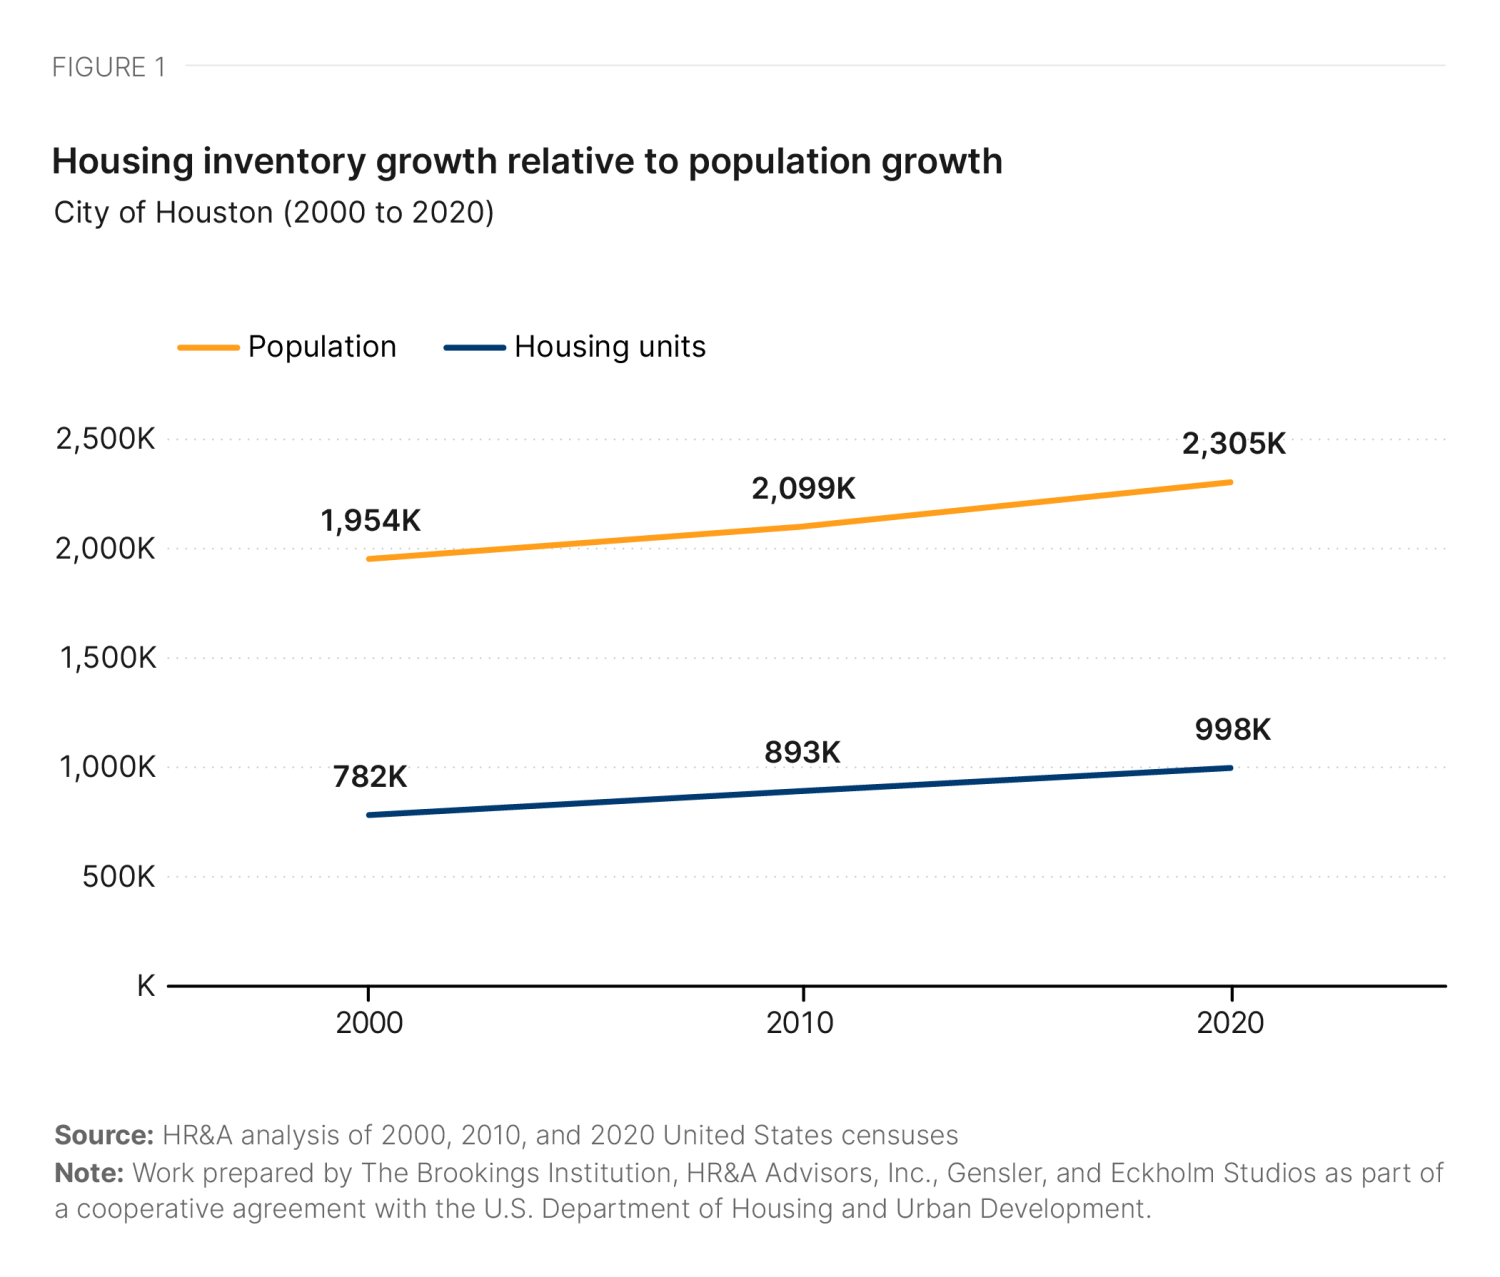
Once the capital of the breakaway Texas Republic, Houston’s independent origins are embodied today in the city’s land use regime. Houston is noted nationwide as the largest municipality in the United States without a zoning ordinance. While this does not mean the city has no land use controls, a relatively free development regime combined with two centuries of all but nonstop growth have made Houston the country’s fourth-largest city and fifth-largest metropolitan area. Houston’s total units grew by more than 216,000 (28%) between 2000 and 2020, and its population grew by more than 350,000 (18%)—adding more units and residents than any of the other cities we studied (Figure 1).
This combination of growth and light regulation has also produced a fascinating paradox: Houston is a sprawling metropolis that has one of the highest rates of infill development among U.S. cities. In most cities, the downtown typically has the most flexible zoning. But Houston’s lack of a zoning ordinance has resulted in a strange situation where, despite high infill development generally, such development and associated adaptive reuse have been slow to come to downtown. Distress and stagnation in the downtown market is not a recent trend, but rather a long-term reality: The central business district’s office vacancy rate has been above 17% since 2017, and is now almost 10 percentage points higher.
In fact, Houston’s downtown troubles date back to 1960s, when the Texas Eastern Transmission Corporation and local broker George Bolin were able to, by “cloak-and-dagger,” assemble ownership of an astonishingly large 33-block area in downtown Houston. Dozens of existing houses and buildings were demolished to make way for a futuristic “City of Tomorrow,” the vast majority of which was never built. Texas Eastern ultimately donated a portion of the land to the city for construction of the George R. Brown Convention Center, which had the misfortune of opening in 1987, the year after the price of oil collapsed—and with it, the region’s job base.
Much of the surrounding land sat vacant until as recently as 2012, when the city and affiliated nonprofit entities undertook a significant initiative to infill vacant parcels. That included promoting residential development through a Living in Downtown incentive, giving rise to a small but growing residential market downtown. Still, less than 1% of the city’s total population lives downtown—a far smaller proportion than the other cities studied in this case study series.1
Today, the George R. Brown Convention Center now ranks the seventh-best convention center in the U.S. by The Wall Street Journal based on city and surrounding area quality, including the award-winning Discovery Green urban park and the Daikin Park baseball stadium, where the 2022 World Series-winning Astros play. While still anchored by oil and gas, Houston now has a more diversified economy, including energy, chemicals, and world-class health services, all with a significant downtown presence. Houston has also evolved from a majority-white population to the most diverse city in the United States, and the city makes regular appearances on food and dining destination guides and rankings.
Alongside all of these assets, awards, and achievements is a structural challenge. The city of Houston has been operating on a deficit budget since well before the pandemic, previously using one-time moves such as selling city-owned land in order to close the gap. The projected gap for the next fiscal year is $160 million, and because the city’s debt per capita is also high relative to other Texas cities, there are limited options for how to close the deficit.
Flexible federal American Rescue Plan Act funds carried the city through the pandemic. Presently, Houston observers are engaged in a debate over whether a structural property tax revenue growth cap that was implemented by a local voter referendum in 2004 is to blame for the fiscal situation given recent high inflation, or whether the real problem is out of control spending, with some blaming spending on infrastructure.
Houston has a problem, and the city’s downtown built environment and the concerns of its residents are in many ways emblematic of changing attitudes coming out of the pandemic. For example, the share of Houstonians concerned about traffic has cratered, replaced by concerns about public safety and housing affordability. In addition, climate change has battered the region in every season with floods, fires, freezes, and, most recently, winds. A more mixed-use, sustainable downtown is clearly part of Houston’s future—helping round out the neighborhood and reflecting Houston’s contemporary prominence as one of the nation’s largest cities.
Downtown footprint and demand
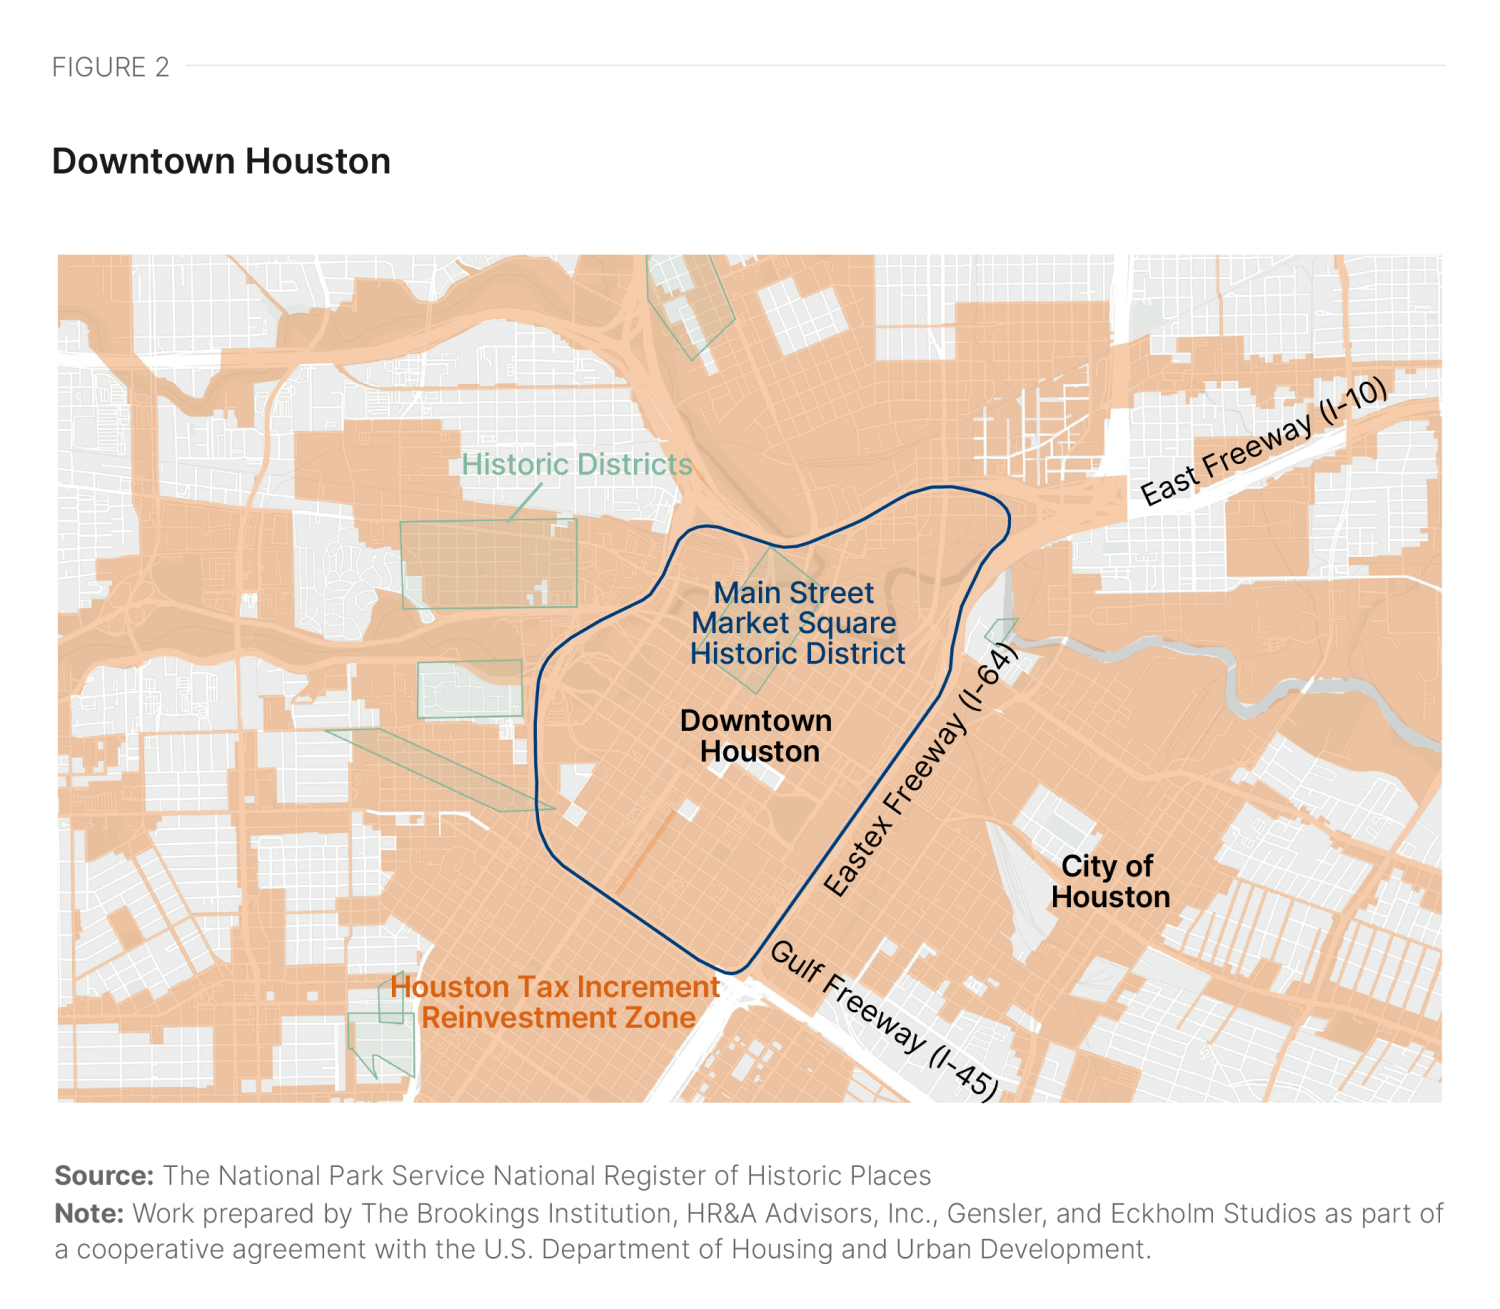
Downtown Houston covers a 1.7-mile area bounded by the interchanges between the Eastex Freeway (I-69), East Freeway (I-10), and Gulf Freeway (I-45) (Figure 2). Downtown contains a mix of recently built and renovated buildings and historic structures dating back to the 1800s. It includes the Main Street Market Square Historic District and more than 40 buildings listed on the National Register of Historic Places. Many downtown Houston offices share a private tunnel system that was primarily built out in the 1960s and 1970s. The tunnels are air conditioned and, prior to the pandemic, were also home to many small retail operations.
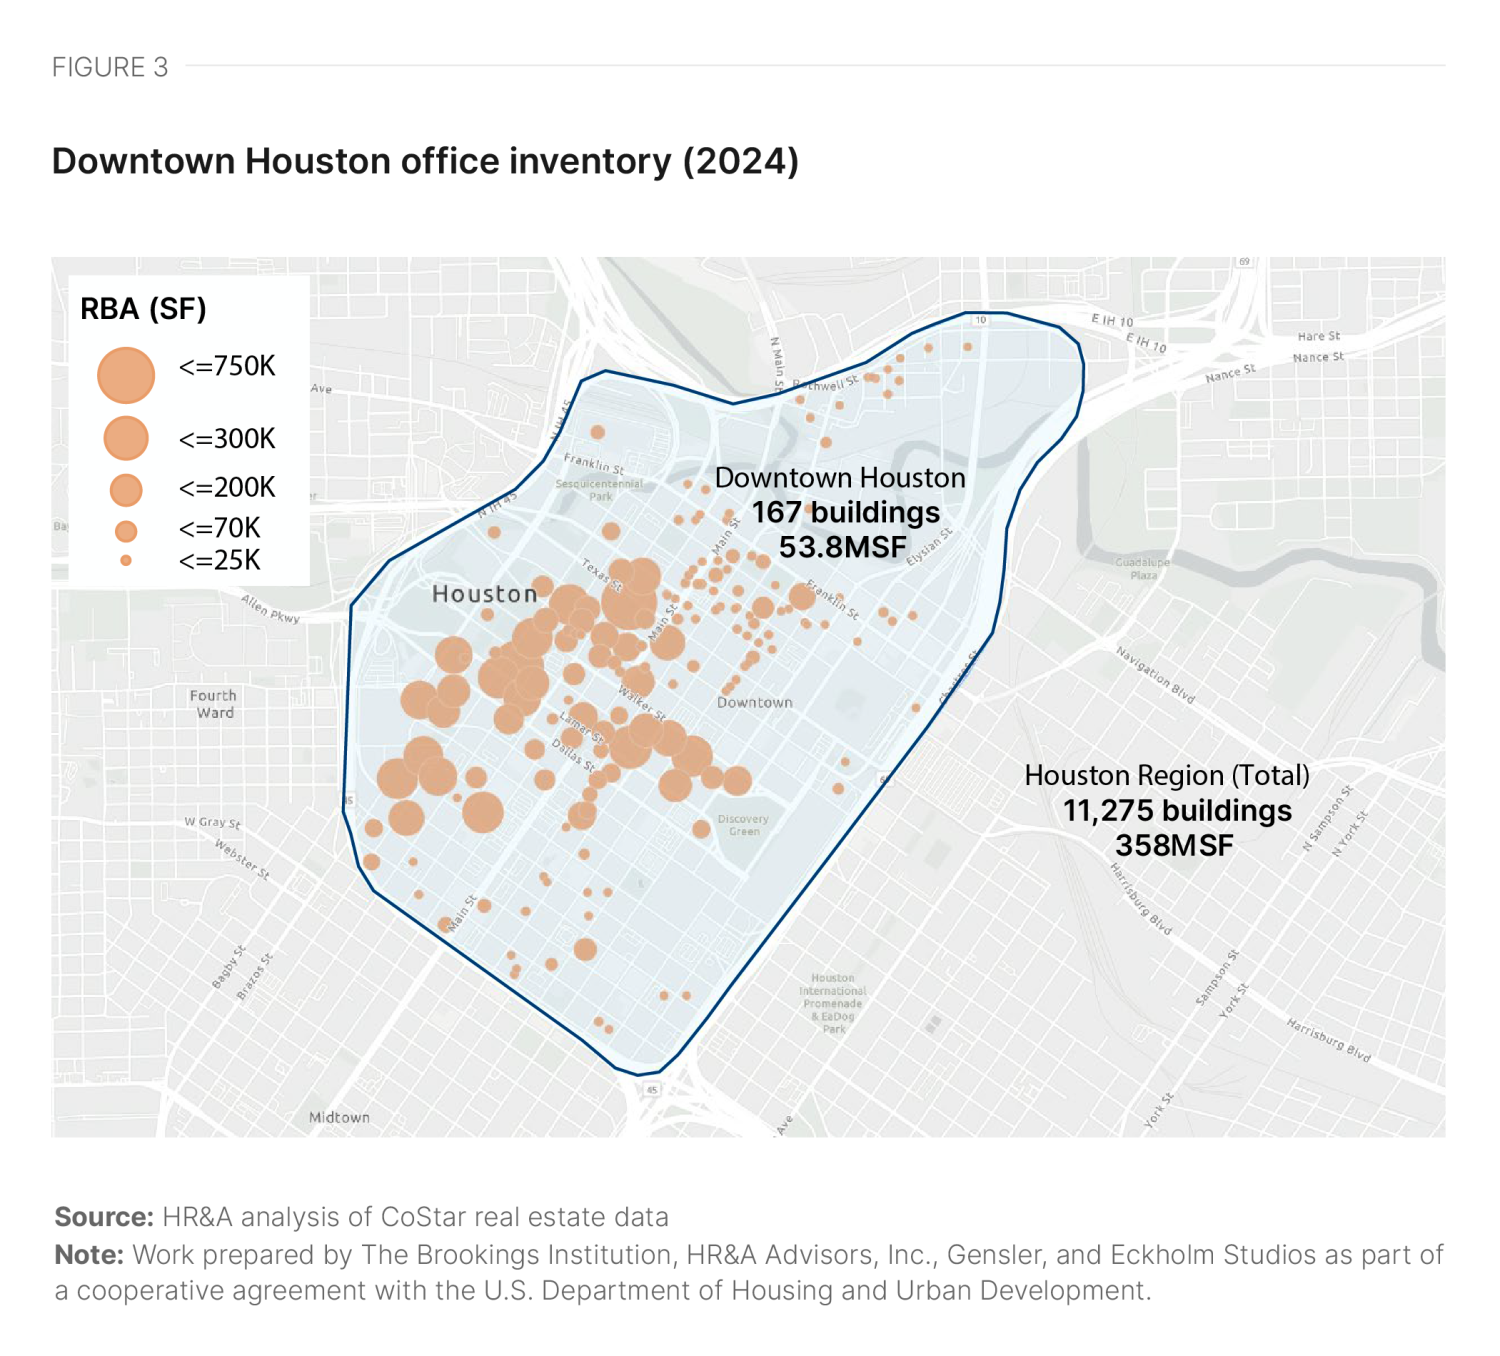
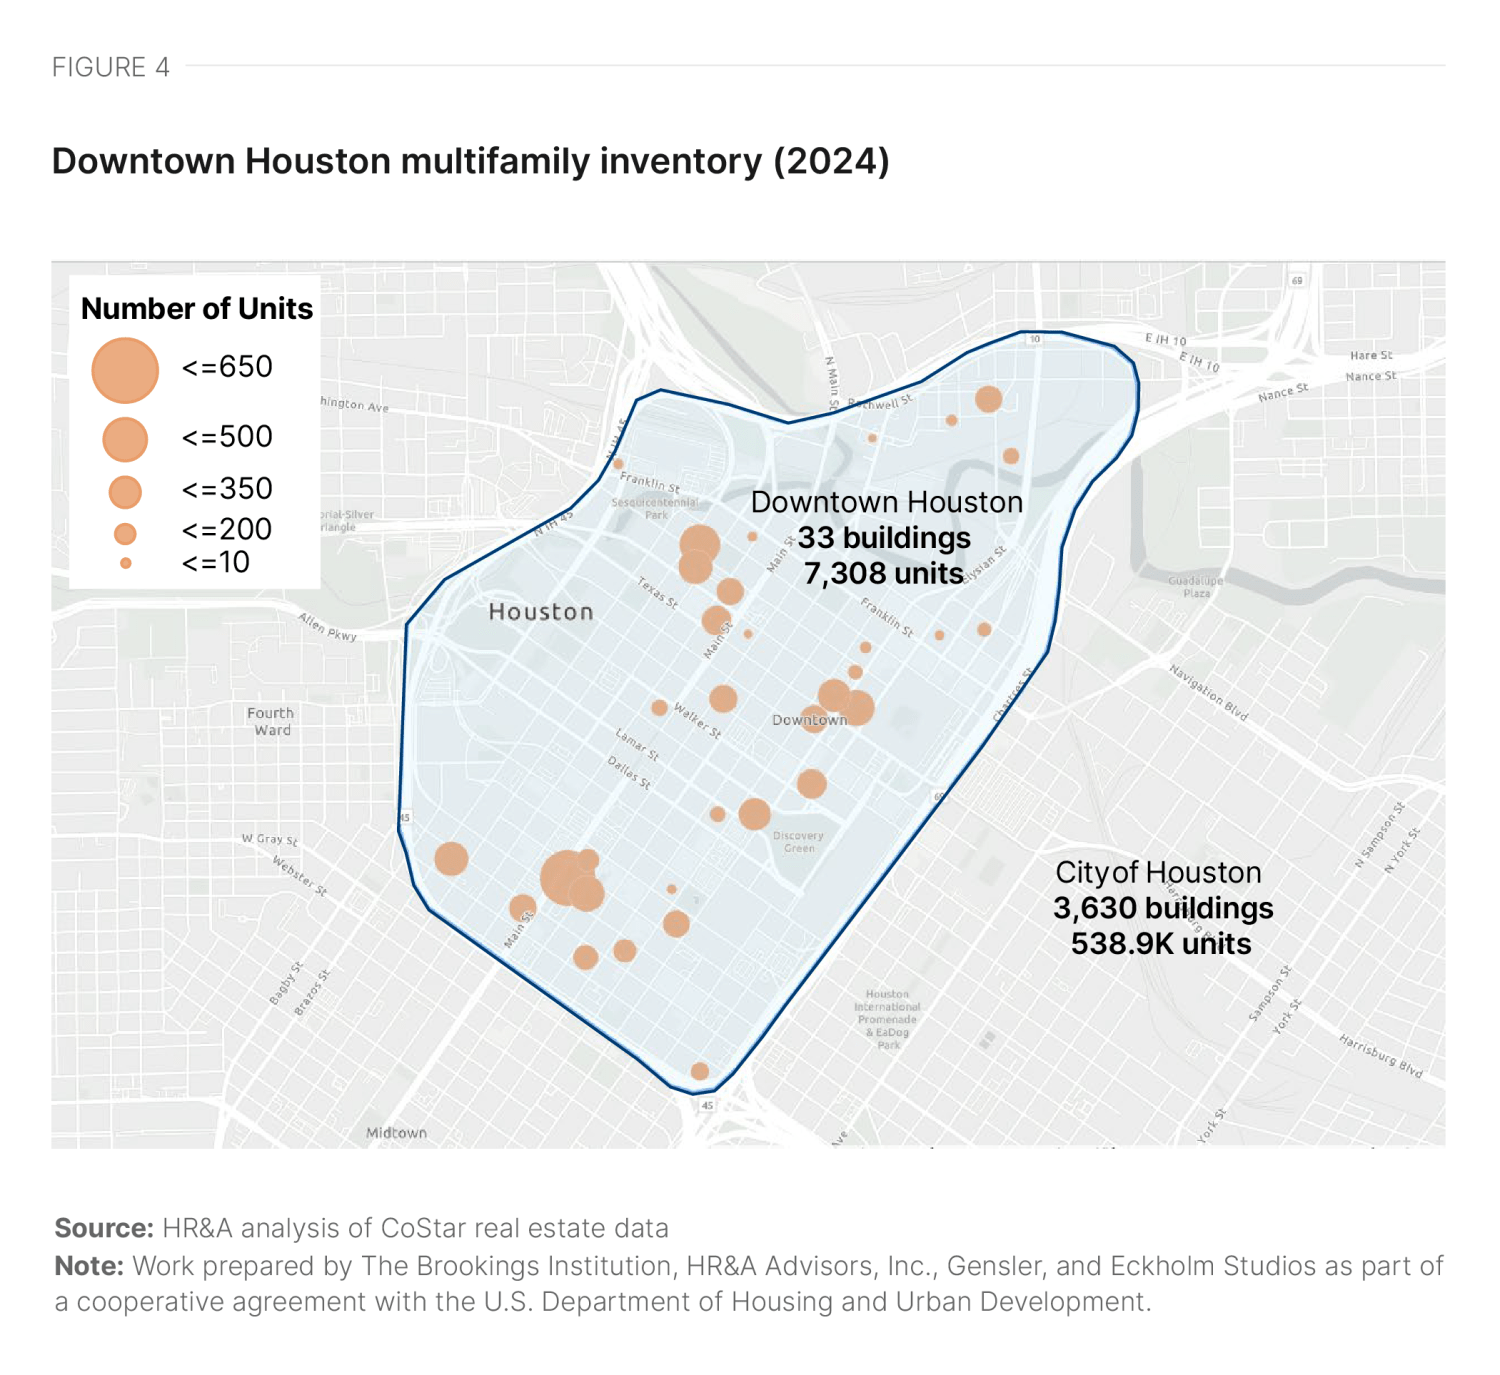
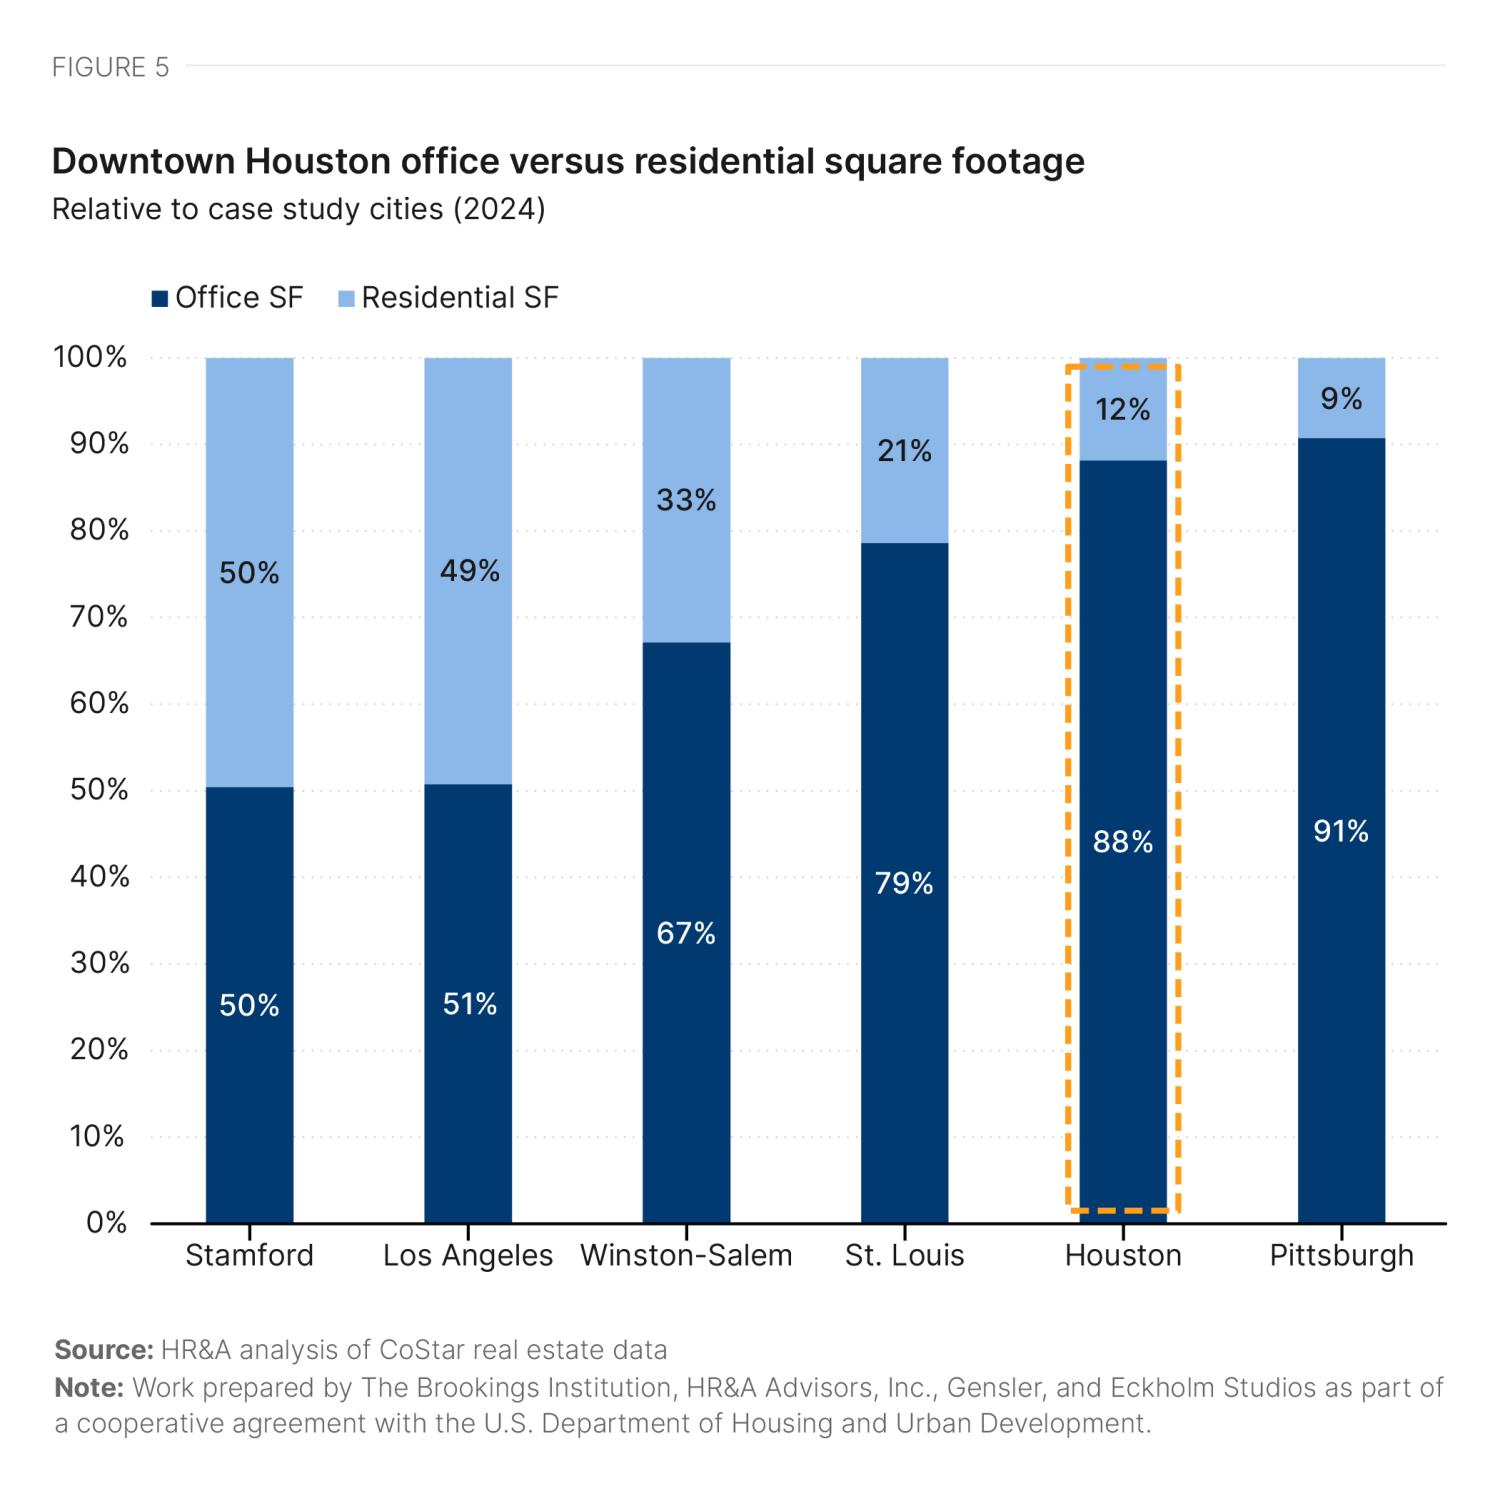
Downtown Houston contains 167 office buildings, comprising 13% of the entire region’s office space (Figure 3), but only 33 multifamily buildings, comprising just 1.4% of the city’s multifamily units (Figure 4). Houston has the second-highest proportion of office space relative to residential square footage out of the six downtowns reviewed for this study, at a ratio of more than 7-to-1 (Figure 5).
Over the last decade, new construction of office inventory has decreased, while developers have focused on modernizing their inventory, with 43 buildings receiving renovations between 2014 and 2024. Consequently, 26% of office buildings and 70% of all square footage in downtown Houston are Class A.2 Seventy-five percent of Houston’s office inventory was built after 1980, meaning these buildings are not currently eligible for federal historic preservation tax credits.
Conversely, while the downtown residential market contains only a small proportion of the city’s overall unit inventory, an active construction pipeline has almost tripled the number of downtown units over the past decade. Out of over 7,300 downtown units, almost 5,300 have been built since 2014.3
Office market conditions
While rent growth has been stagnant in both the office and residential markets in downtown Houston, those markets are moving in different directions: Office vacancies continue to rise as the amount of downtown leasing activity has decreased, while the historically small residential market has almost tripled the number of downtown units.
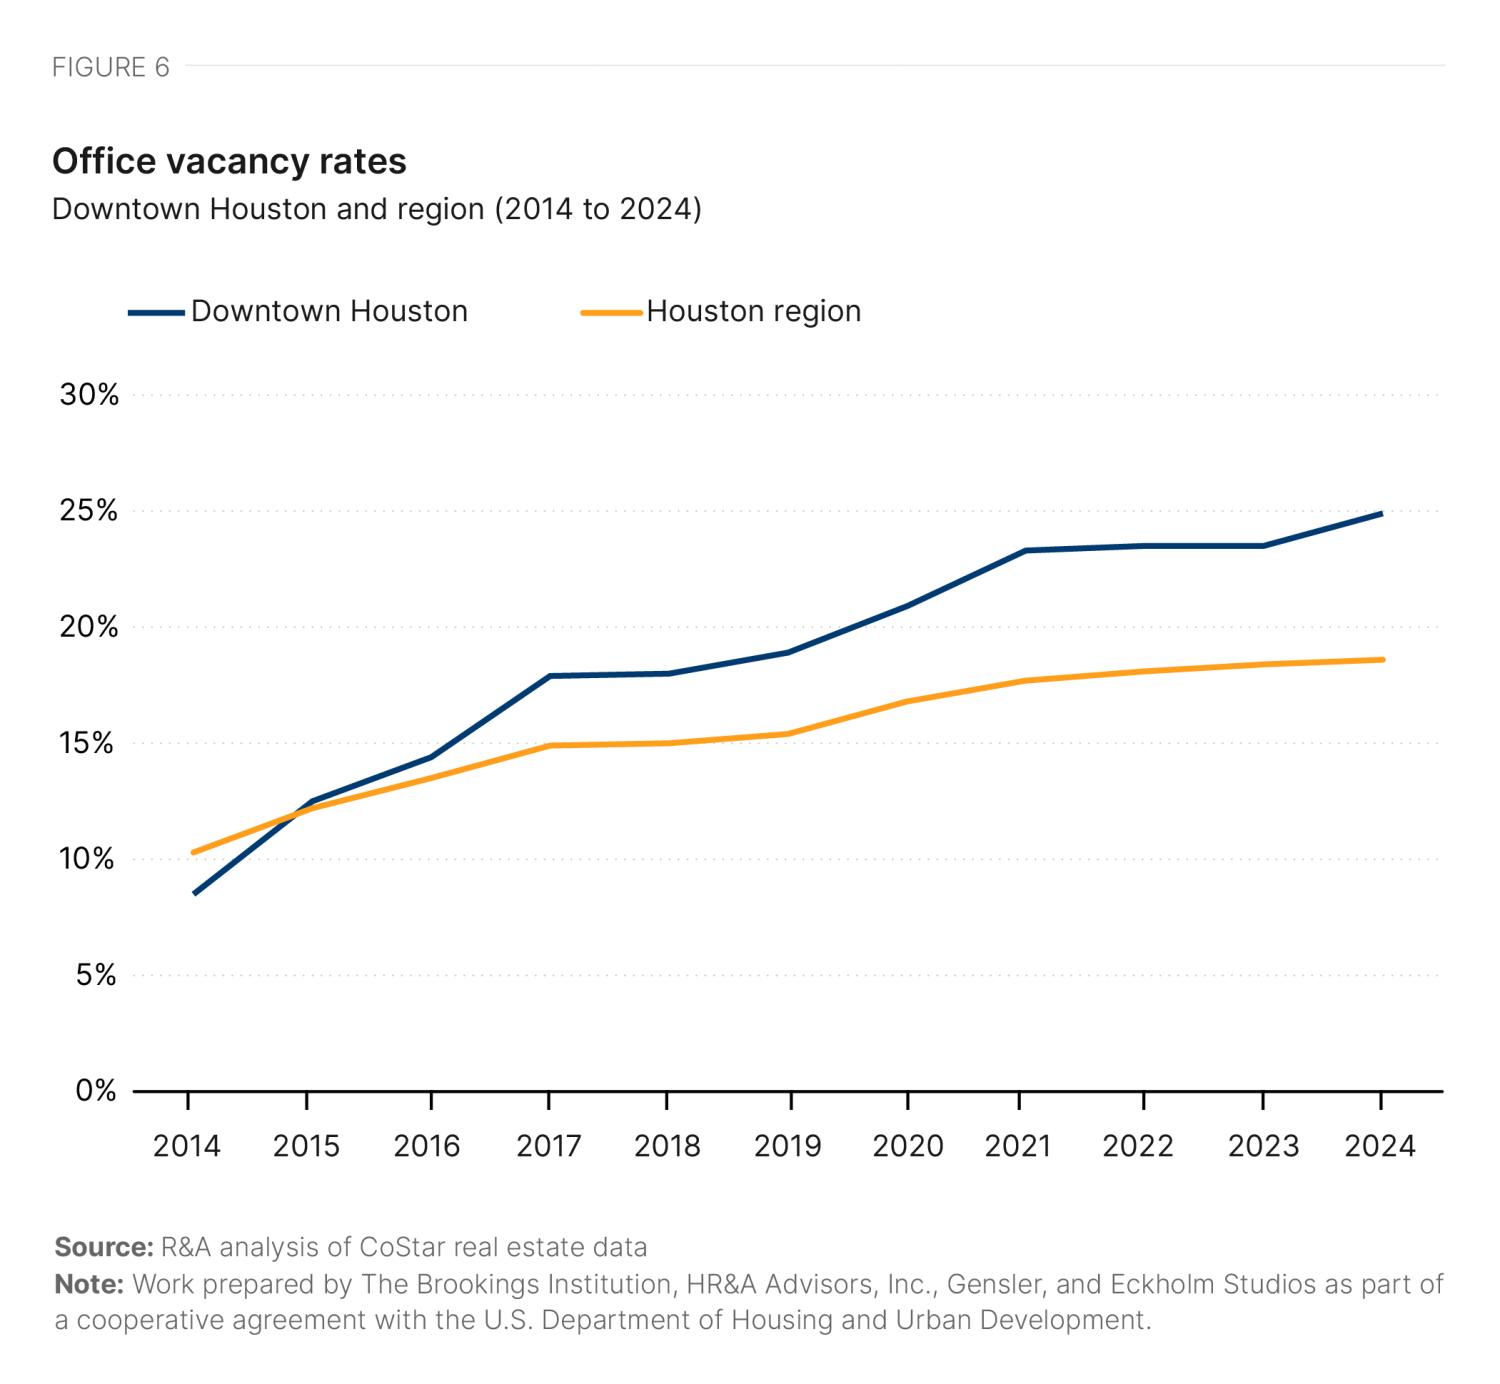
The office vacancy rate has been steadily rising throughout the Houston region over the last decade, and has been rising at an even faster rate downtown, bringing the downtown office vacancy rate to 25% as of mid-2024 (Figure 6)—higher than the 19% national average office vacancy rate in Q3 2024. The market delivered more than 4 million square feet of new office space during this period while experiencing negative absorption most years, contributing to the elevated vacancy rate. The vacancy growth rate has slowed since 2021 with a lower volume of new deliveries, but the overall vacancy rate continues to rise.4
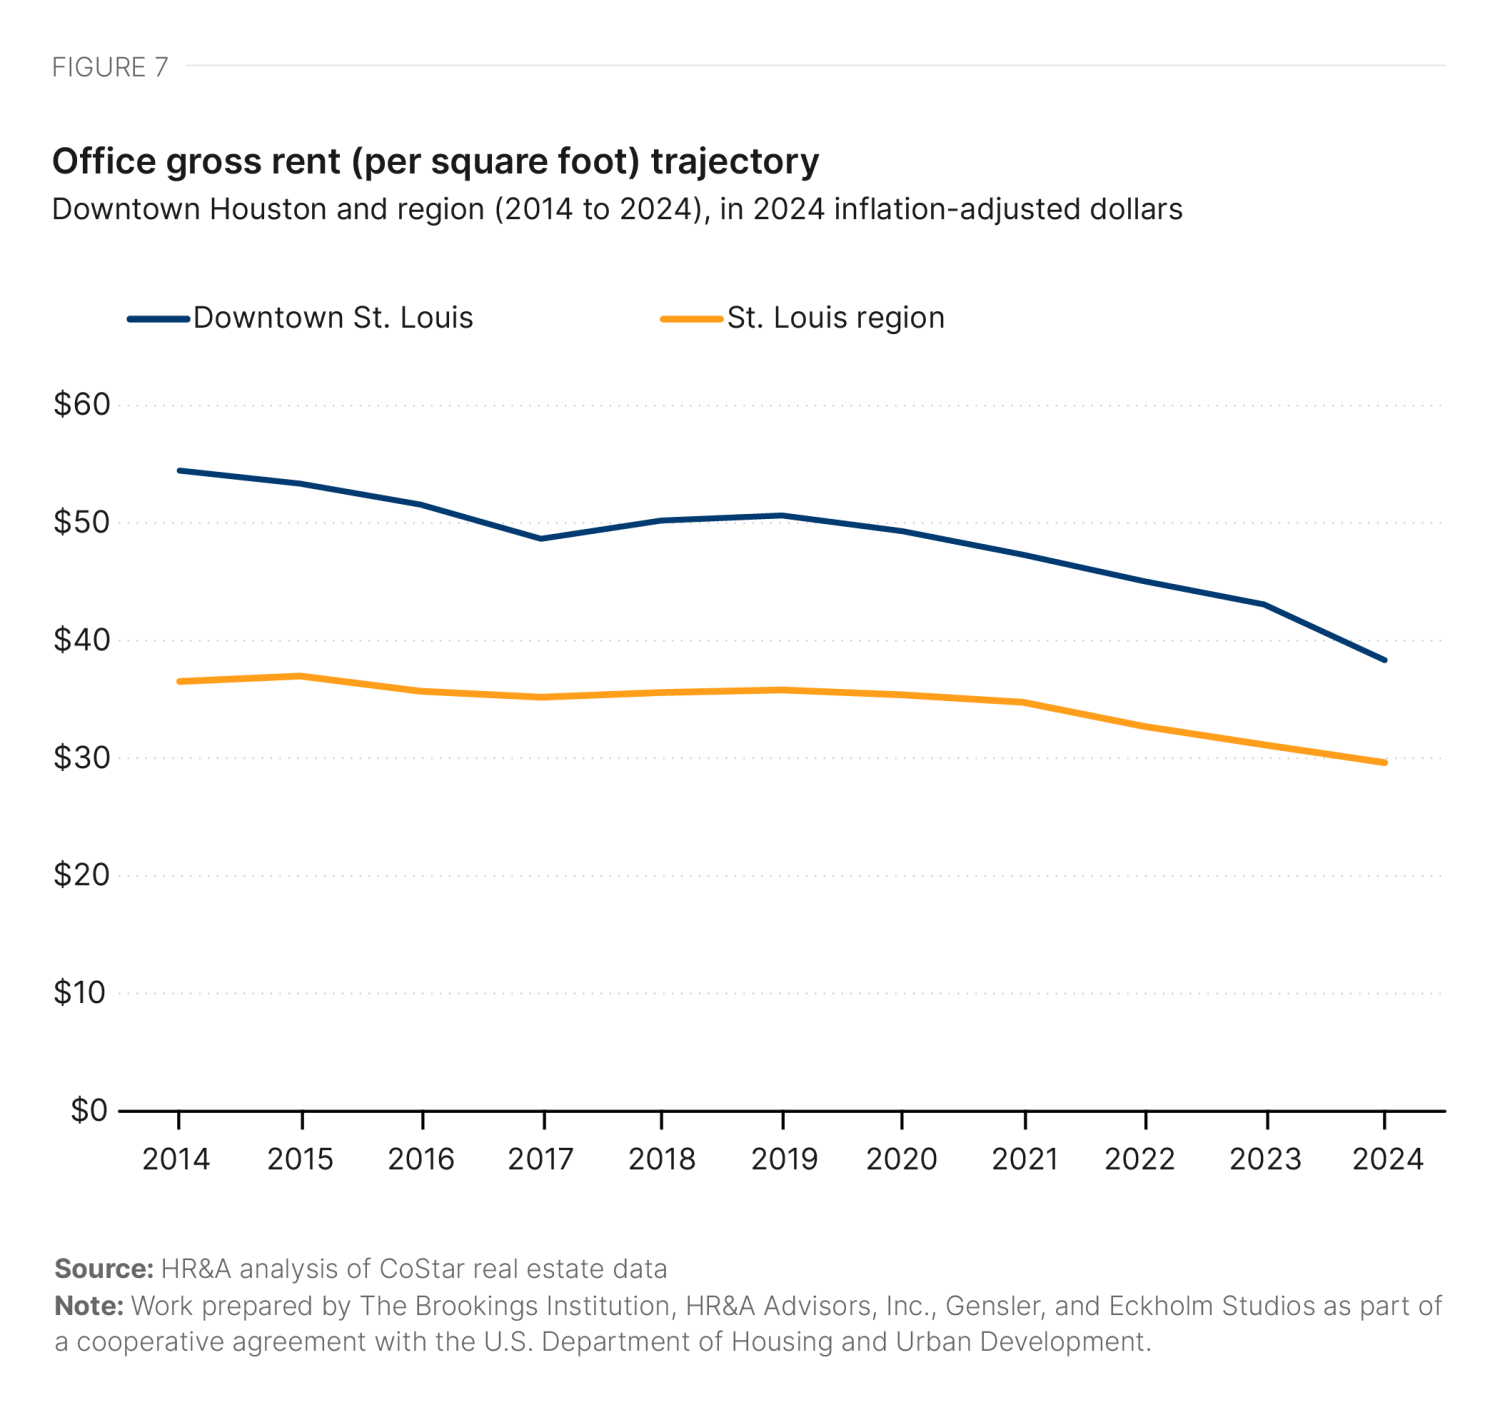
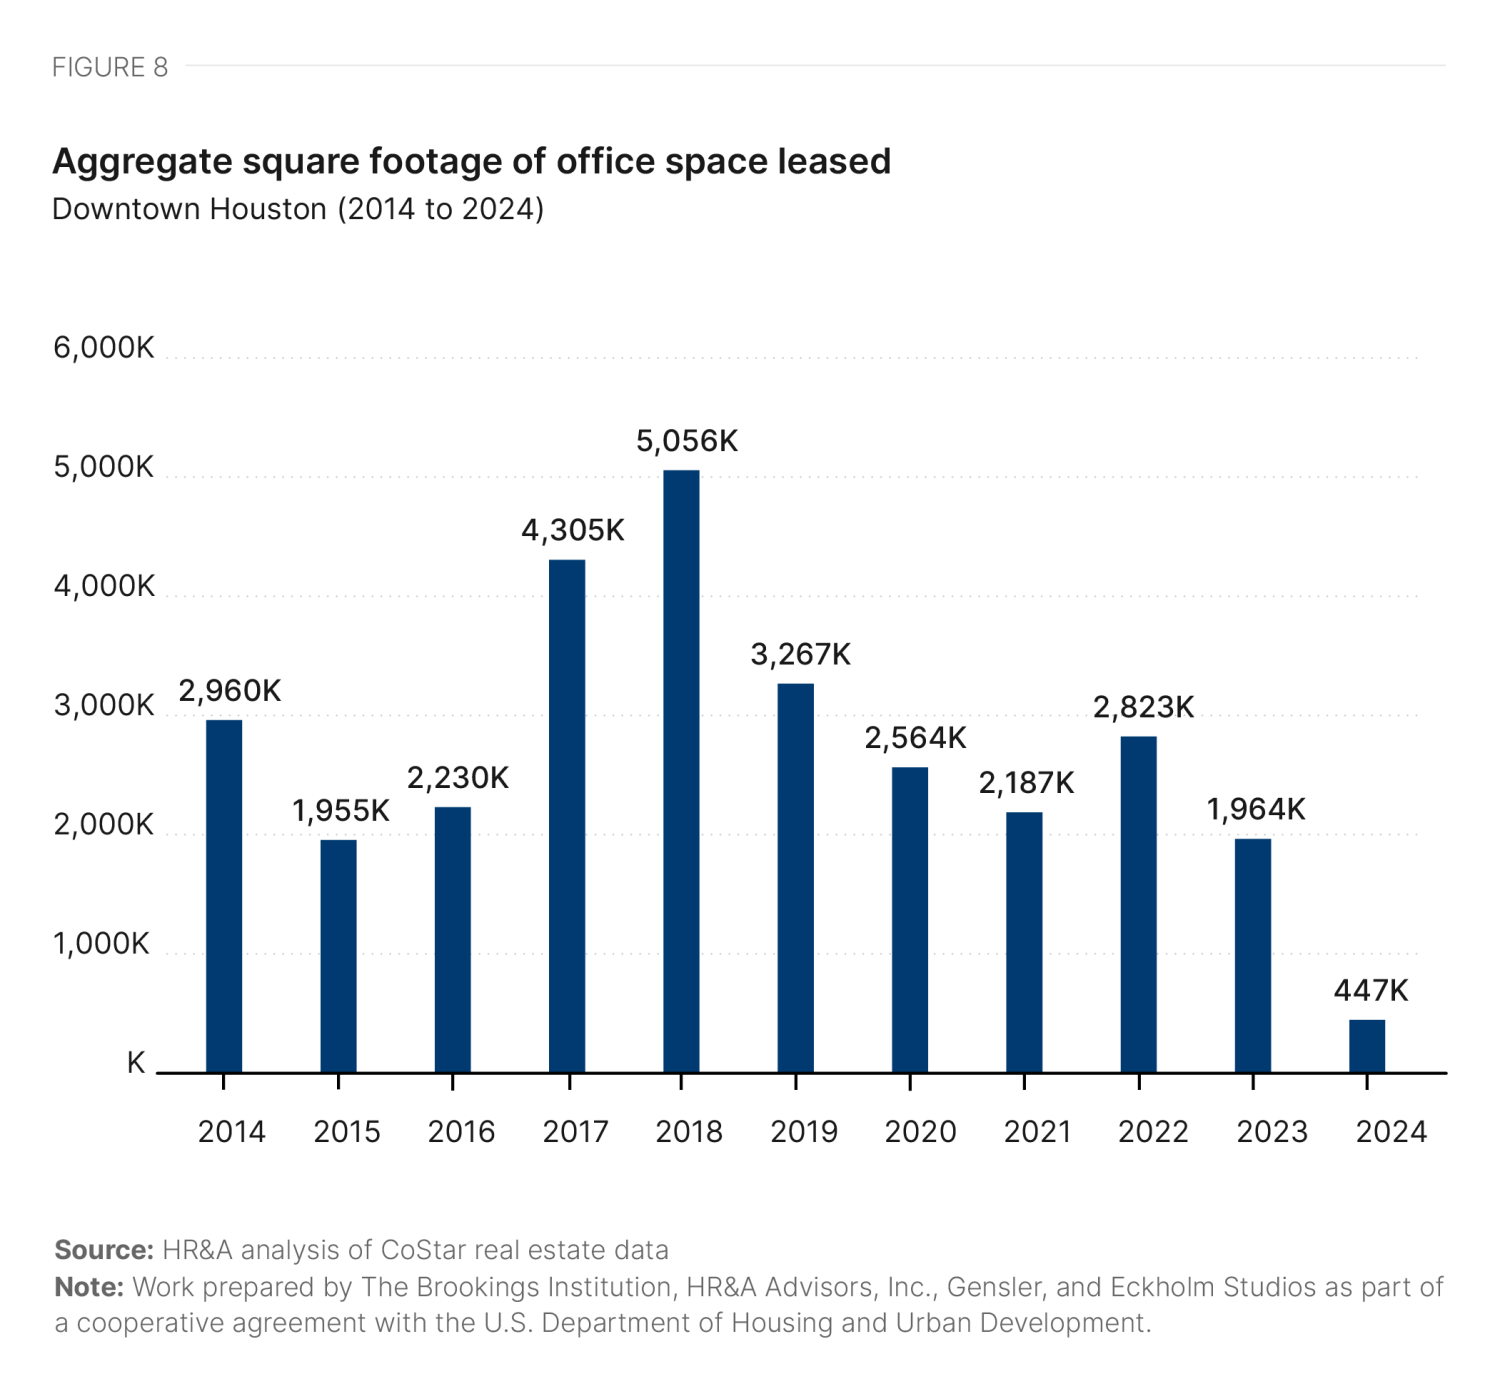
Office gross rents in downtown Houston have stagnated over the last decade at an average of $40 per square foot per year nominally, causing the inflation-adjusted value of rent to decrease by 24% between 2019 and 2024 (Figure 7).5 Leasing activity has slowed since the pandemic: Downtown Houston leased an average of 3.3 million square feet annually from 2014 to 2019, but decreased 30% to an average of 2.3 million square feet per year as of 2023 (Figure 8).
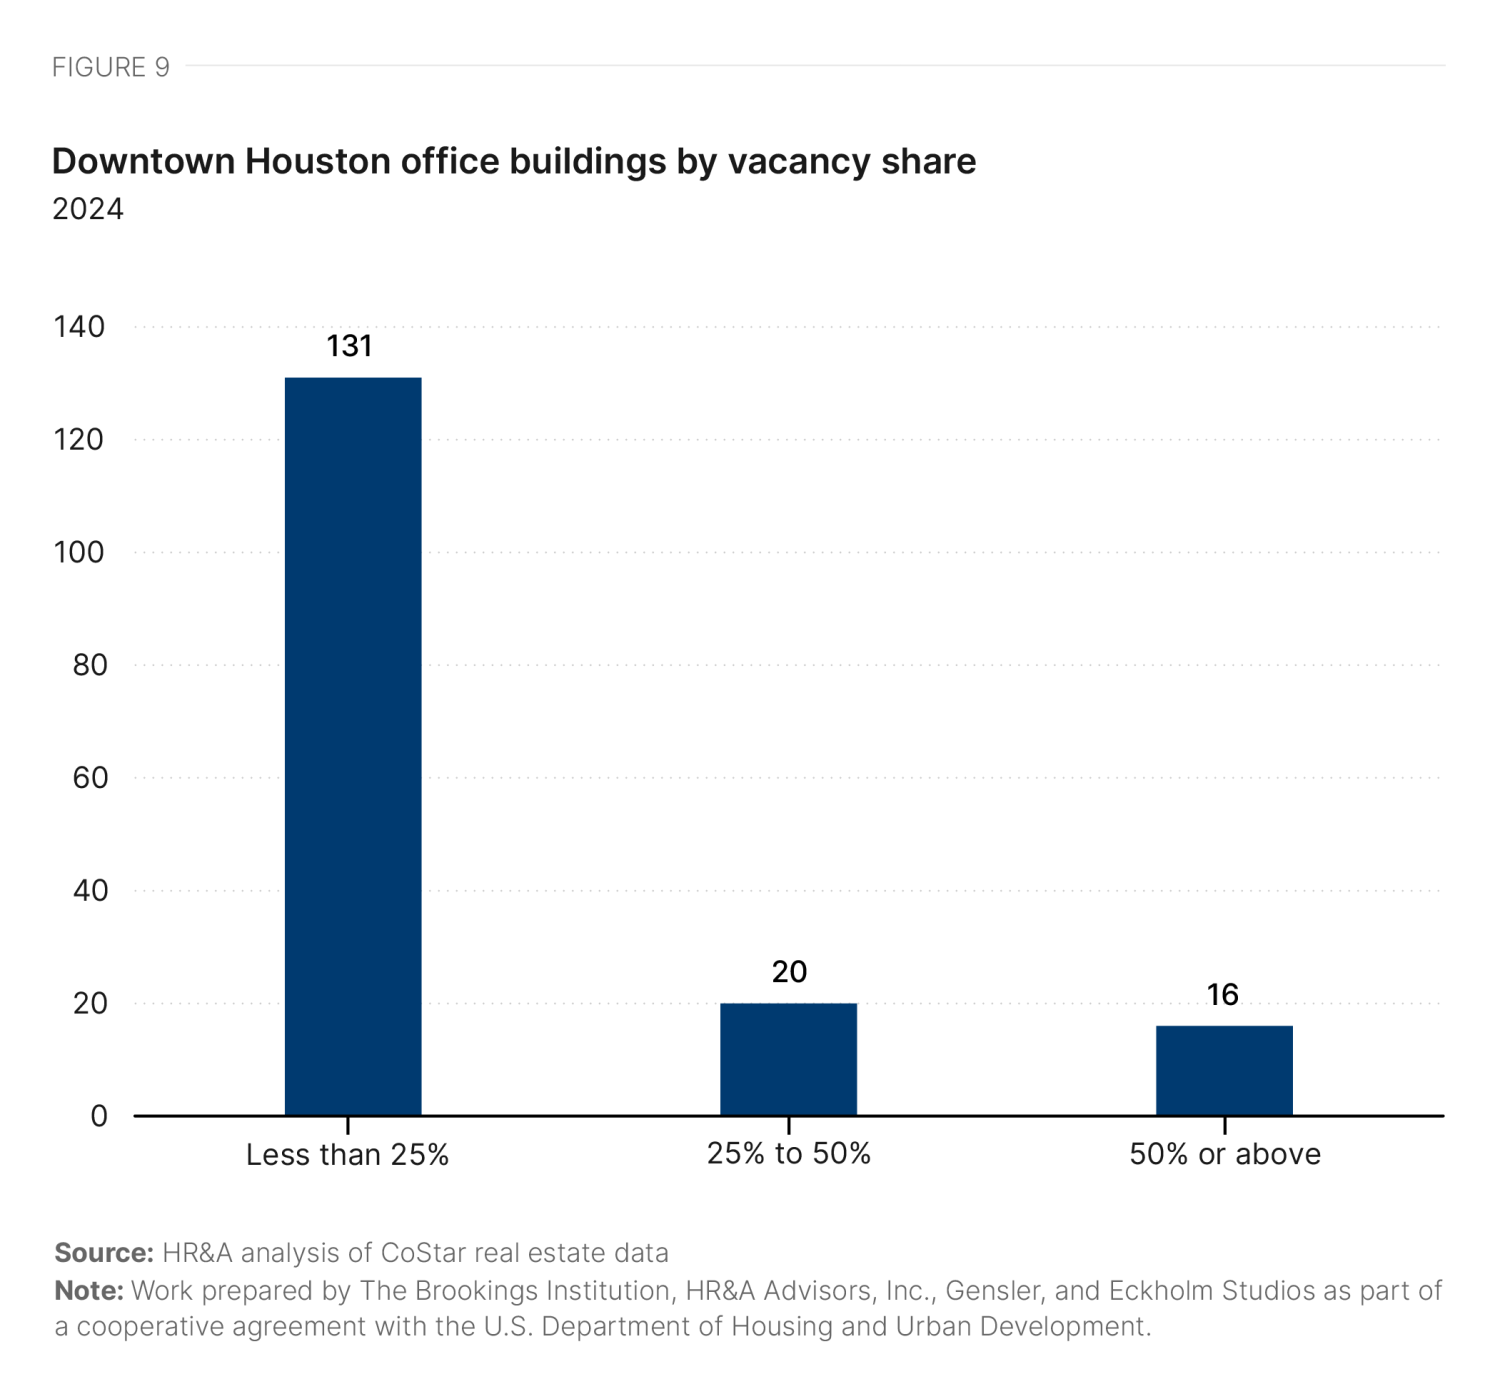
Thirty-six out of the 167 buildings in downtown Houston are more than 25% vacant (Figure 9). The 10 buildings with the largest amounts of vacant space contain 45% of all vacant space downtown, and are located in a half-mile radius within the central business district. Conversions are already being considered for some of these properties. For example, the fully vacant Exxon tower at 800 Bell St.—which contains 10% of downtown Houston’s vacant office space—was sold in late 2022 for a proposed residential conversion.6
Residential market trends
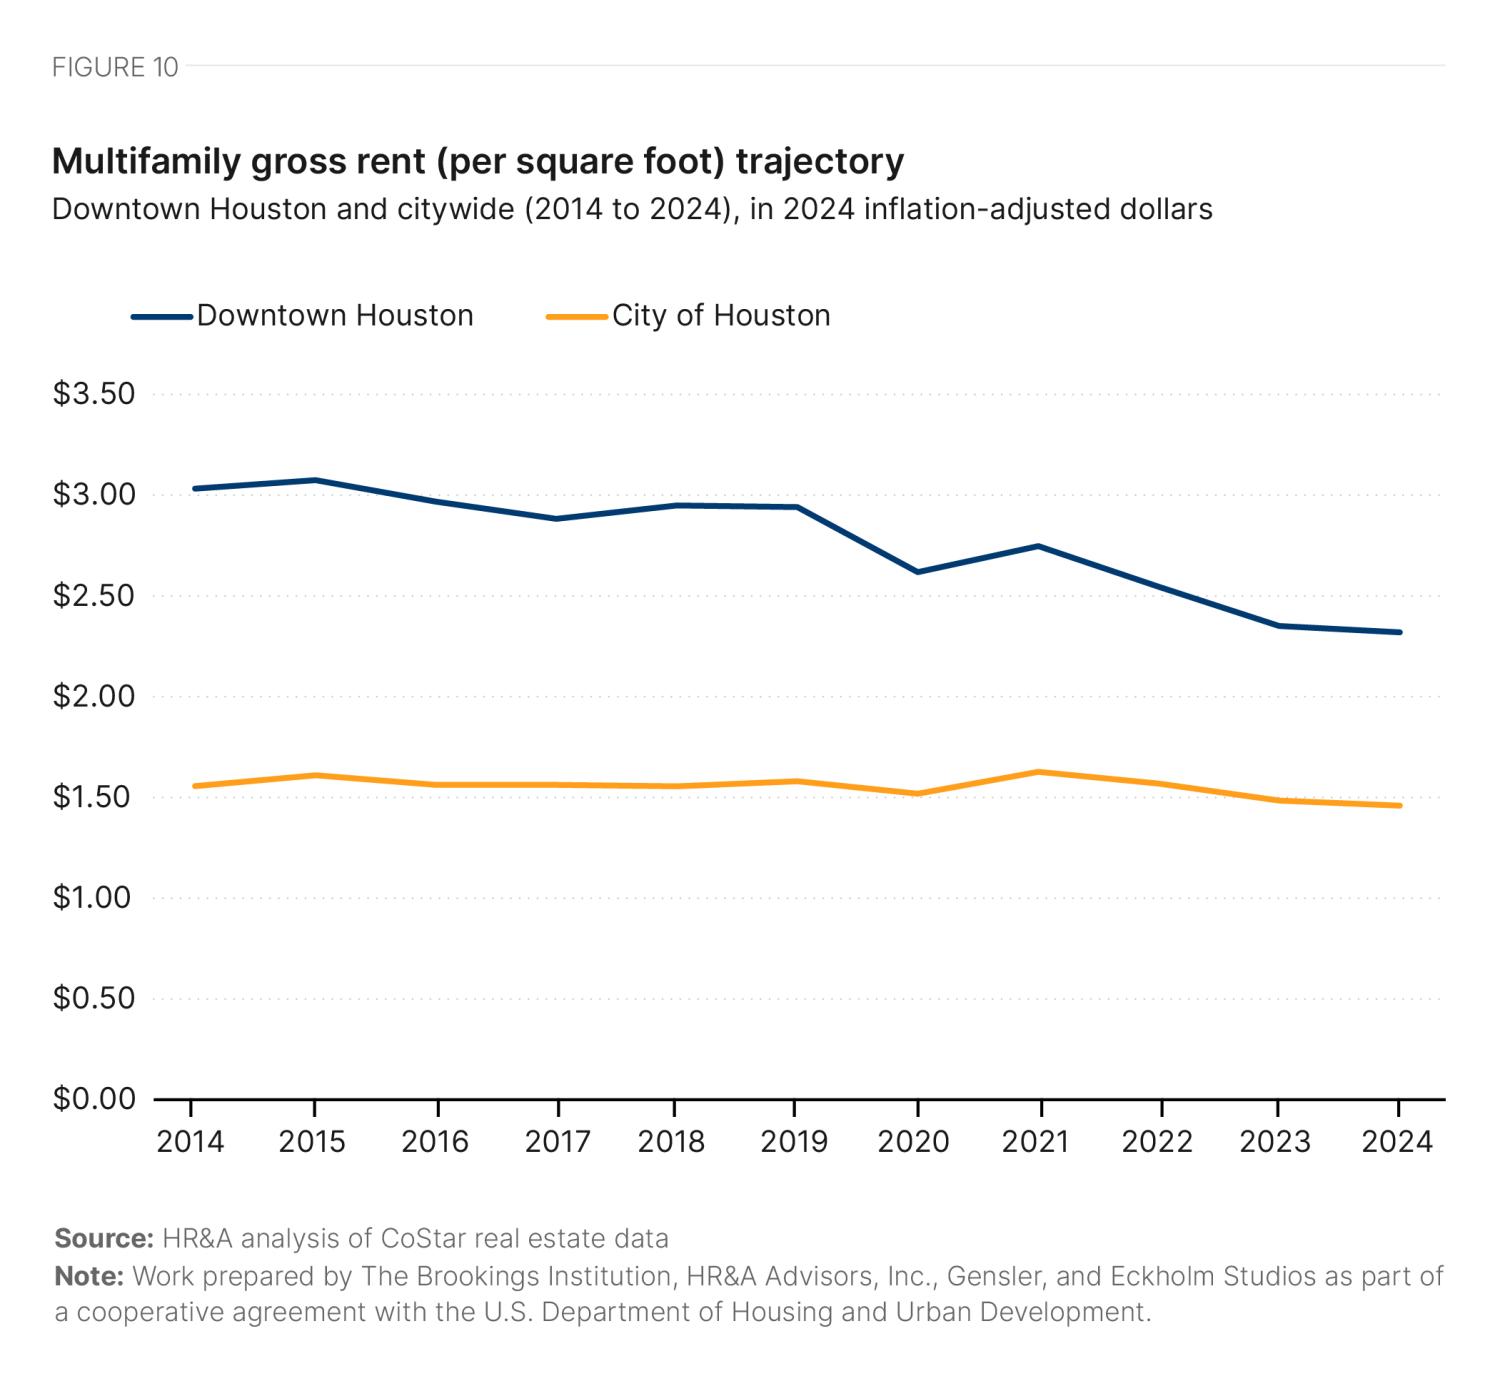
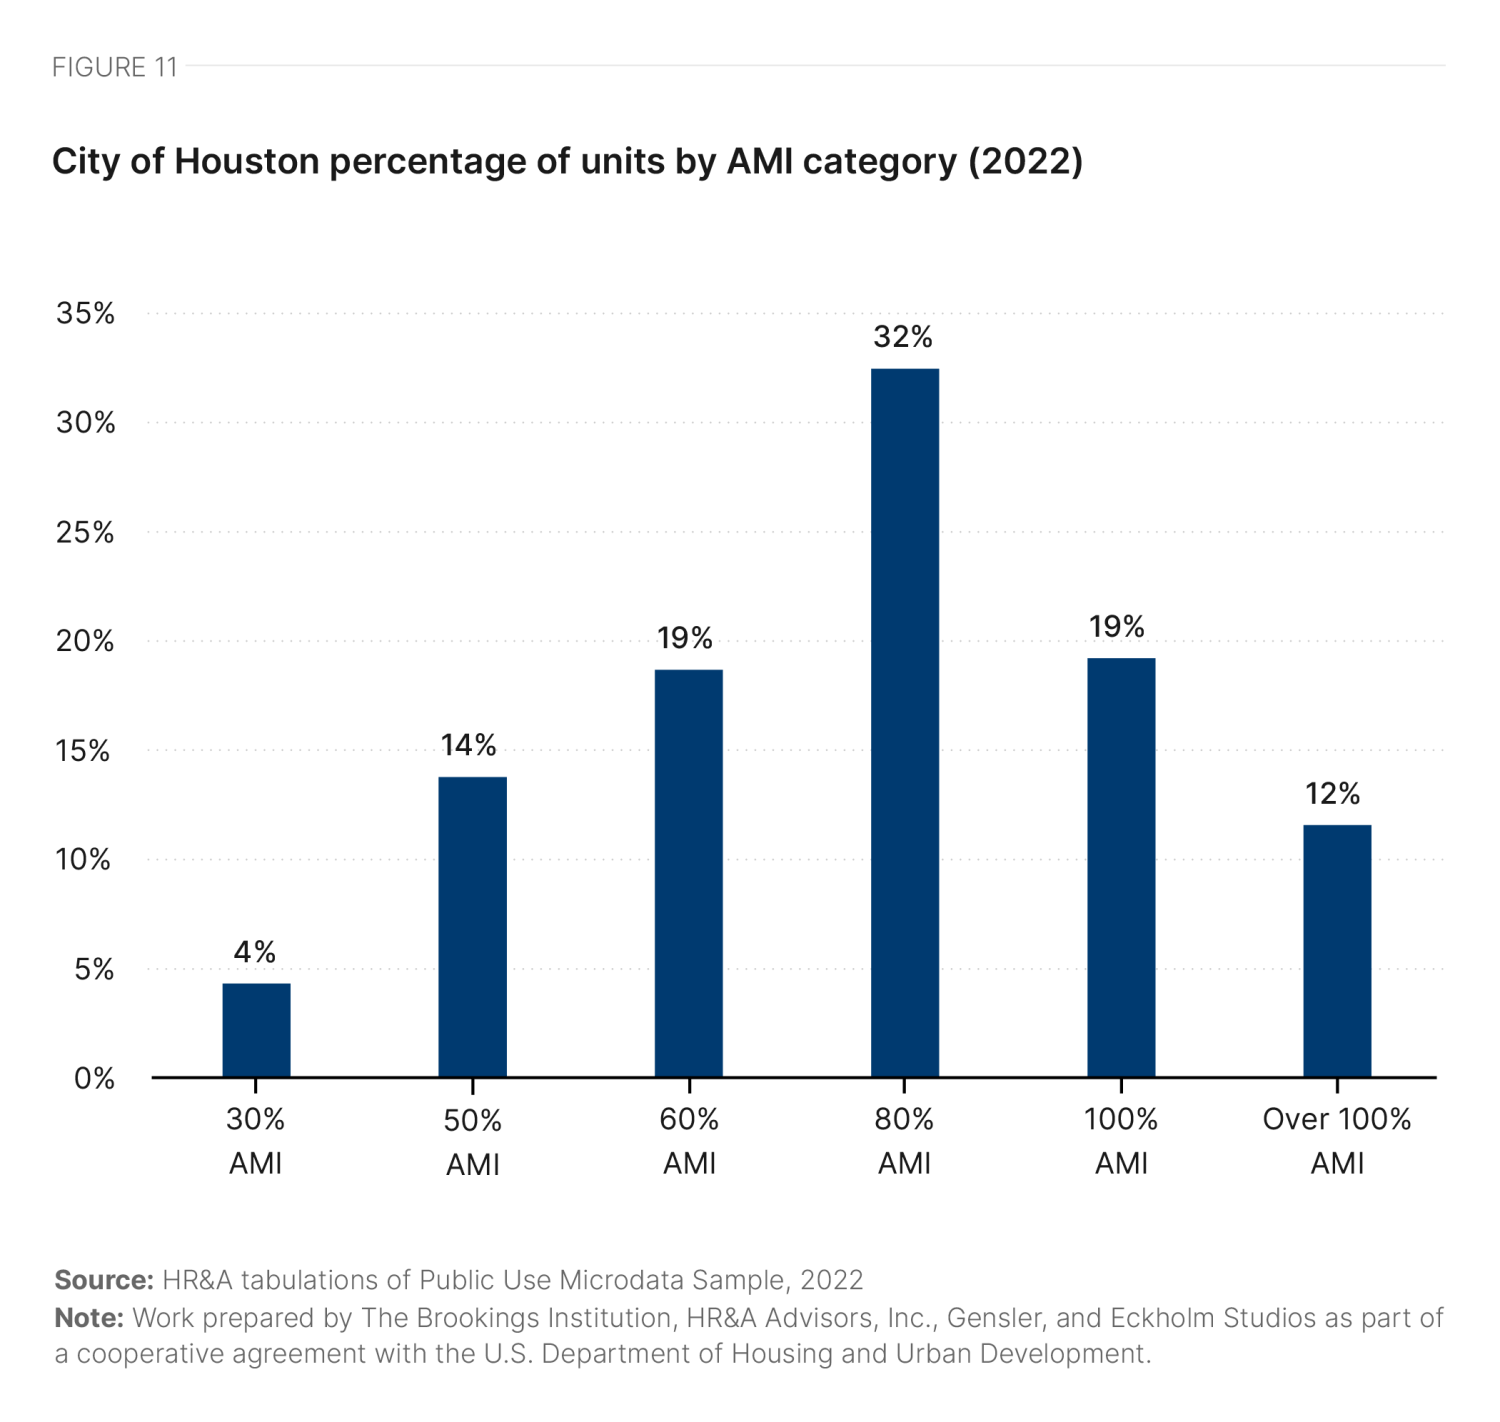
As with office rents, multifamily rents in downtown Houston have remained relatively constant around a decade average of $2.31 per square foot (nominally). In inflation-adjusted terms, this has translated to a 15.5% decrease in the value of rents from 2021 to 2024 (Figure 10). Downtown Houston has a low share of deeply affordable housing, with only 18% of units affordable to households earning 50% of Houston’s area median income (AMI) (Figure 11, Table 1). This share is tied with Los Angeles for the lowest proportion of affordable units out of the six case study cities we analyzed.7

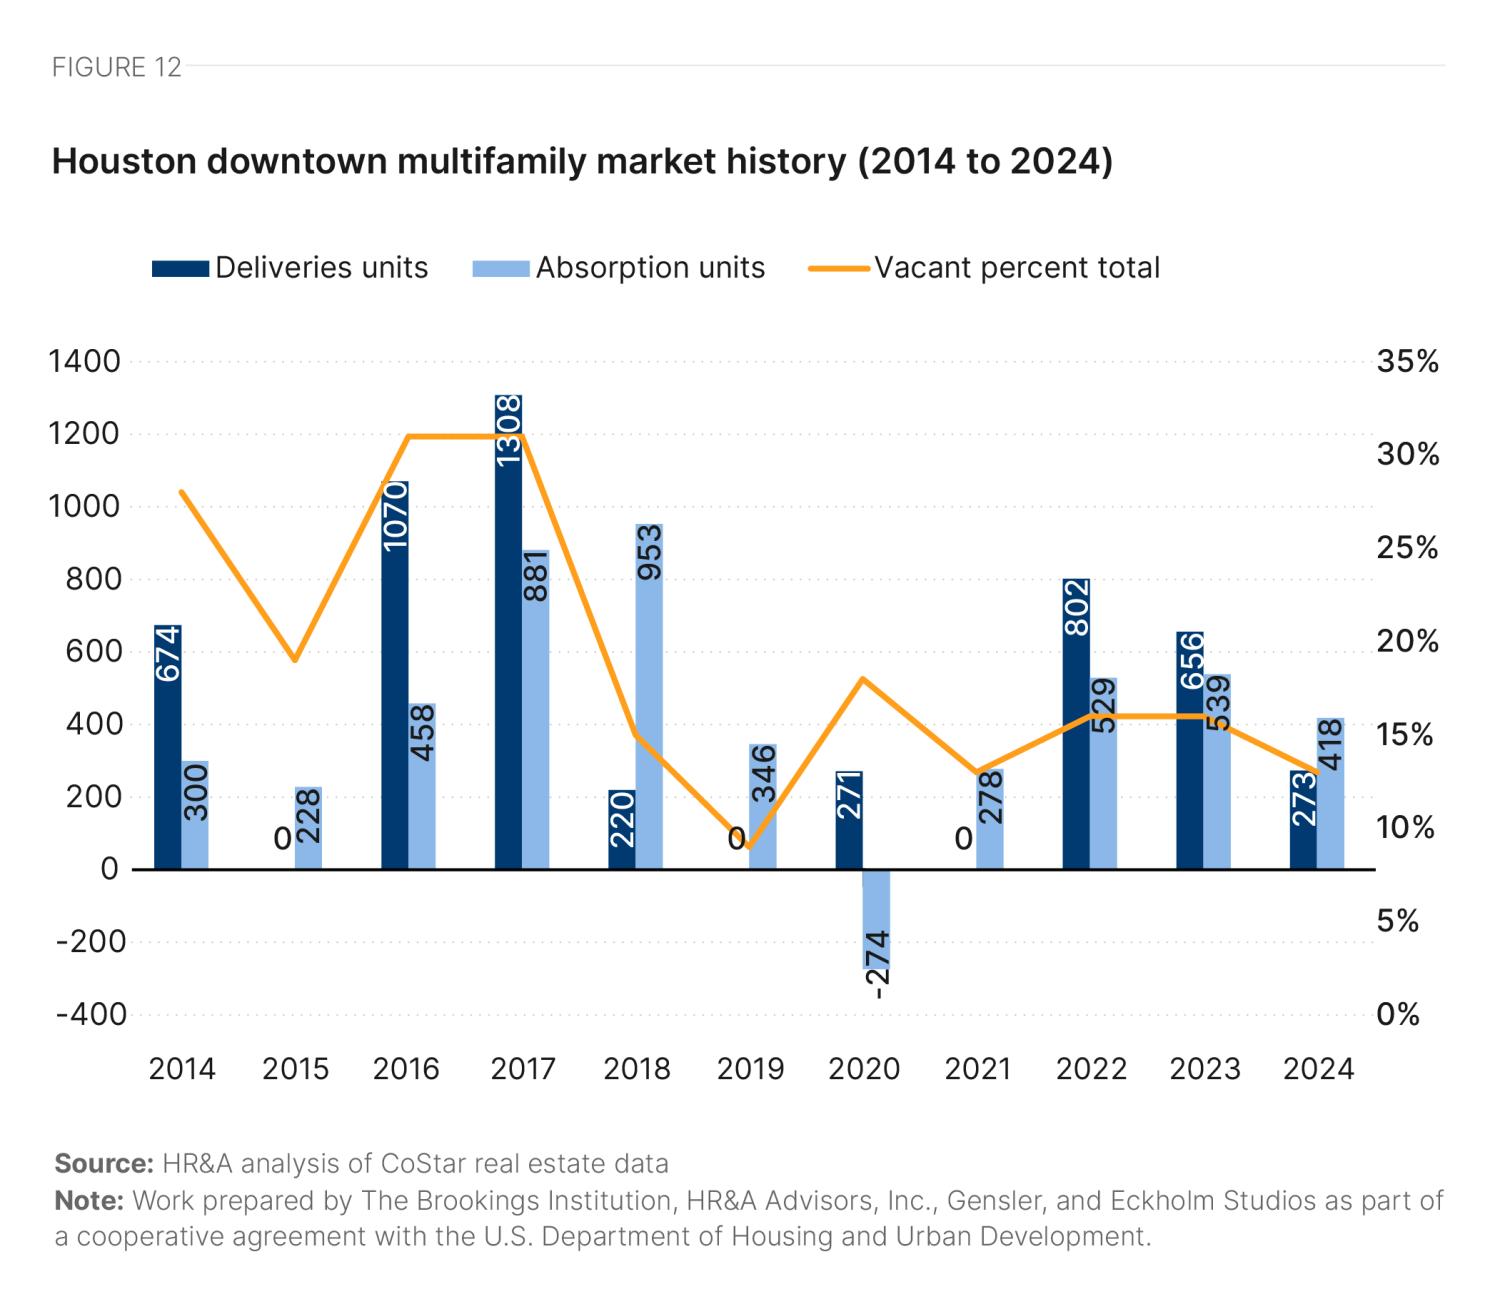
Although downtown Houston only contains 1.4% of the city’s multifamily units, its multifamily market has grown rapidly over the last decade.8 The number of downtown units has almost tripled since 2014, growing from 2,708 units that year to 7,308 units in 2024 with the delivery of 16 new multifamily buildings (Figure 12). This has outpaced absorption most years, and the downtown multifamily vacancy rate is currently 13%.9
Downtown Houston is more diverse than Texas overall. Fifty-five percent of downtown and 60% of citywide residents are nonwhite, compared to 41% statewide.10 The racial composition of downtown Houston differs significantly from the city and state: 35% of downtown residents are Black, compared to 22% citywide and 12% statewide. While the city of Houston is 45% Latino or Hispanic, compared to a statewide average of 40%, the proportion of Latino or Hispanic residents in downtown is less than half that, at 22% (Table 2).
|
Submarket |
Citywide |
Statewide |
|||
|---|---|---|---|---|---|
|
Total Population |
|||||
| White Alone Population Share | 44.6% | 40.8% | 59.1% | ||
| Black Alone Population Share | 34.9% | 22.4% | 12.2% | ||
| Other Share (anything other than White or Black alone) | 20.5% | 36.8% | 28.7% | ||
| Hispanic Population Share | 22.3% | 44.8% | 39.9% | ||
|
Population in Housing Units |
|||||
| Poverty rate | 8.9% | 19.4% | 13.8% | ||
Source: Brookings analysis of ACS 2022 5-year estimates
Note: Poverty rate used here is defined as the share of people in housing units. Work prepared by The Brookings Institution, HR&A Advisors, Inc., Gensler, and Eckholm Studios as part of a cooperative agreement with the U.S. Department of Housing and Urban Development.
As a whole, the city of Houston has a poverty rate of 19.4%—higher than the statewide average of 13.8%. However, Houston’s downtown core has a poverty rate well below average, at 8.9%—less than half the citywide rate. While the share of housing-cost-burdened households is similar between downtown (36.9%) and citywide (36.7%), the median income downtown is almost $20,000 higher than the median income citywide ($79,928 and $60,440, respectively).11 These trends underscore significant differences between the population currently living in downtown Houston and the city overall.
Political, policy, and financial conditions
Houston is governed by a strong mayor (who serves as the chief executive of the city) and a 16-member city council. All municipal seats and elections are citywide and nonpartisan. School districts in Texas are independent of other units of local government and have their own elected boards of trustees. While Houston does not have a zoning code, it still has an appointed planning board to oversee subdivision applications. The planning and development department also still has work to do, as Houston is an “elastic” city with a long history of expansion through annexation and an extraterritorial jurisdiction. New construction is still subject to a building code and permitting process that includes review by various city departments.
The Mayor’s Office of Economic Development manages a portfolio of economic incentive programs that it uses to partner with local, county, regional, and state economic development entities. These include the Texas Economic Development Corporation and a variety of business membership groups with differing geographic focuses and sectors of expertise, including the Greater Houston Partnership and the Bay Area Houston Economic Partnership. On the housing side, the Harris County Housing Authority is essentially a nonprofit, publicly owned enterprise with some government powers, such as the ability to issue bonds.
Within the city, the oil crisis was a catalyst for new forms of civic engagement and collaboration. Downtown Houston has been served by Central Houston, Inc., a membership-based business and civic alliance with 501(c)(6) IRS tax status since 1986. This group helped advocate to establish the Houston Downtown Management District through an act of the Texas state legislature in 1995, to collect a self-levy on downtown real estate to pay for hyperlocal management, services, and improvements such as enhanced investments in cleaning and public safety. Around the same time, the Houston City Council established the Downtown Redevelopment Authority to manage revenues from Tax Increment Reinvestment Zone (TIRZ) #3—a form of tax increment financing for infrastructure and real estate development. While each of these entities has their own authorization, revenue model, and governing board, their efforts share staff and are coordinated through a strategic alignment plan unified under the single brand Downtown Houston+. A final major player in downtown is Houston First, a local government corporation that, among other activities, operates the convention center.
Over the past two decades, Houston has seen a wave of conversions from offices to hotels, which supports visitation to the baseball park and convention center.12 As the hotel market becomes saturated, developers are exploring residential as an alternative, with projects such as the 372-unit Elev8 recently coming online. However, there are divergent views on the extent to which conversion should receive state subsidy. While the state has a generous historic preservation tax credit program, most Houston office buildings are not old enough to be eligible.
Downtown Houston+ and Houston First are the main advocates for bringing more residential development to downtown. Top motivations for promoting conversion include:
- Diversifying land use downtown in order to activate downtown at more hours of the day.
- Strengthening the attractiveness of the convention center and the demand for local retail.
To achieve this objective, they have advocated for a renewed Living in Downtown development incentive, mirroring the 2012 incentive that spurred the first wave of downtown residential development. Administered in partnership with the Houston Downtown Management District, the original incentive offered $15,000 per door to residential developers to build in the area, for up to 2,500 units (i.e., $37.5 million). Uptake of the incentive was very strong and exhausted available funds, ultimately sparking significant additional unsubsidized construction. New buildings created a short-term glut of supply that the market needed several years to fully absorb, bringing downtown to the eve of the pandemic.
Now, Downtown Houston+ points to this currently unfunded incentive as a proven catalyst for residential development that could now be targeted to adaptive reuse and affordable housing. However, the state authorization by which the program was created has been criticized by State Senator Paul Bettencourt and others as being too generous and flexible, and there is little consensus on a path forward.
On the policy front, Houston’s lack of zoning in theory creates an environment that is highly conducive to office-to-residential conversion. The city of Houston has made numerous attempts to streamline its permitting process for buildings. Since 2011, all city permitting staff from six departments have been co-located at the Houston Permitting Center. An initiative to integrate currently separate digital systems supporting different aspects of the permitting process is underway. However, a hiccup has still emerged at the permitting stage of projects, derived in part from the city of Houston’s strained relationship to its fire department.
A core part of the permitting process is building inspection—a process run by the fire department, which has been embroiled in a battle with the city over compensation for almost 10 years. Respondents noted that the strained relationship between the two entities has drawn out permitting timelines and delayed important conversations about how the department interprets building code in the context of office-to-residential conversion.
You can engineer around it, but that just blows your cost out. Now, the question is: Is a quarter-inch on a stair going to save somebody's life? Help somebody improve egress or ingress of fire? Practically no, right?
A Houston stakeholder
The fire marshal is interested in nobody…It takes quite a while to get through [the fire department]. Literally half the time of construction is permitting.
A Houston stakeholder
While the city and the firefighters union recently reached an $650 million agreement, the mayor and council’s decision to cover firefighter payroll through debt in the form of bonds is extraordinarily fiscally controversial. This troubling fiscal outlook is just one dimension of the unsustainable larger Houston fiscal model.
Beyond downtown, Mayor Sylvester Turner’s second administration, which ended in 2023, advanced two key parking policy reforms to facilitate infill development, including adaptive reuse:
- In 2019, the Market-Based Parking area was expanded to more areas adjacent to downtown.
- In 2020, parking requirements were exempted or reduced for transit-oriented development (TOD) citywide through the Walkable Places Ordinance.
Through the Tax Increment Reinvestment Zone, downtown Houston is able to create tailored, project-based incentives, which were used to kickstart initial hotel and residential development downtown. In addition, in 2015, the Texas legislature created a generous, uncapped 25% historic preservation tax credit. This credit is commonly used on eligible conversion projects, meaning the building is over 50 years old and listed on the National Register of Historic Places. However, 75% of Houston’s office inventory is not yet old enough to qualify for that tax credit—part of why downtown Houston has advocated for a revival of the Living in Downtown development incentive.
Table 3 shows an overview of all the main state and local tools available to support conversion in Houston.
|
Type |
Name |
Details |
|
|---|---|---|---|
|
Grant |
|||
| Tailored, project-based incentives | |||
|
Tax Credit |
|||
| 25% credit, which can be sold. No transaction or state cap. | |||
Note: Work prepared by The Brookings Institution, HR&A Advisors, Inc., Gensler, and Eckholm Studios as part of a cooperative agreement with the U.S. Department of Housing and Urban Development.
Past and future conversion activity
While many conversions happened prior to the pandemic—particularly office-to-hotel—only one office-to-residential conversion project has been completed since March 15, 2020. At least four projects are in the planning process (Figure 13).
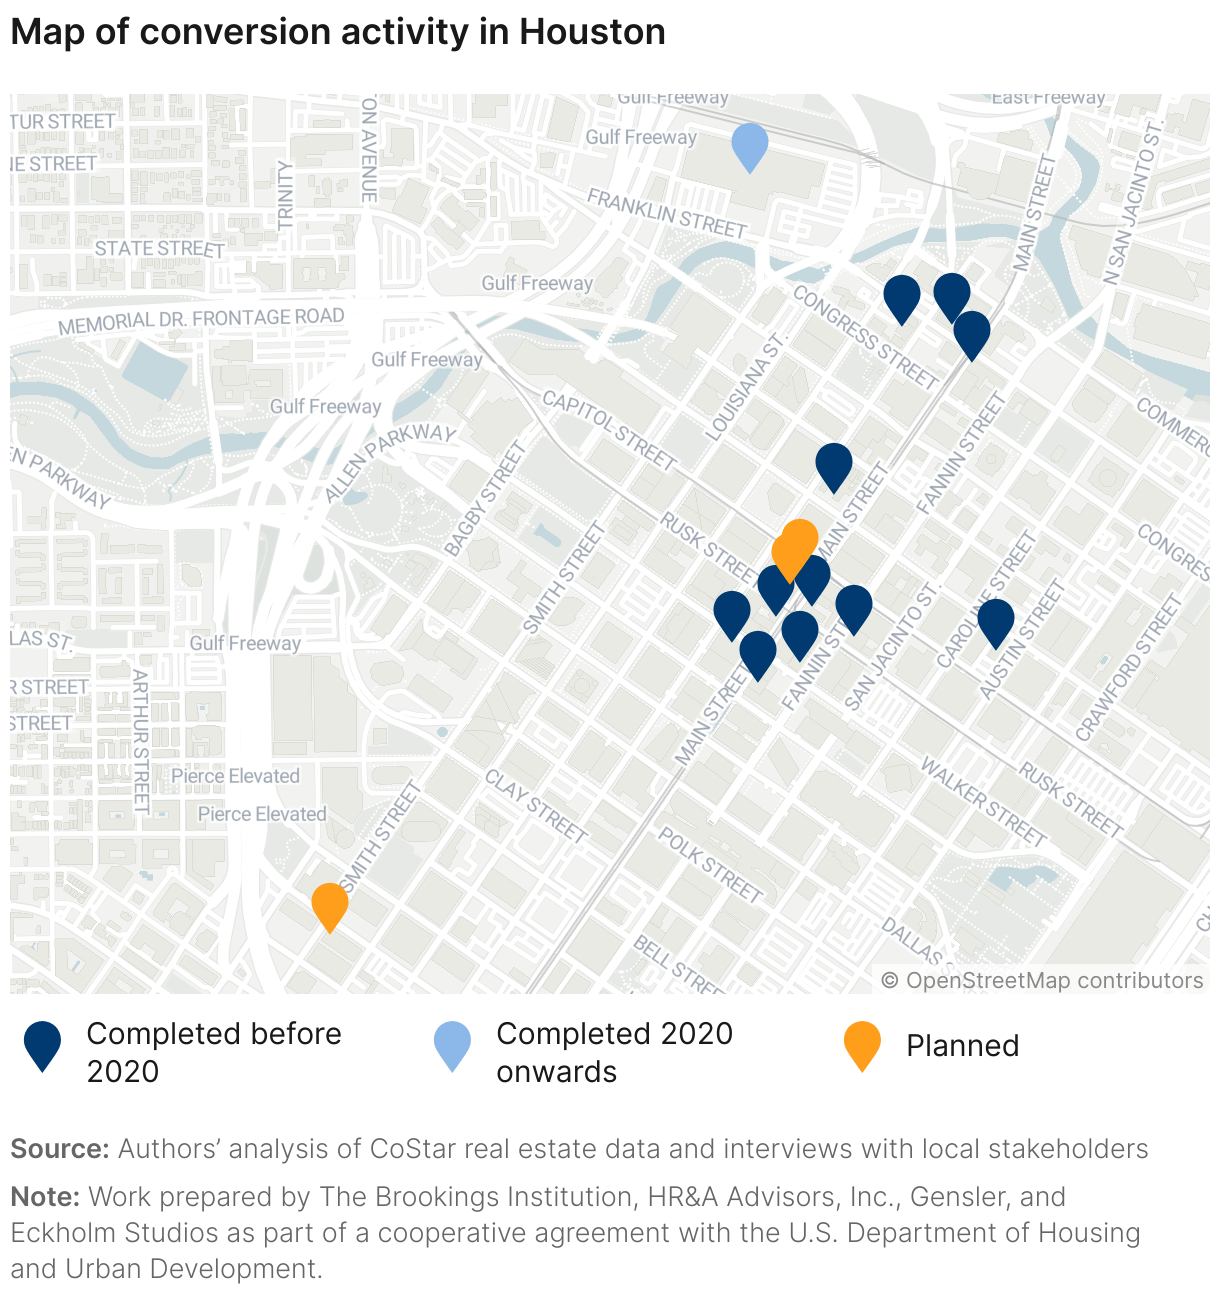
Elev8
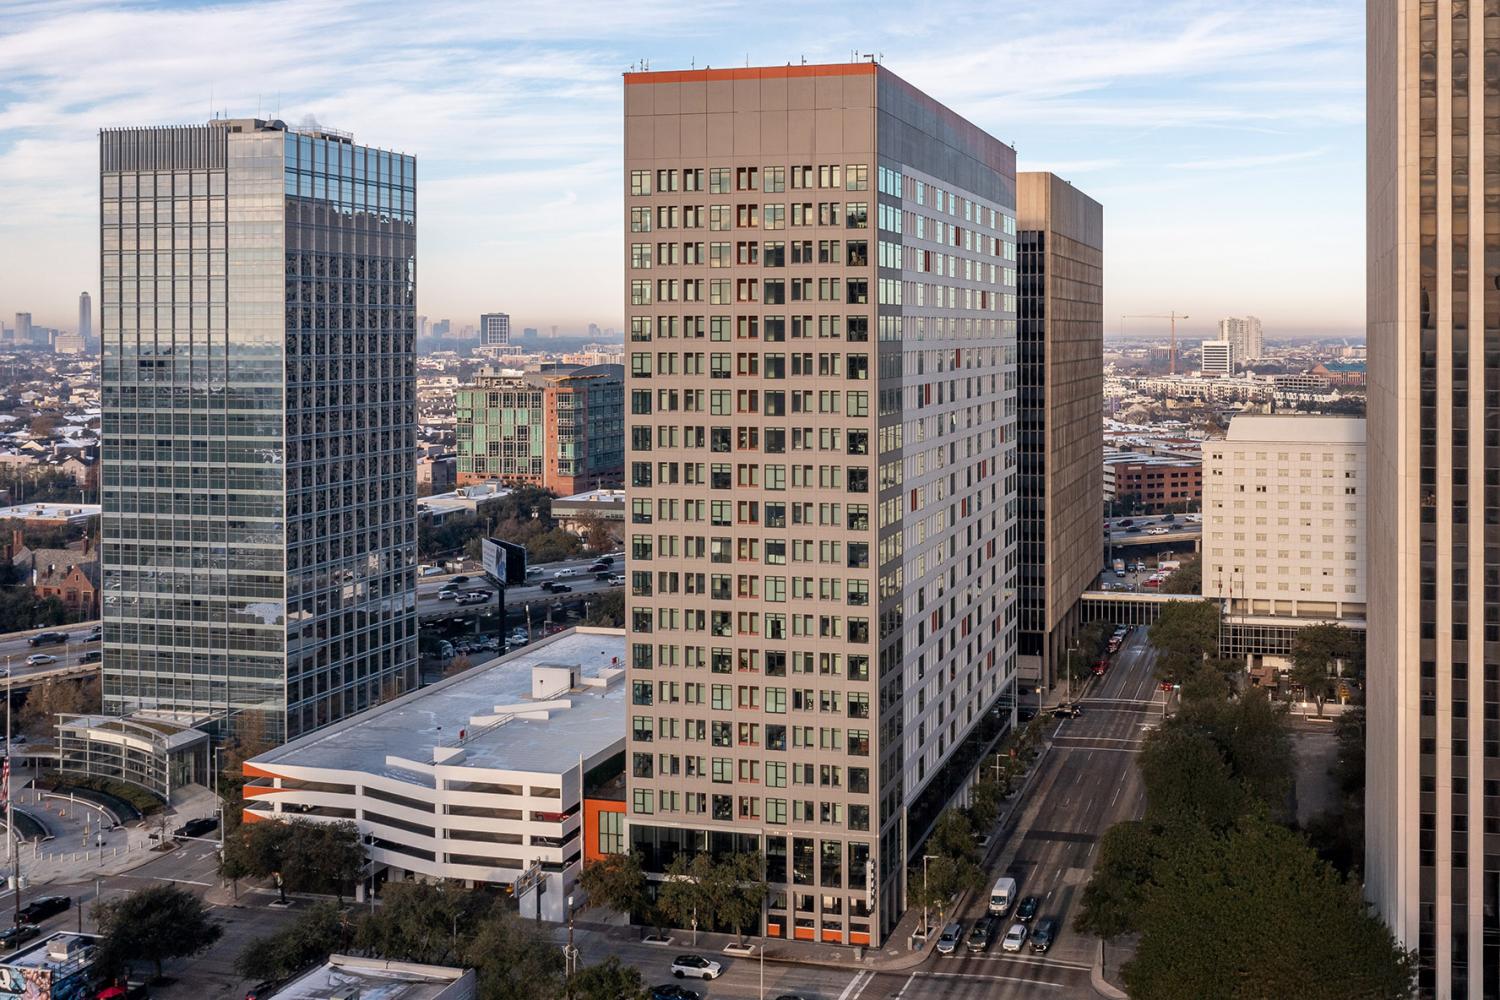
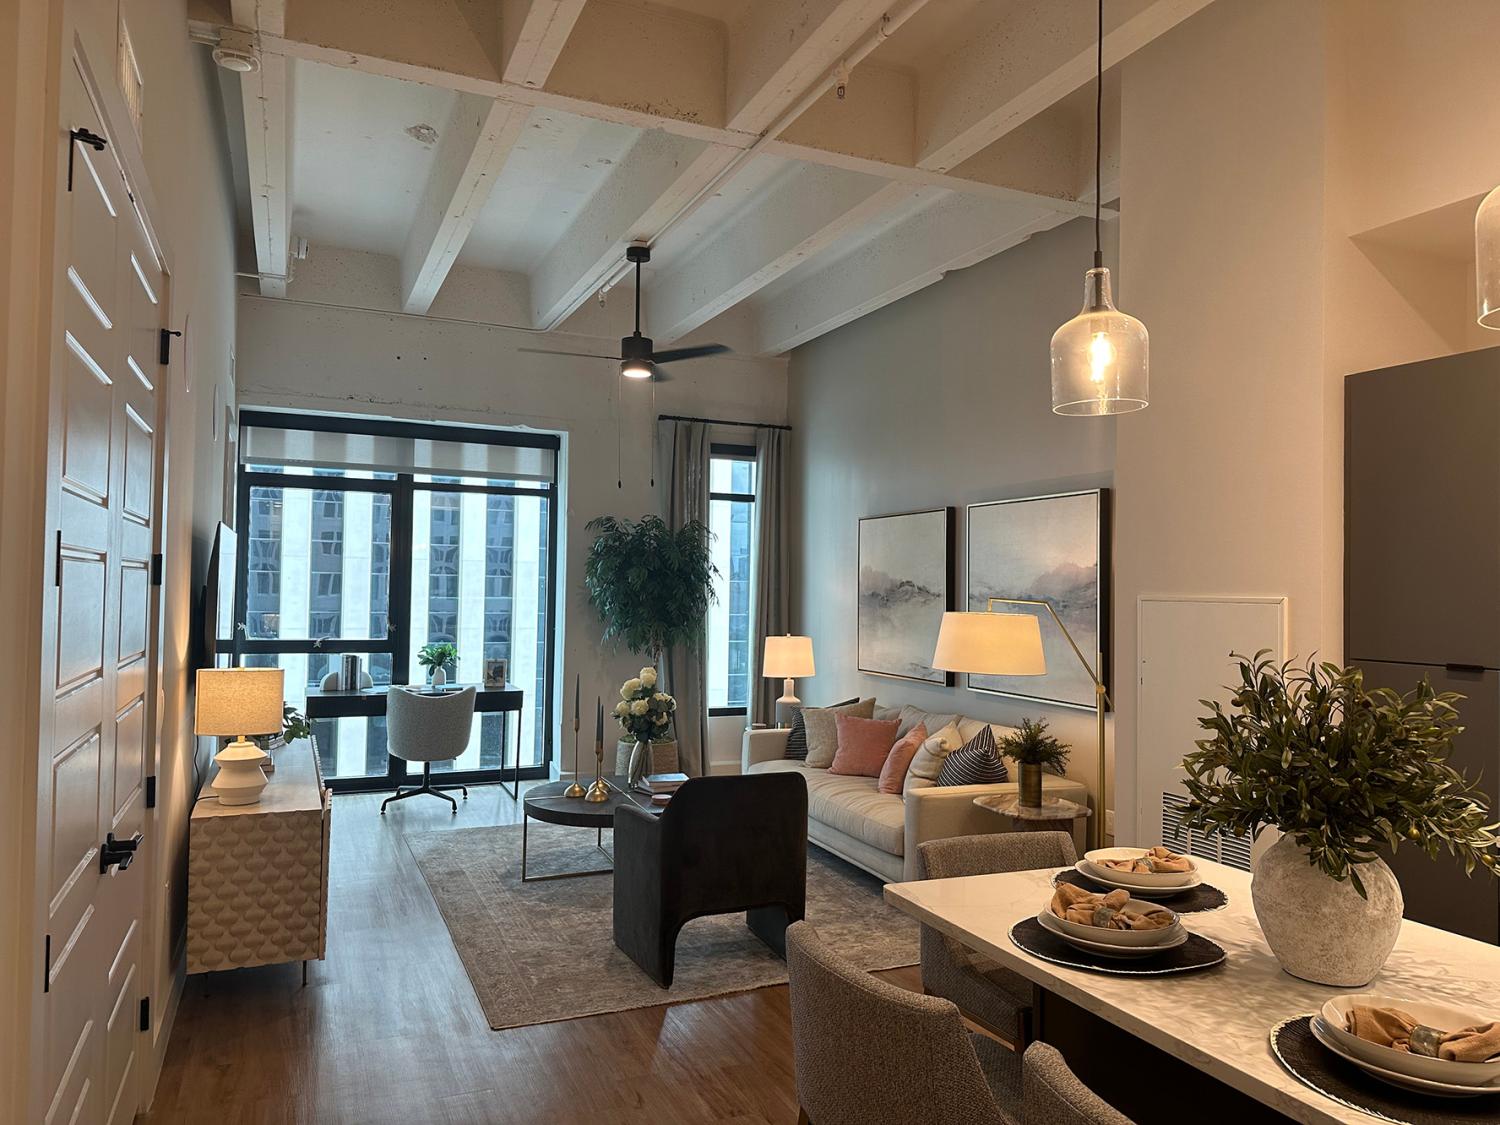
600 Jefferson St.—now known as 1801 Smith St.—is a 20-story office tower built in 1972. It was once known as Continental Center, and served as the headquarters of Continental Airlines. The office tower was one of a pair of twin towers still connected today by a skybridge. By 2021, the building’s occupancy had dropped below 30%, with successive departures of anchor tenants such as United Airlines and the Houston Fire Department.13 The building was acquired by Florida-based DeBartolo Development and converted to Elev8, a 372-unit luxury apartment project (Table 4). The remaining tower is still an occupied office building. No government incentives were used in the conversion (Table 5).
|
Name |
Elev8 |
| Address | 1801 Smith St., 77002 |
| Owner | DeBartolo Development |
| Gross square feet | 450,001 |
| Building history | Former office |
| Year built | 1972 |
| Year converted | 2024 |
| Number of converted floors | N/A |
| Average floor plate size | N/A |
| Number of units | 372 |
| Unit mix by type | 36 x Studio, 236 x 1BR, 100 x 2BR |
| Average rent | $3,328 |
| Average rent per square foot | $3.84 |
| Affordability | Market rate |
| Acquisition price | $20,600,000 |
Source: Authors’ analysis of CoStar real estate market data and interviews with local stakeholders
Note: Work prepared by The Brookings Institution, HR&A Advisors, Inc., Gensler, and Eckholm Studios as part of a cooperative agreement with the U.S. Department of Housing and Urban Development.
|
Financing type |
|---|
| Traditional financing |
| Developer equity |
| Senior construction loan |
Source: Authors’ interviews with local stakeholders
Note: Work prepared by The Brookings Institution, HR&A Advisors, Inc., Gensler, and Eckholm Studios as part of a cooperative agreement with the U.S. Department of Housing and Urban Development.
JW Marriott

The Carter Building—now known as the JW Marriott—was the tallest building in Texas when it opened in 1910. The building was only 12% occupied when it was sold in 2009.14 After exploring both hotel and residential possibilities, the developer, William R. Franks Real Estate, ultimately decided to convert the property into a hotel (Table 6), which went on to receive the Driehaus Award for “best hotel adaptive reuse” from the National Trust for Historic Preservation. The project was financed with funds from the Tax Increment Reinvestment Zone and federal historic preservation tax credits (the Texas state historic preservation tax credit was not yet available). In addition, a $3 million grant from Houston METRO supported related infrastructure work, as the project coincided with a planned rail expansion. Table 7 summarizes the capital stack.
|
Name |
JW Marriott |
| Address | 806 Main St. |
| Owner | Southwest Value Partners |
| Gross square feet | 224,914 |
| Rentable square feet | N/A |
| Building history | Former office |
| Year built | 1910 |
| Year converted | 2014 |
| Number of converted floors | 22 |
| Average floor plate size | 10,223 |
| Number of units | 328 |
| Unit mix by type | N/A |
| Average rent | N/A |
| Average rent per square foot | N/A |
| Affordability | N/A |
| Acquisition price | N/A |
Source: Authors’ analysis of CoStar real estate market data and interviews with local stakeholders
Note: Work prepared by The Brookings Institution, HR&A Advisors, Inc., Gensler, and Eckholm Studios as part of a cooperative agreement with the U.S. Department of Housing and Urban Development.
|
Financing type |
|---|
| Traditional financing |
| Developer equity |
| Senior construction loan |
| City |
| Tax Reinvestment Zone |
| METRO TOD discretionary funds |
| Federal |
| Federal historic preservation tax credit |
Source: Authors’ interviews with local stakeholders
Note: Work prepared by The Brookings Institution, HR&A Advisors, Inc., Gensler, and Eckholm Studios as part of a cooperative agreement with the U.S. Department of Housing and Urban Development.
Future conversion potential
We assessed the architectural conversion viability of 25 high-vacancy buildings in Houston. To select these buildings, we used CoStar data to identify buildings with vacancy rates in excess of 20%. The CoStar data were then triangulated with input from qualitative interviews about potential conversion candidates and additional factors such as year built, building area, number of stories, and office class in order to identify the buildings best suited to make up a representative set of properties for architectural conversion viability analysis. Finally, three buildings were selected for detailed architectural studies based on results from the initial analysis and input from interview participants.
We assigned buildings a percentage score to denote their architectural compatibility for conversion, and grouped them into the following categories:
- Properties that score above 80% can likely convert without design compromises.
- Properties that score between 70% and 80% can likely convert with some design compromises.
- Properties that score under 70% can likely convert only with major design compromises.
From the analysis, we then projected out the number of units that would be created by converting all the scored buildings. We also projected the greenhouse gas savings associated with unit creation via conversion rather than new build activity. A full explanation of our calculation methodology is included in Appendix A.
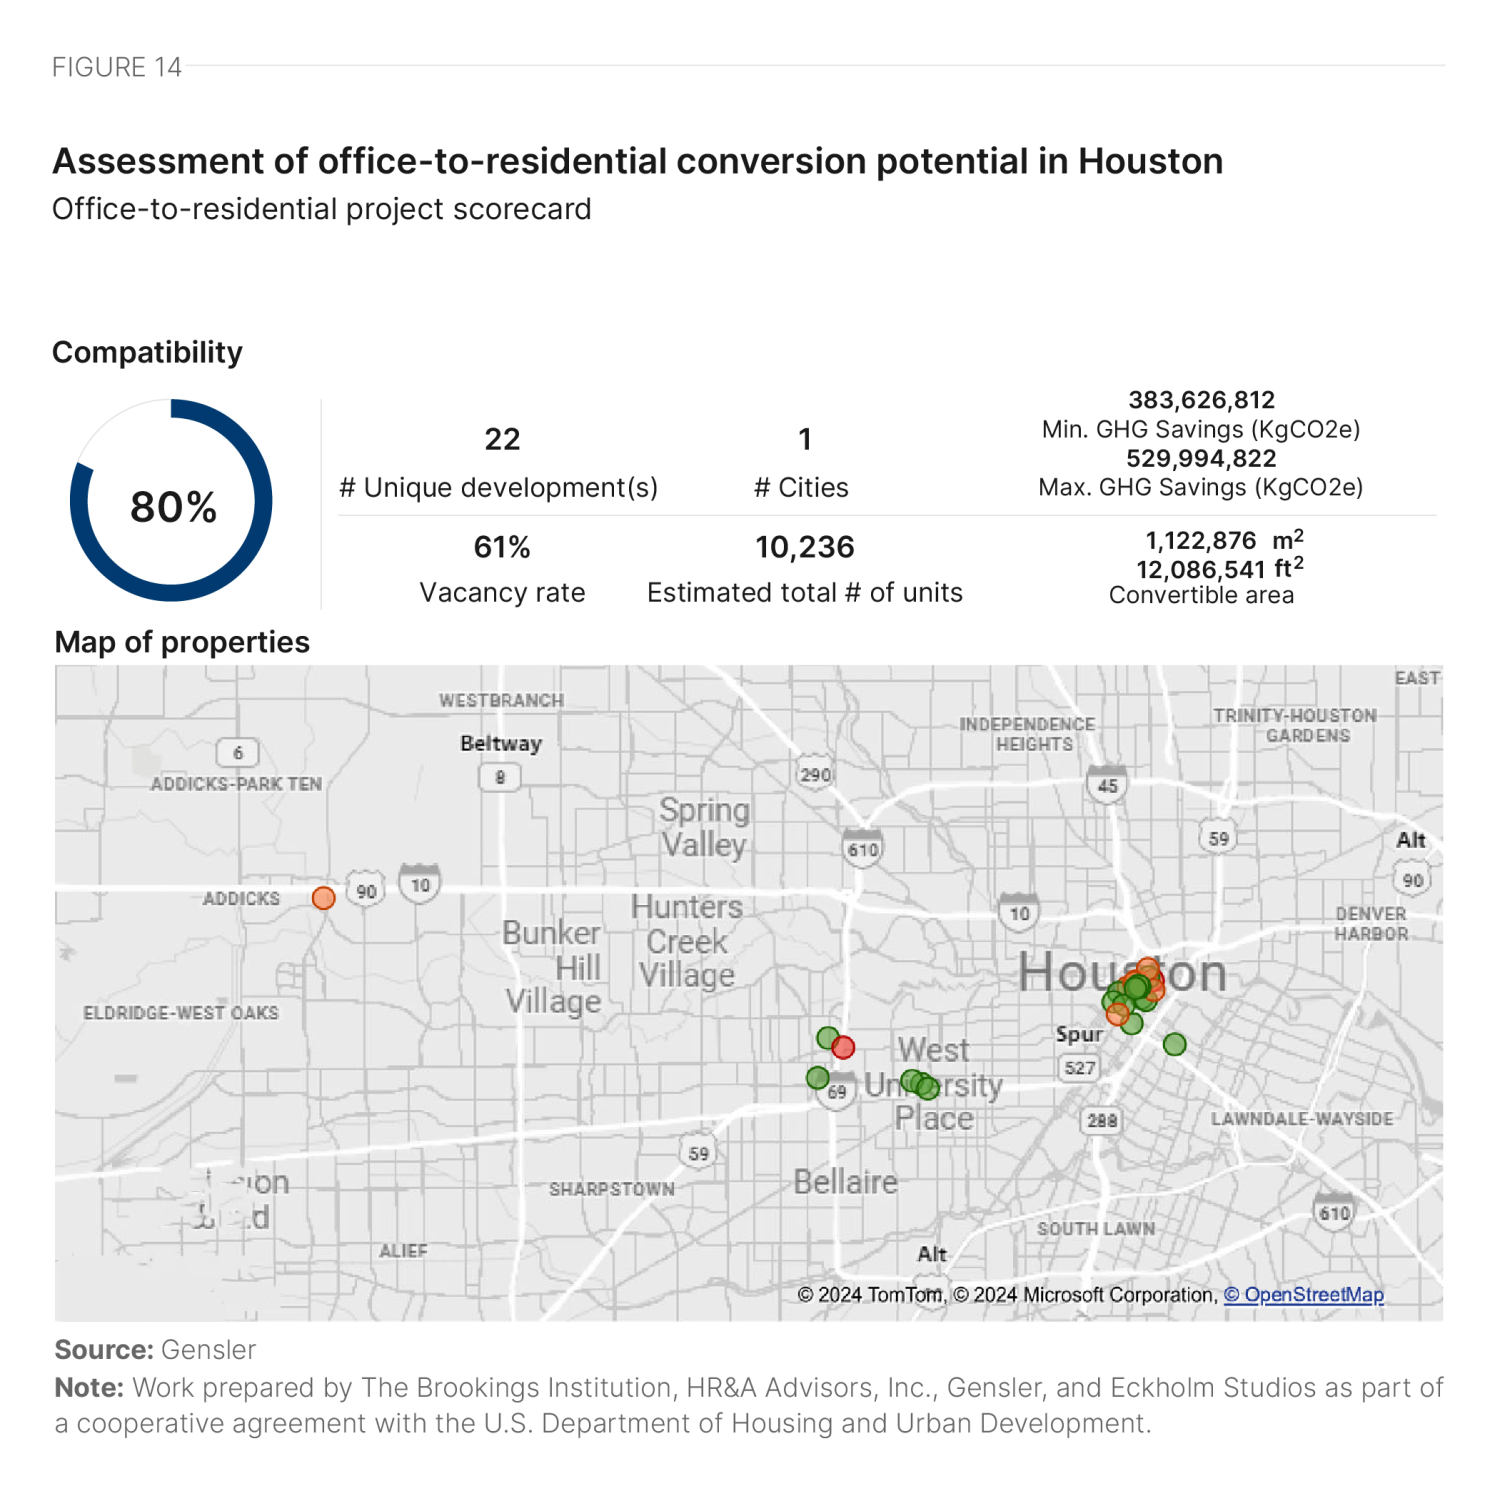
In Houston, researchers analyzed some buildings in multiple parts, studying a total of 26 distinct parts. Of these 26 parts, 16 contributed to 70% of the total building area analyzed, and each scored over 80%. Another eight parts, making up 28% of the area, scored over 70%. Overall, the average compatibility score of buildings in Houston exceeds the average score of the 1,400-plus buildings Gensler has cumulatively studied for various clients (Figure 14).
Most buildings exhibited the desired rectangular form, which positively influenced their overall scores. However, buildings such as 1600 Smith St. and 1000 Louisiana St. had wedge-shaped forms that negatively affected their scores due to challenges in unit planning and floor plate efficiency. Most nonrectangular buildings were built in the 1980s.
The majority of buildings studied had relatively large floor plates, which negatively impacted their overall scores. However, buildings such as 800 Bell St. and 1001 Fannin St. had large floor plates with an ideal core-to-window depth, resulting in reasonable floor plate efficiency. A few buildings, such as 617 Caroline St. and 412 Main St., had smaller-than-ideal floor plates, which negatively affected their scores due to constrained unit mix and lower floor plate efficiency.
Façade types varied across buildings, influencing conversion compatibility scores to different degrees. Many buildings, such as 808 Travis St. and 412 Main St., featured the desired punched windows, with most of these buildings constructed before 1970. 1600 Smith St. was unique, as it featured punched openings built in 1984. Other buildings had curtain wall façades or ribbon windows, which generally scored lower due to a higher likelihood of needing replacement or major refurbishment. Most buildings with ribbon windows or curtain wall façades, such as 1001 Fannin St. and 3000 Post Oak Blvd., were built between 1960 and 1985. The majority of buildings in Houston had unobstructed façades with openings that provided good access to natural light and views.
Good walkability, supported by reliable bus and light rail service, positively influenced the scores of all buildings analyzed. Access to food and beverage outlets, grocery stores, parks, and entertainment also improved scores, while the lack of schools downtown negatively affected them.
1001 Fannin Street
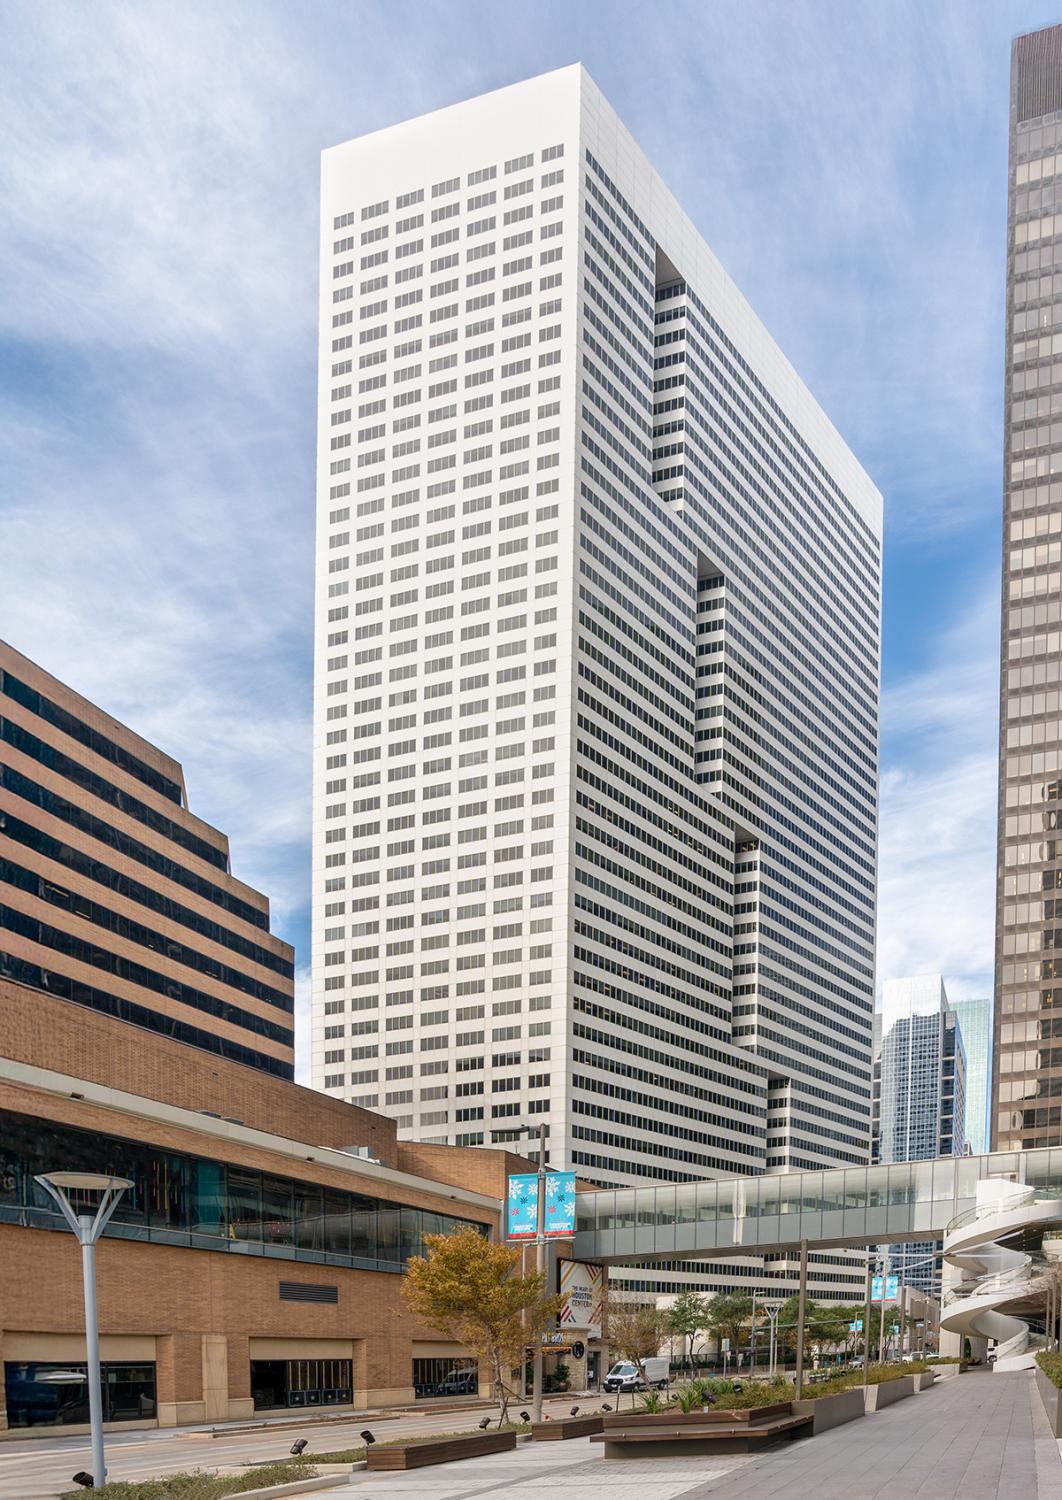
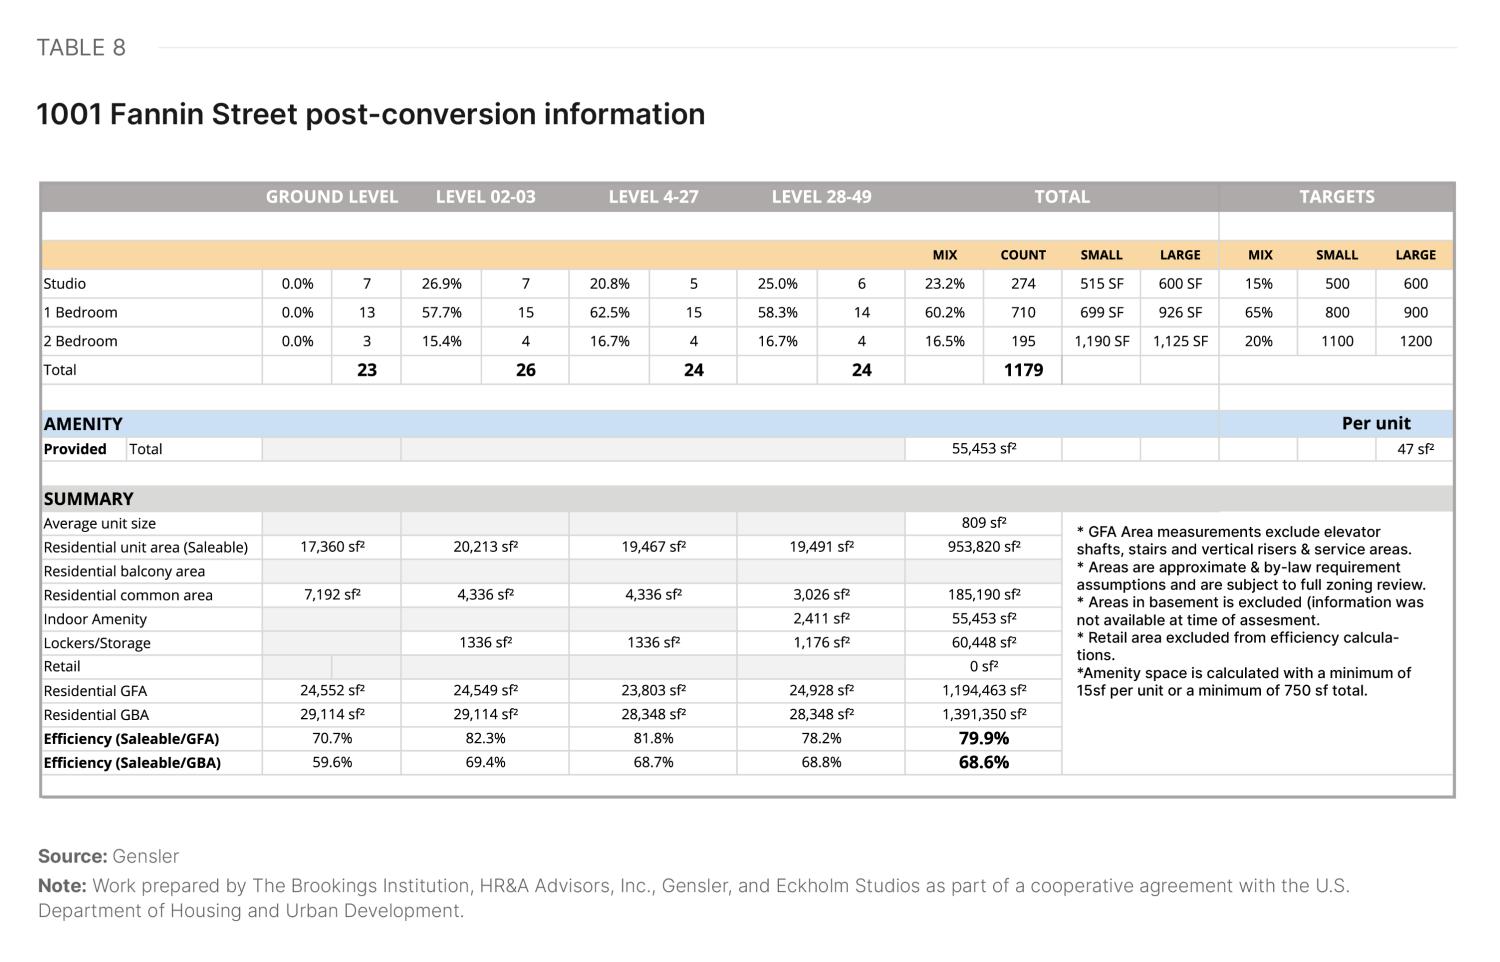
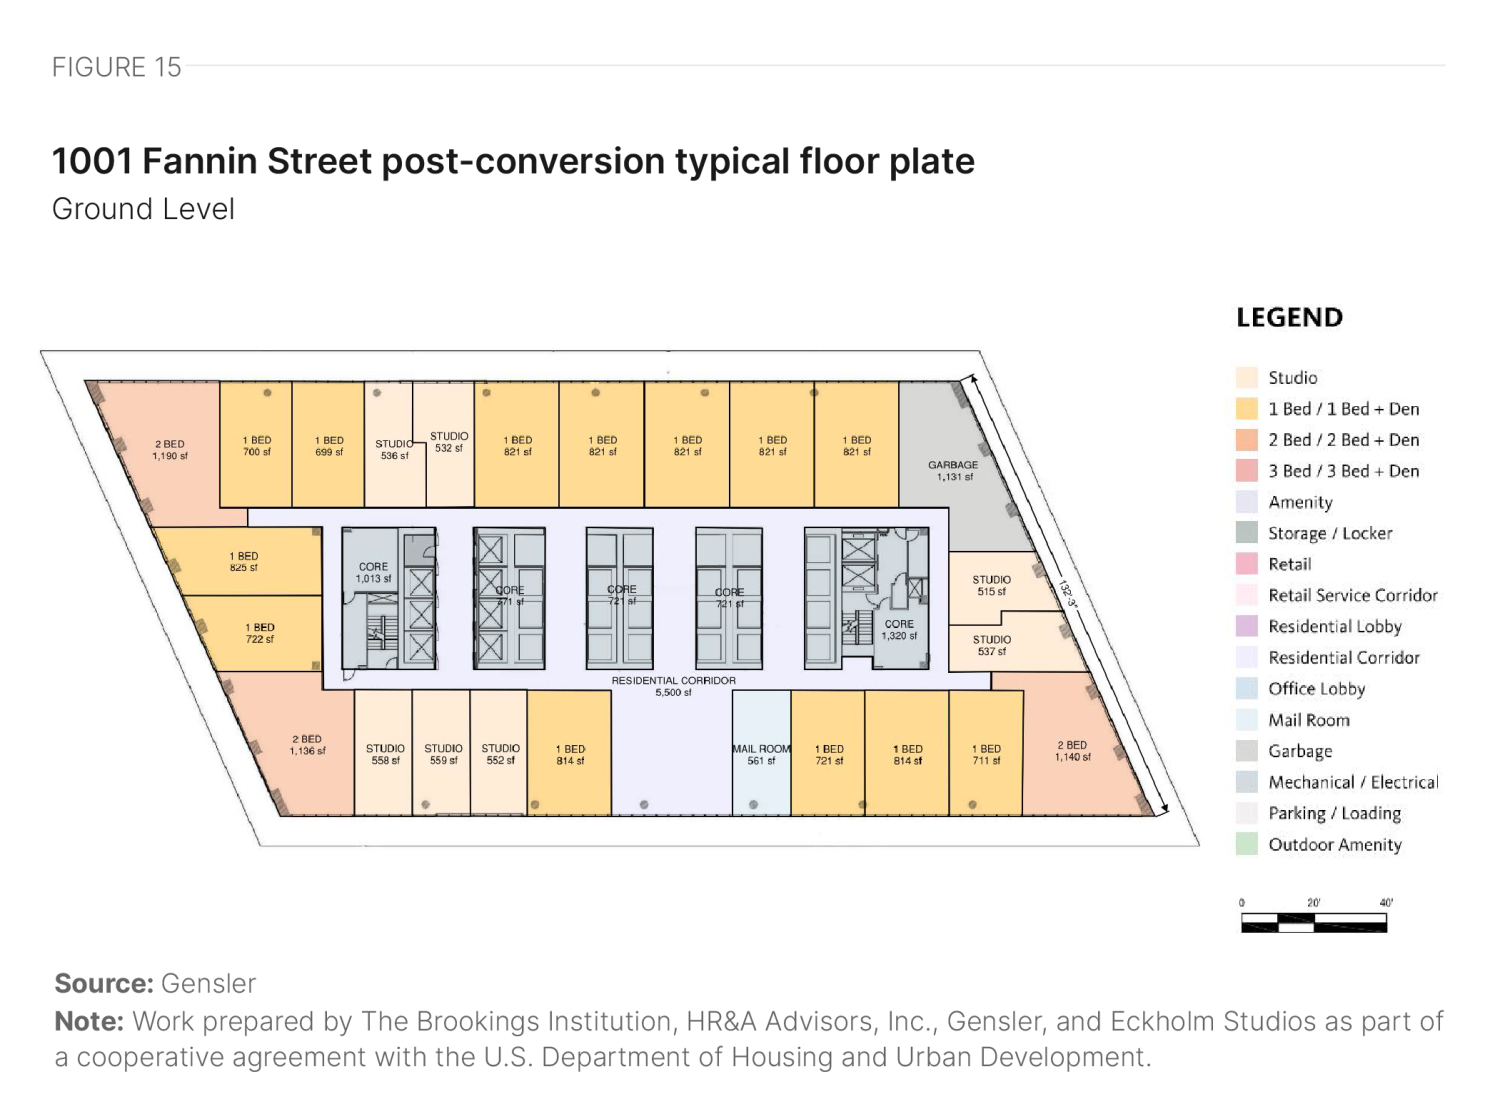
1001 Fannin St. occupies a central location in the block between Lamar Street/McKinney Street and San Jacinto Street/Fannin Street. Built in 1981, it is a 49-story structure with a gross area of 1,391,350 square feet (Table 8).
The building has a rectangular floor plate with recesses in the façade. The core sits centrally and features multiple elevator banks to accommodate the building’s size. Although the floor plate is relatively large, the core-to-window depth and lease depth are close to ideal, allowing for reasonable floor plate efficiency and nearly ideal market-size units (Figure 15). The developer can introduce amenity or storage use in interstitial spaces created by the multiple elevator banks on higher levels, where the lower-rise elevator banks drop off. The façade consists of ribbon windows on all sides, providing good access to views and daylight. If the façade is retained, the developer may need to introduce operable sections. The ground floor is expected to convert into retail space, with part of it allocated to the residential lobby and service areas.
808 Travis Street: Esperson

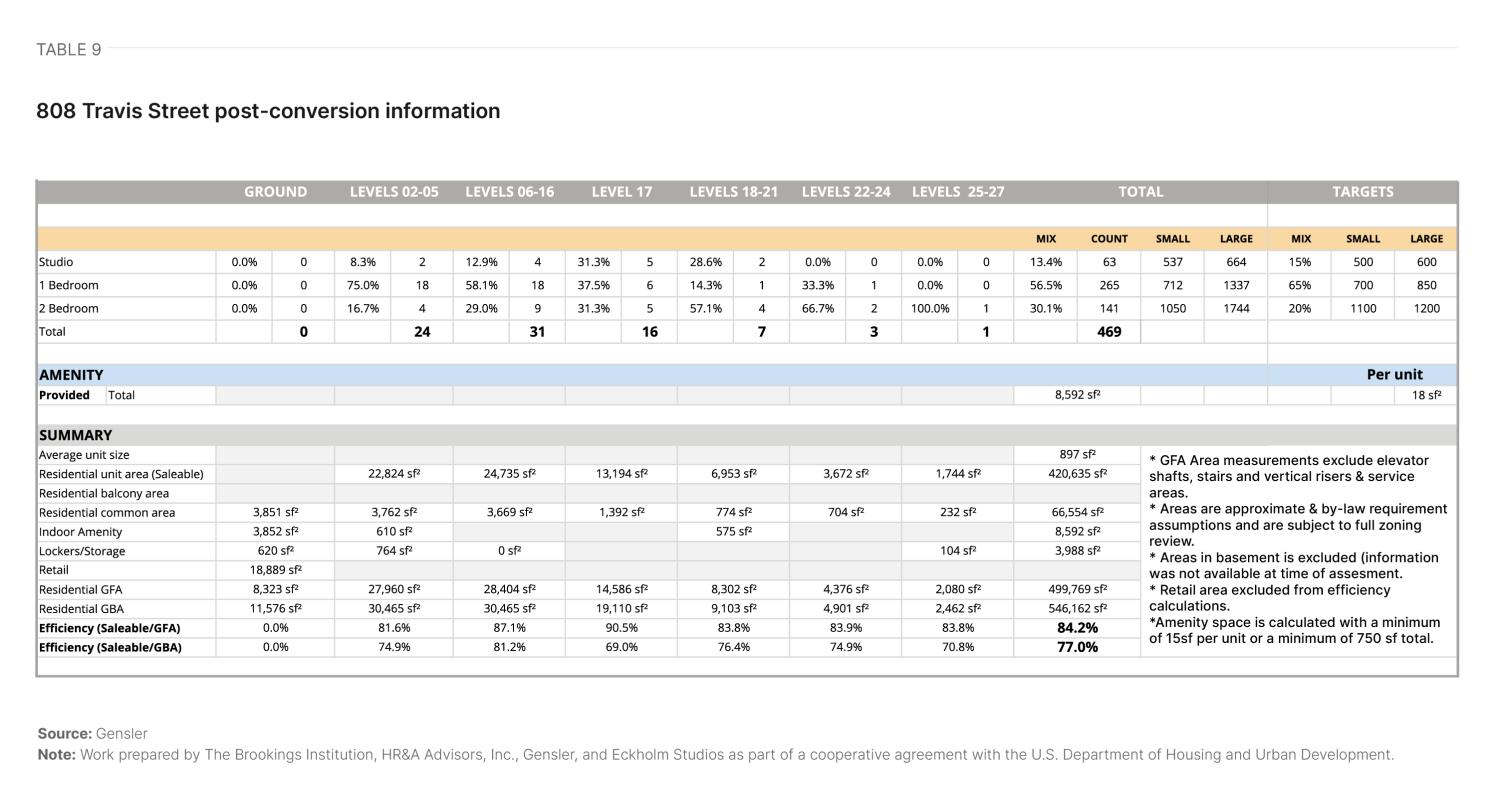
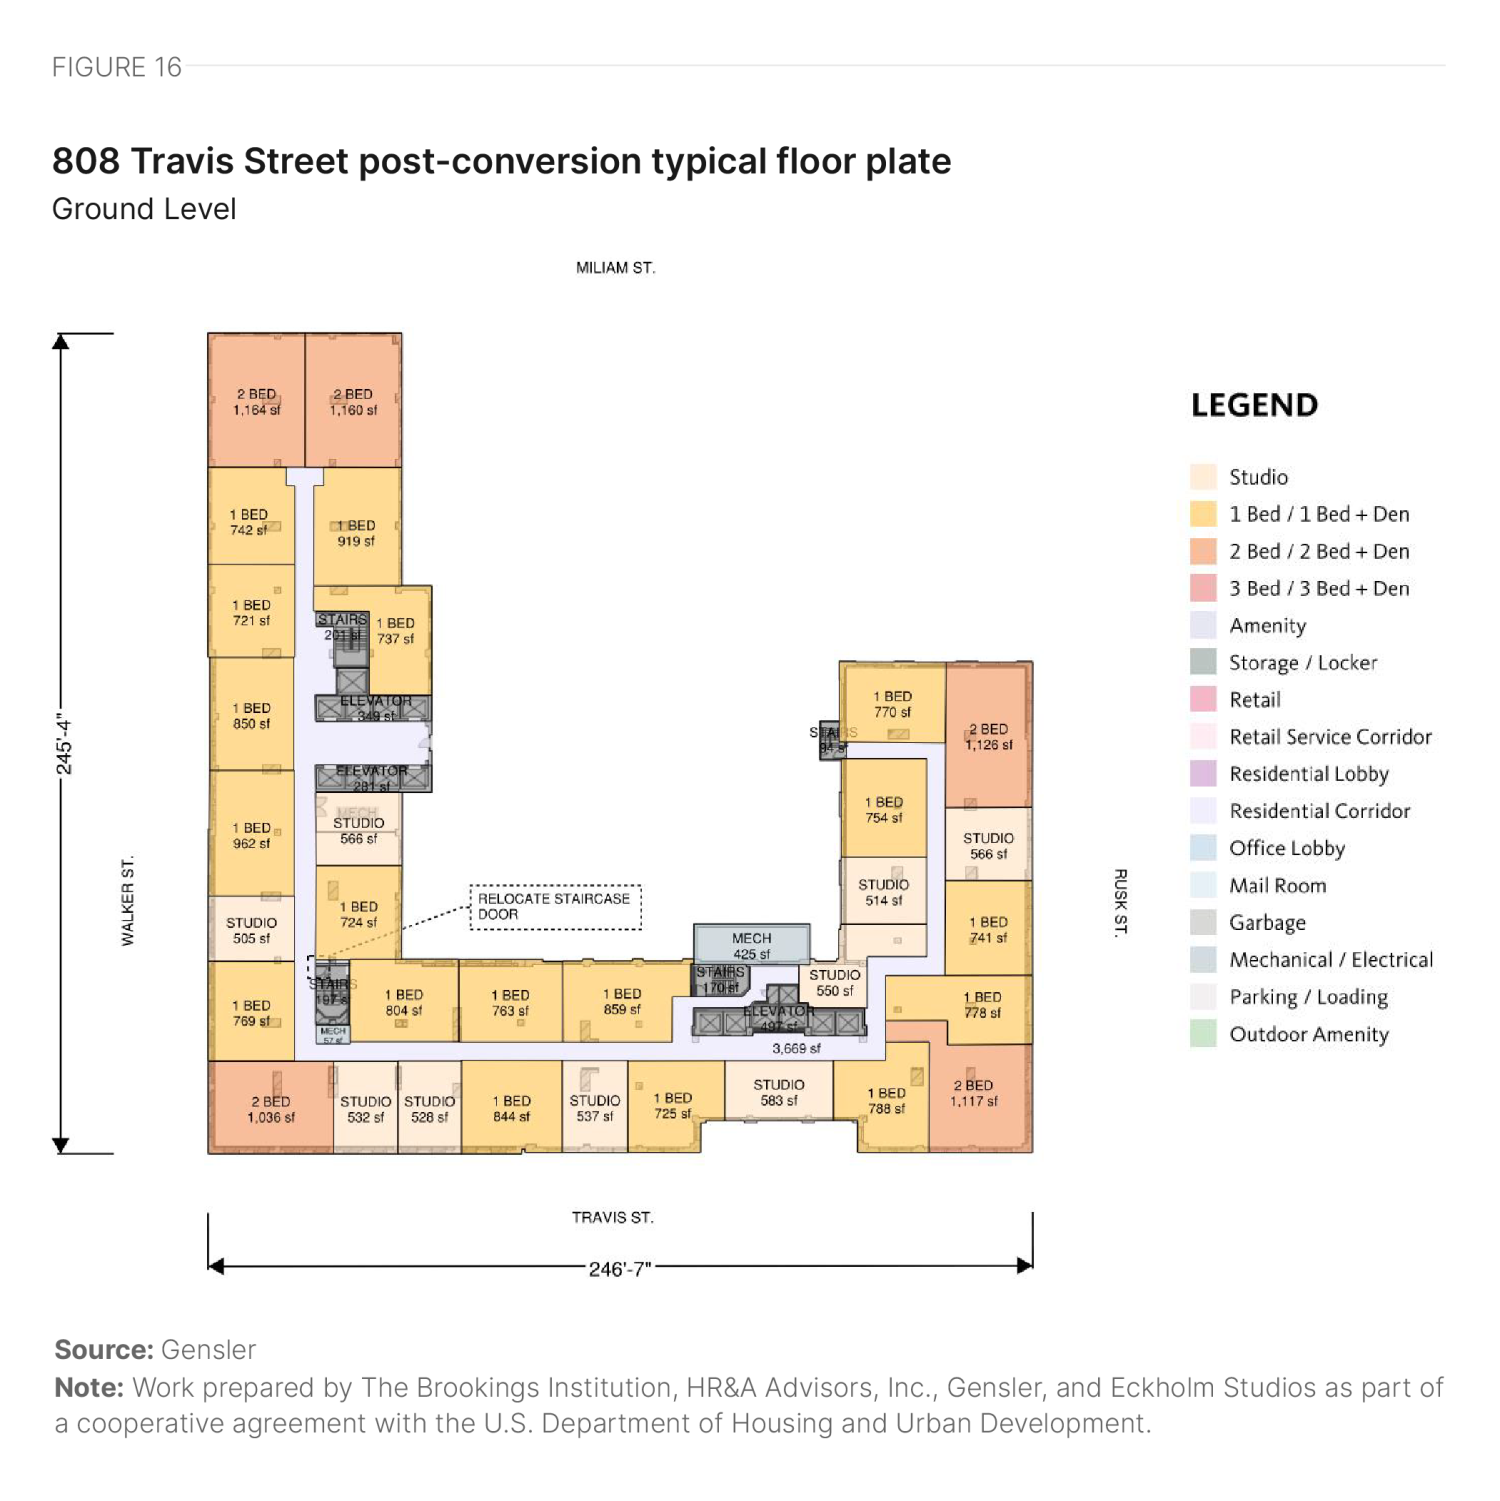
808 Travis St. sits centrally in the block between Walker Street/Rusk Street and Milam Street/Travis Street. Built in 1941, it is a 27-story structure with a gross area of 565,051 square feet, including approximately 19,000 square feet of retail space (Table 9).
The building features a U-shaped floor plate with multiple steps in its massing. The uppermost floors step back to create a tower, which the developer can use for unique units or shared amenity spaces. The building also includes two distinct cores due to the combination of two separate properties. The varied locations of the stair and elevator cores create challenges in unit planning and reduce the overall efficiency of the floor plate (Figure 16). The floor plate size and core-to-window depth are slightly larger than ideal, leading to deeper units where the developer can introduce dens or home offices. The façade, with punched windows on all sides, provides excellent access to views and daylight. The ground floor is expected to convert into retail space, with some areas dedicated to a residential lobby, amenities, and service spaces.
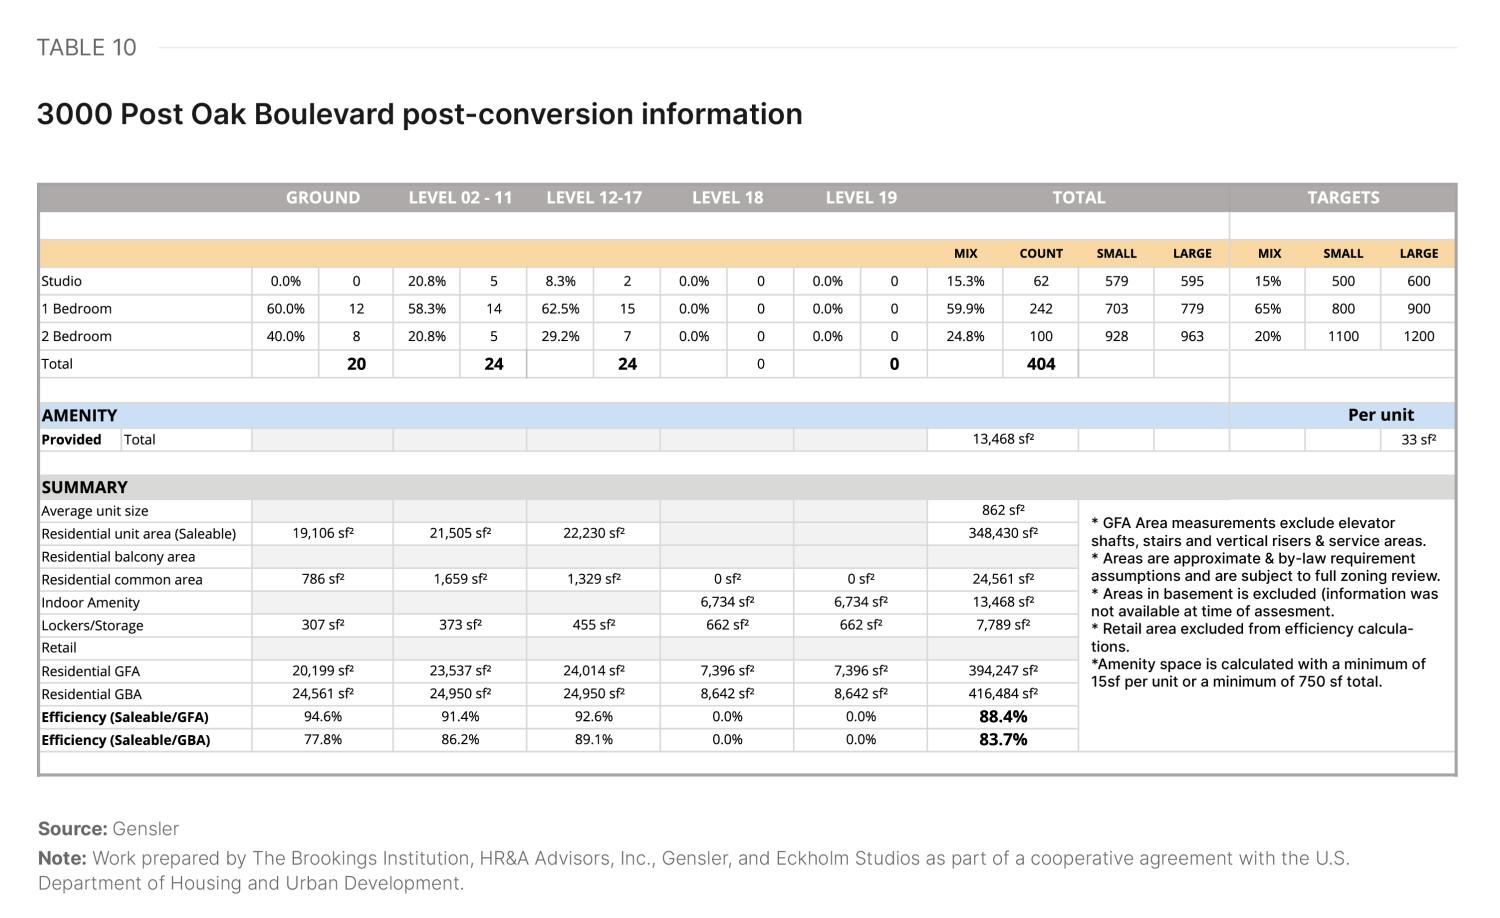
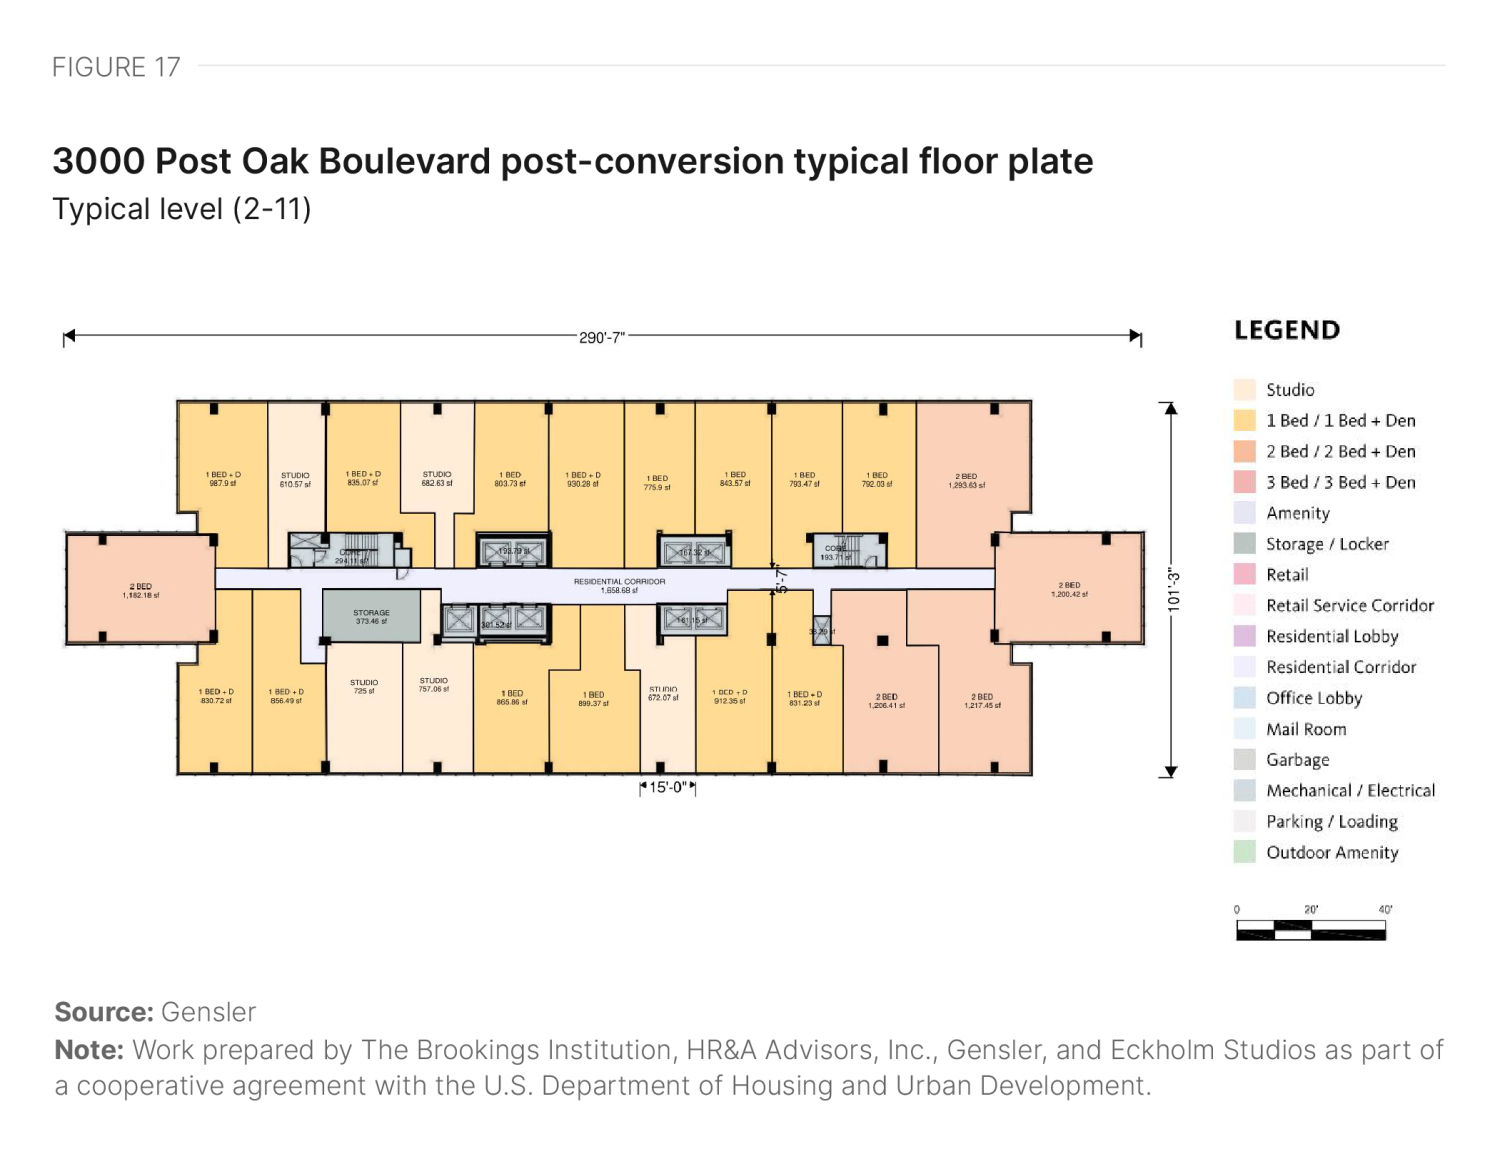
3000 Post Oak Boulevard
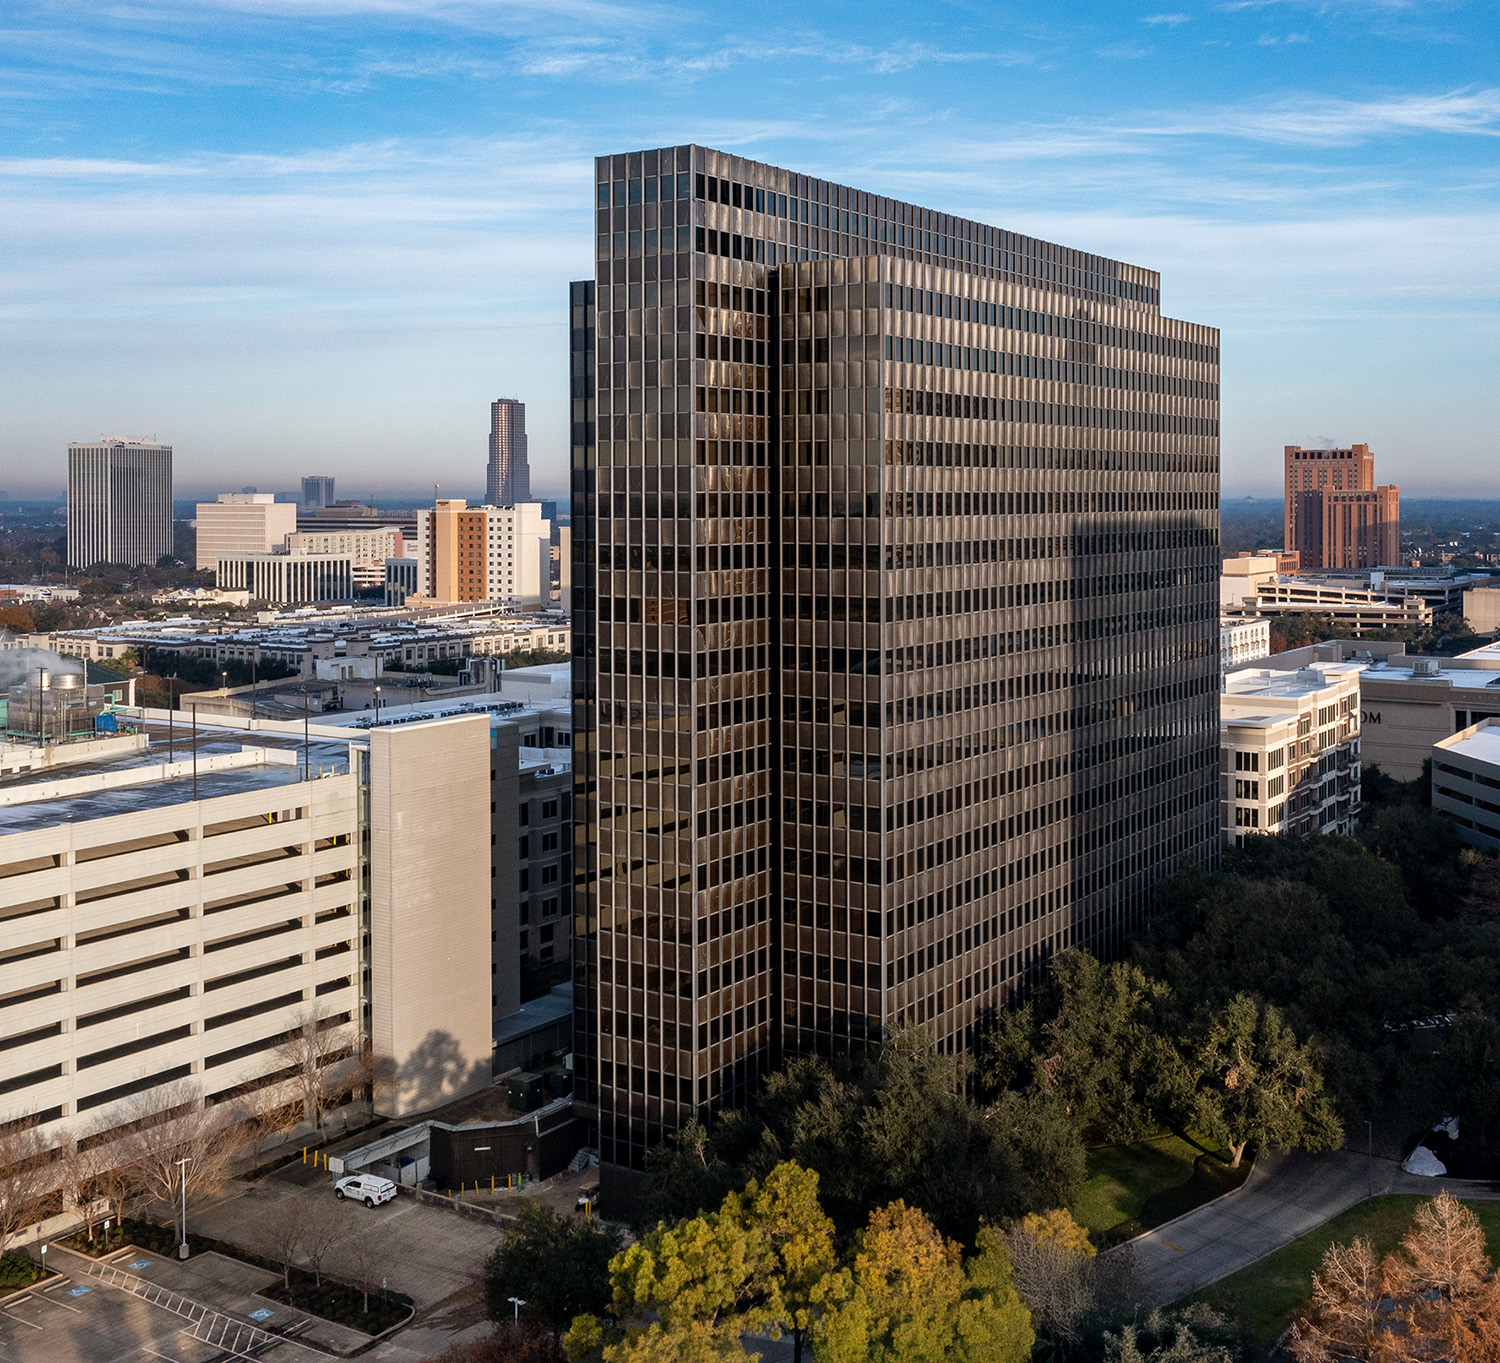
3000 Post Oak Blvd. sits in the southwest area of Houston on Transco 2 Drive. Built in 1979, it is a 19-story structure with a gross area of 416,484 square feet (Table 10).
The building features an elongated rectangular floor plate, with the middle third extended at both ends, and a centrally located core. Although the floor plate size is slightly larger than ideal, the core-to-window depth is close to ideal, resulting in reasonable floor plate efficiency (Figure 17). In areas with deeper space within the units, the developer can introduce dens or home offices. The curtain wall façade offers excellent access to views and daylight, but developers may need to add operable sections if they retain it. The ground floor is expected to convert to residential use, featuring garden-style units.
Future outlook
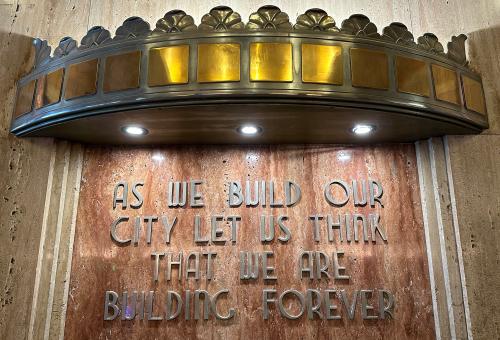
In the entrance lobby of Houston’s City Hall, a paraphrased quote from the 19th century English writer John Ruskin is illuminated in Art Deco-style letters on the wall: “As we build our city let us think that we are building forever.” In his 1849 essay, Ruskin was writing about the layers of meaning that pieces of a built environment enduring over generations can accumulate. He continued, “Let it not be for present delight, nor for present use alone.” And indeed, the Sun Belt city of Houston has—and will continue to be—adaptively reused over generations of growth.
Ruskin’s thoughts about the accrual of meaning over time also (if inadvertently) suggest Houston’s role as the historic capital of fossil fuel production. Today, the former home of the Petroleum Club of Houston stands empty atop the two penthouse floors of the fully vacant former ExxonMobil office tower at 800 Bell St., where there are now shrubs and tree sprouts starting to grow out of the awnings. Already struggling prior to the pandemic, unique visits to downtown Houston are still down 12% from their 2019 level, even though visits to the city as a whole are up 3%. Using cell phone location tracking data, Table 11 presents estimates of the number of unique visitors on a typical Thursday downtown and citywide in fall 2019 and 2023.
|
Winston-Salem |
St. Louis |
Pittsburgh |
Houston |
Los Angeles |
Stamford |
|
|---|---|---|---|---|---|---|
|
Citywide |
||||||
| Fall 2019 | 972,648 | 1,139,210 | 1,042,281 | 10,416,616 | 13,082,015 | 427,544 |
| Fall 2023 | 1,083,344 | 1,224,894 | 1,269,712 | 10,732,698 | 13,265,515 | 523,890 |
| Percent Change | 11% | 8% | 22% | 3% | 1% | 23% |
|
Downtown |
||||||
| Fall 2019 | 46,014 | 119,880 | 120,850 | 275,304 | 793,111 | 102,939 |
| Fall 2023 | 45,570 | 113,112 | 106,773 | 242,267 | 747,974 | 124,271 |
| Percent Change | -1% | -6% | -12% | -12% | -6% | 21% |
Source: Replica Data
Note: Work prepared by The Brookings Institution, HR&A Advisors, Inc., Gensler, and Eckholm Studios as part of a cooperative agreement with the U.S. Department of Housing and Urban Development.
This isn't working for us to be a single use, single industry place. We need to be thinking more broadly about how to build a sustainable downtown.
A Houston stakeholder
The city’s fiscal picture remains dire. City leaders are now contemplating revising the property tax revenue growth cap, using an allowed exception in the case of a natural disaster. Given that the city was devastated by nearly back-to-back storms in 2024 (the May derecho and Hurricane Beryl in July), there are certainly costly disasters to point to. However, whatever spending justification there is for raising the cap, it would also be useful to build more consensus and a shared set of facts around the policies and management incentives that created the pre-pandemic deficit.
The cap was implemented as a mechanism to enforce fiscal discipline around public spending in Houston. However, it also removes any incentive to facilitate infill growth. The cap restriction means that revenue generated from strengthening the existing tax base cannot be reinvested in any unmet community needs, but instead must be returned to property owners. A more flexible policy approach could incentivize both efficient development and spending while allowing the city to pay first responders and invest in resilience. Just as Houston once grew from extracting oil from the ground, the future of Houston lies in once again unlocking value in existing land.
Office-to-residential conversion case studies


Authors
Authors listed in alphabetical order


-
Acknowledgements and disclosures
This research was supported by the U.S. Department of Housing and Urban Development under a cooperative agreement.
The authors thank Hanna Love for her review of this piece.
The authors also thank the following contributors for their invaluable assistance on this project:
Brookings:
- Mary Elizabeth Campbell – Research Assistant
HR&A:
- Clark Ricciardelli – Analyst
- Joe Speer – Analyst
- Paul Silvern – Partner
Gensler:
- Diksha Jain – Architect
- Ingmar Buchner – Designer
- Lisa Matthews – Intern
- Nancy Yeh – Designer
- Jose Segura – Architect
Turner Construction:
- Reinaldo Rodriguez
All remaining errors and omissions are those of the authors.
The work that provided the basis for this publication was supported by funding under an award with the U.S. Department of Housing and Urban Development. The substance and findings of the work are dedicated to the public. The author and publisher are solely responsible for the accuracy of the statements and interpretations contained in this publication. Such interpretations do not necessarily reflect the views of the Government.
-
Footnotes
- Brookings analysis of American Community Survey 2022 5-Year Estimates.
- HR&A analysis of CoStar real estate market data from 2010 to Q3 2024.
- HR&A analysis of CoStar real estate market data from 2014 to Q3 2024.
- HR&A analysis of CoStar real estate market data for Q3 2024.
- HR&A analysis of CoStar real estate market data from 2014 to Q3 2024.
- HR&A analysis of CoStar real estate market data for Q3 2024.
- Area median income (AMI) is a key metric used in assessing housing affordability. It is defined as the median (midpoint) of a specific geography’s income distribution (such as a metropolitan area) for different household sizes. It is calculated each year by the U.S. Department of Housing and Urban Development (HUD). According to HUD, households should pay no more than 30% of their gross income on housing, and households that pay more than 30% are considered “housing cost burdened.” HR&A’s analysis of the percentage of units by AMI category in a market begins by establishing “affordable rent levels” that are equivalent to 30% of income at AMI for different household sizes; e.g., for a one-person household in an area with an AMI of $X, the “affordable monthly rent level” would be ($X * 30%) / 12. With those rent levels established, the analysis compares unit rent levels to AMI levels at the household sizes that correspond to the number of bedrooms in a unit; e.g., a one-bedroom unit’s rent is compared against 30% of the AMI of a one-person household, and so on.
- HR&A analysis of CoStar real estate market data for Q3 2024.
- HR&A analysis of CoStar real estate market data from 2014 to Q3 2024.
- Brookings analysis of American Community Survey 2022 5-Year Estimates.
- Brookings analysis of American Community Survey 2022 5-Year Estimates.
- Hotels rely on valet parking, whereas residents in Houston typically expect personal and exclusive parking spaces, making hotel conversion projects more economically viable.
- Based on authors’ interviews with local stakeholders and HR&A analysis of CoStar real estate market data for Q3 2024.
- Based on interviews with local stakeholders.
The Brookings Institution is committed to quality, independence, and impact.
We are supported by a diverse array of funders. In line with our values and policies, each Brookings publication represents the sole views of its author(s).