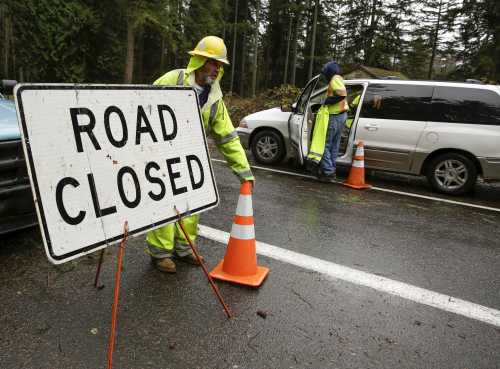
Across America, infrastructure concerns are all too familiar. Whether it’s roads and transit systems struggling to provide convenient, reliable access or water pipes and plants struggling to provide clean, affordable service, our infrastructure is often failing to deliver. Several factors have led to our current predicament: much of our infrastructure is aging and at the end of its useful life; many of our traditional plans and metrics are insufficient to address new demands; and a rise in severe environmental shocks has not helped either.
These infrastructure challenges have given way to a growing consensus among politicians, financiers, and the general public that investing more in infrastructure is a good idea. Economists tend to be more specific, with particular emphasis on the economic returns from maintenance spending.
As the country debates the next great wave of infrastructure investment, it’s important to take stock of spending patterns from the recent past. It’s especially important since the country is now a decade beyond the onset of the Great Recession, which both battered state and local finances while also inspiring a one-time infrastructure stimulus through the federal American Recovery and Reinvestment Act (ARRA).
The most recent Congressional Budget Office data, which track public spending on transportation and water infrastructure through 2017, confirm the country’s investments are sending mixed signals. On the positive side, spending on operation and maintenance is up—recognizing the need to bring the country’s infrastructure systems up to a state of good repair. But overall spending is down, revealing a disconnect between what many federal, state, and local leaders want and what the public sector is actually executing.
The following five findings delve deeper into these spending changes, revealing the difficult balancing act the U.S. faces to not only maintain its infrastructure, but to reliably upgrade it as part of a coordinated, long-term approach.
1. From 2007 to 2017, total public spending on infrastructure fell by $9.9 billion in real terms
While federal, state, and local governments have spent nominally more on infrastructure in recent years, the rising cost of materials has reduced their real spending power. As a result, real infrastructure spending nationally has fallen over the past decade, from $450.4 billion in 2007 to $440.5 billion in 2017. Although there was a surge in real spending in 2009 and 2010 following ARRA, this bump was short lived, and spending levels have increased only marginally over the last five years—even as many states and localities have improved their fiscal health since the Great Recession.

The same proves true when examining infrastructure spending as a share of economic output, a commonly-used measure when comparing spending over time and across different countries. U.S. infrastructure spending has hovered around 2.5 percent of GDP over the last few decades, and this share fell to 2.3 percent in 2017. In other words, even as the economy expands, our infrastructure spending is not keeping up.
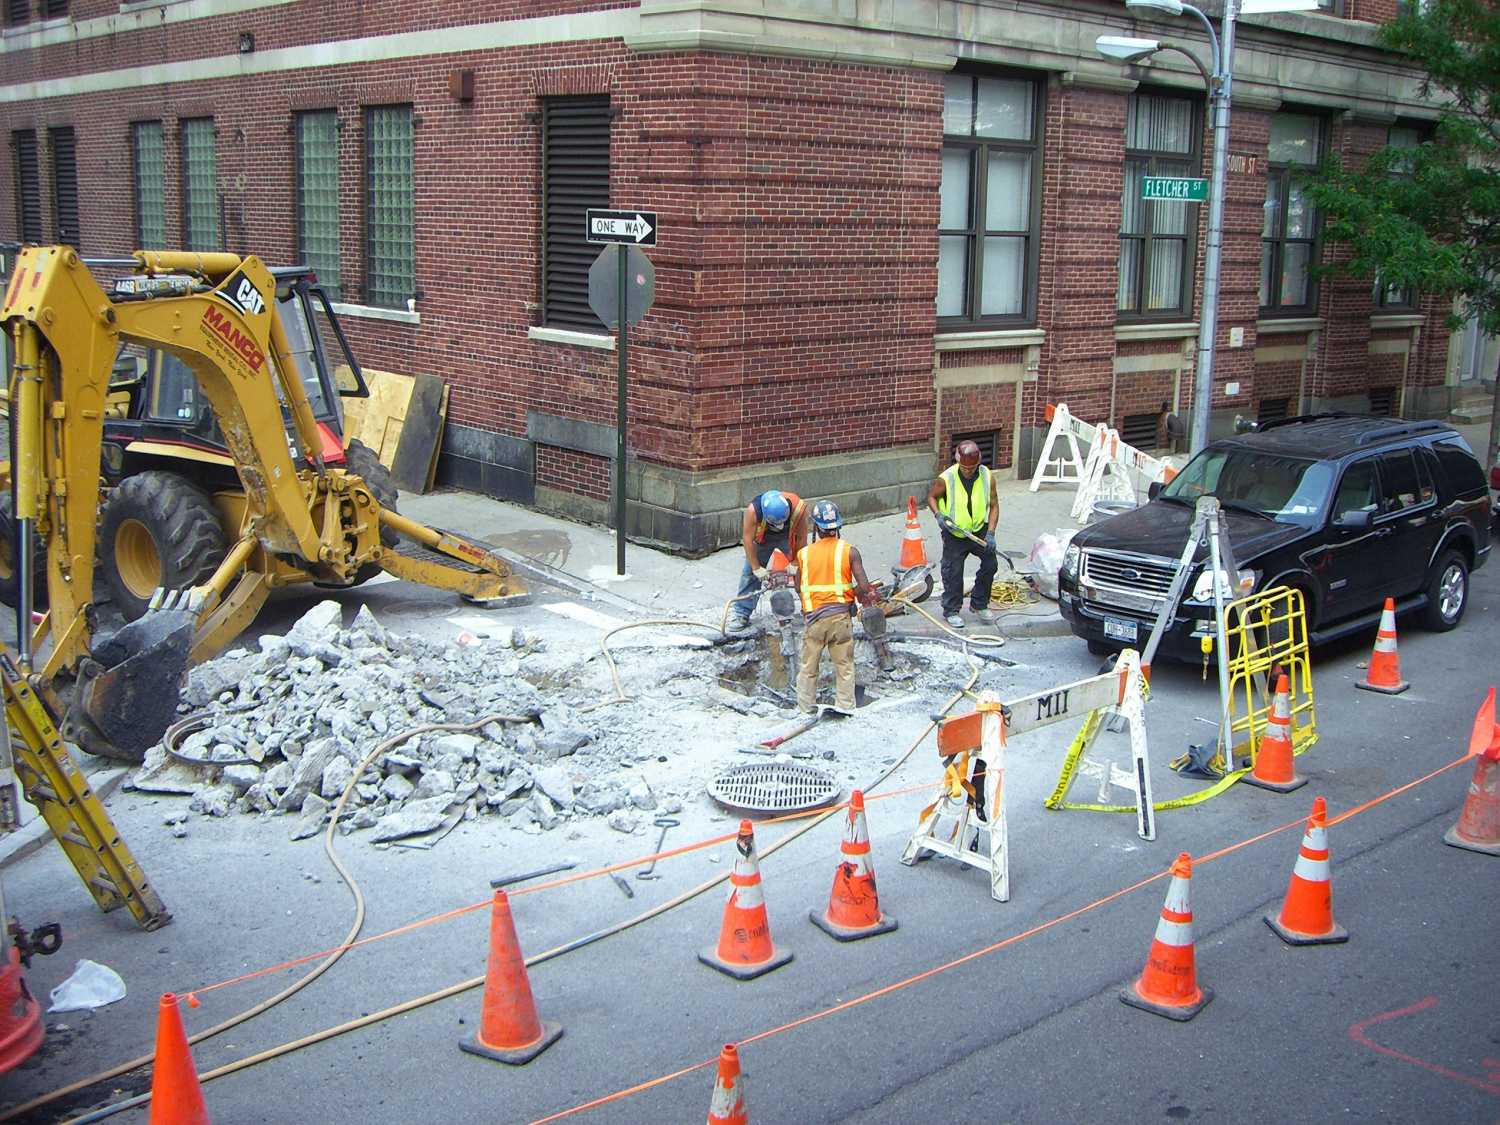
2. Although total public spending fell over the past decade, spending on infrastructure operation and maintenance rose by $23.2 billion (9.5 percent)
The decline in real infrastructure spending masks a more significant trend unfolding across the country: increased spending on infrastructure operation and maintenance along with decreased spending on capital projects. Put another way, the U.S. is spending much more money to make sure our existing infrastructure systems are functioning properly and much less on building out new systems or carrying out other significant upgrades.
Since 2007, real spending on operation and maintenance jumped from $243.3 billion to $266.5 billion. Meanwhile, real spending on capital projects plummeted 16 percent, from $207.1 billion to $174.0 billion. These trends have persisted well after the Great Recession too, with continued increases in operation and maintenance spending since 2012 and continued decreases in capital spending over the same timeframe. The financial pressure many regions have faced in recent years have likely contributed to these capital shortfalls, including those with lagging economies and dwindling populations.

In turn, operation and maintenance now accounts for 60.5 percent of all U.S. public infrastructure spending, compared to 54.0 percent only a decade ago. Capital spending, on the other hand, is now down to 39.5 percent from 46.0 percent. While the shift toward greater spending on operation and maintenance and lower spending on capital projects has been slowly underway since the 1950s, the last decade marked an intensification of the trend.

3. State and local spending declined over the past decade, but it continues to account for more than three-quarters of all U.S. infrastructure spending, driven largely by operation and maintenance
While the federal government’s infrastructure spending often gains the most headlines, states and localities have long been in the driver’s seat—including owning over 90 percent of all non-defense public infrastructure assets. Even though their real spending declined from $349.3 billion in 2007 to $342.1 billion in 2017, they account for 77.7 percent of U.S. public infrastructure spending. In contrast, the federal government saw its real spending fall from $101.1 billion to $98.4 billion over the same period and accounts for just 23.3 percent of U.S. public infrastructure spending.
Despite this overall decline in spending, what’s most notable is how states and localities increased their operation and maintenance spending by $23.9 billion (+11.1 percent) and decreased their capital spending by $31.1 billion (-23.3 percent) over the last decade. State and local’s aggregate response since the Great Recession is to intensify investment in their infrastructure systems’ state of good repair.
The emphasis on maintenance isn’t too surprising given the fact that most transit agencies, water utilities, and other local units are the primary owners and operators of our infrastructure. However, the enormous fall in capital spending shows how much these local entities are struggling to carry out new projects or bigger upgrades, even in a favorable borrowing environment. Beyond ARRA, the federal government has pulled back spending on operation and maintenance as well as capital projects.

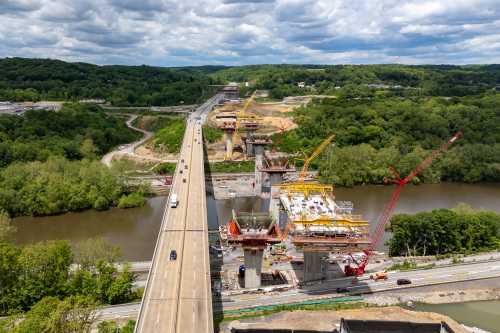
4. U.S. spending on transportation infrastructure is down $4.2 billion (1.4 percent) since 2007, but has shown signs of a rebound in the past five years
Spending on transportation—including highways, mass transit, rail, aviation, and water transportation—continues to account for the biggest share (67.8 percent) of all U.S. public infrastructure spending and dropped from $303.0 billion in 2007 to $298.8 billion in 2017. A decline in highway spending explains most of this drop, particularly new capital projects.
Interestingly, however, real spending on transportation has increased more recently. Following a steep decline (-$13.2 billion) immediately after the Great Recession from 2007 to 2012, spending has jumped $9.0 billion, or 3.1 percent, from 2012 to 2017. States and localities have been entirely responsible for this increase, seeing a particular surge in operation and maintenance spending (and even capital projects) for mass transit. This could partially be due to the wave of ballot referenda and other transit efforts that have emerged in recent years, as many places have also regained their fiscal footing. Other financial data from the Bureau of Transportation Statistics show similar increases in state and local expenditures in transit.

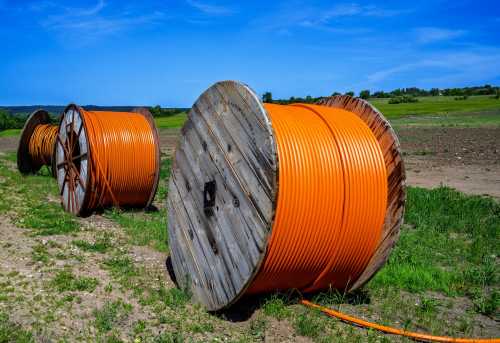
5. U.S. spending on water infrastructure saw a sharper decline, falling $5.6 billion (3.8 percent) since 2007, with a precipitous drop in capital spending
The other major category of public infrastructure, water infrastructure, has also seen a drop in spending over the past decade. Spending on drinking water, wastewater, and other water resources like lakes and reservoirs makes up the remaining 32.2 percent of all U.S. infrastructure spending. Yet, despite its smaller share compared to transportation, real spending on water infrastructure fell more, from $147.4 billion in 2007 to $141.7 billion in 2017. And although spending on water operation and maintenance increased $11.3 billion over this same period, a huge drop in capital spending (-$16.9 billion) explains the overall declines seen nationally.
State and local governments, not surprisingly, were almost entirely responsible for these spending changes; most water infrastructure management, after all, takes place locally. Local water utilities, in particular, have struggled to keep up with pursuing needed capital projects alongside rising maintenance needs. The federal government has not helped much either, despite a slight bump in water spending following ARRA.

The U.S. needs to strike a better balance spending on current and future infrastructure needs
Together, these five trends illustrate how the U.S. is spending less on infrastructure, but the story does not end there. As the country enters an age where infrastructure maintenance needs are growing, and spending has largely risen to meet those maintenance demands (especially at a state and local level), there has been a significant drop in capital spending. Not all places, clearly, have the capacity to pursue new projects or major upgrades. And the federal government, with the exception of a major stimulus package like ARRA from nearly a decade ago, has generally not filled this gap either.
As policymakers debate what infrastructure projects to support, how to pay for them, and where the money is even going to come from, conversations should not always start with new or additional spending. Rather, it’s crucial to acknowledge how the U.S. is in an era of repair and replacement, which is influencing many of our future plans and investments. There is a need to not only better articulate the federal role in infrastructure investment, but to also rethink how state and local leaders can partner more effectively with one another and be more intentional in their future investments—in light of changing fiscal conditions, evolving system demands, and other developments over time.
Ultimately, policymakers at the national, state, and local levels need to develop more flexible, durable platforms by which they can keep up with ongoing maintenance needs and longer-term capital needs. Addressing issues around local fiscal capacity, experimenting with new financial tools, and incorporating more efficient designs and technologies offer a start to solving some of these infrastructure challenges. The reality is that the investment needs are likely to grow over time, and simply spending more is not going to be a solution in itself: We need a new economic vision in our new infrastructure age.
Related Content
Authors

The Brookings Institution is committed to quality, independence, and impact.
We are supported by a diverse array of funders. In line with our values and policies, each Brookings publication represents the sole views of its author(s).