Why are taxpayers asked to subsidize postsecondary education? After all, college graduates continue to earn much more on average than those who do not gain a postsecondary degree. One answer is that higher education provides public benefits in addition to high private returns on postsecondary investments.
In particular, universities act as ladders for social mobility, which makes for a more dynamic and fairer society. They are also laboratories for research, expanding our knowledge in directions that can improve the welfare of the broader population. A good case can be made for public support for institutions that act in one or both of these ways: as what we label either ladders or labs. But there are some institutions that cannot claim to be either mobility-boosters or knowledge-creators: these are the laggards. These institutions have a weaker claim on the public purse.
In this paper, we evaluate the nation’s selective public four-year universities—using newly-available tax data from the Equality of Opportunity Project at Stanford to gauge mobility and an independent ranking from the Carnegie Foundation to assess research activity—to determine which universities are ladders or labs, and which universities are laggards less deserving of public funding.
While many of these institutions perform well as a ladder or a lab—and a significant share score well on both fronts—a sizable minority of public universities fail on both counts. These laggards nonetheless absorb substantial subsidies, including to students from affluent backgrounds. We estimate that almost $2 billion of support goes each year to students from families in the top quintile of the income distribution who attend “laggard” colleges. To put this figure in context, this amount is five times as much as the federal government currently spends on evidence-based Home Visiting programs for low-income families.
Director’s Law and U.S. colleges
Four decades ago, Milton Friedman and George Stigler popularized what they termed “Director’s Law.” Named for law professor Aaron Director (Friedman’s brother-in-law), their law predicts that government programs by and large favor the politically powerful middle class, not the poor. Perhaps this is an overstatement, but it captures a good deal of truth. We would propose a slight modification of the law: much of the most egregious rent-seeking in our public policy comes not from the middle class, but the upper middle class. (To learn more, check out the newly released book Dream Hoarders.) As it happens, the very first example of Director’s Law proposed by Stigler, in a 1970 article, was public higher education. At the time, American public universities were dominated by students from the upper and middle classes. Stigler therefore plausibly conjectured that the public provision of higher education represented a substantial subsidy for the relatively affluent at the expense of the poor and the rich.
In this paper, we ask whether this is still true today. Focusing on selective, four-year public universities, we argue that:
- The upper-middle class is substantially over-represented in American public universities;
- Public investment in higher education too often fails to produce either social mobility or socially beneficial research; and
- The significant public subsidies spent on the education of the relatively affluent could be better spent elsewhere.
The upper middle class still dominate public universities
In this paper we concentrate on a particular set of institutions: selective, four-year public universities. Private institutions are left out of our analysis since these are free to have their own specific institutional admissions and are not, in general, recipients of direct state subsidy (though the students attending may well be). Nor do we include those public universities with very specific missions: historically black colleges and universities, public liberal arts colleges, and military-oriented institutions.1 These institutions could claim that they bring broader social benefits beyond mobility or research. Such claims could certainly be contested, but in order to keep our analysis as straightforward as possible, we have elected to simply leave them out.
Our focus, then, is on the nation’s 342 selective, four-year, non-mission-oriented public universities.
Almost a third of all students enrolled in these universities come from households in the top quintile of the income distribution, and just 8 percent come from families in the bottom quintile. Two in three of these schools (65 percent) have more students from the top quintile than the bottom 40 percent. Over 30 percent have more students from the top quintile than the bottom 60 percent.

College students are supported by the government both through subsidized loans and grants, and through direct subsidies to institutions. Jason Delisle and Kim Dancy have conducted a careful analysis of the direct public subsidies, summarized in an Evidence Speaks report last summer. Combining data from the National Postsecondary Student Aid Study and the Integrated Postsecondary Education Data System, they estimate average per-student subsidies at public universities by school type and student income background. Their analytical approach shows that students at selective public colleges who come from top-quintile families receive an average net subsidy of $6,368 per year. This means that altogether, more than $13 billion each year goes towards subsidies for affluent students at selective public universities. That figure is an underestimate of total spending on this group, since it does not include subsidized loans or grants and merit aid provided by third parties (the state and federal government, for example).
These subsidies may be a good investment. Universities bring many benefits; they can provide an education for citizenship in a democratic society, impart the wisdom of the liberal arts, and teach young men and women the job skills needed for an increasingly specialized labor market. Here, however, we restrict our focus to the two most celebrated purposes of the American public university system: serving as engines of social mobility and producing world-class research.
Ladders: Which colleges promote social mobility?
Recent research from Raj Chetty, John Friedman, Emmanuel Saez, Nicholas Turner, and Danny Yagan shows that universities vary greatly in terms of facilitating intergenerational mobility. Using administrative tax data for 30 million students, they establish a dataset of “Mobility Report Cards” for thousands of colleges. Some schools—the California State system and the City University of New York, for example—are successful at attracting low-income students, and pushing them up the income ladder after they graduate. But many universities are dominated by relatively affluent students and do little to boost mobility for the few disadvantaged students they do enroll.
Following Chetty et al., we define mobility rates here as the result of “access” (i.e., the share of students from the bottom quintile) and “success” (i.e., the likelihood of a student from the bottom quintile reaching the top quintile). There is nothing magic about this particular measure. Other measures can be created using the same dataset. But it is a clear, straightforward metric that can readily be used to compare universities.
It must also be added here that, following Chetty et al., we make no claims about causality or the social mobility “value added” of particular universities. The Mobility Report Card data represents a substantial contribution to our understanding of the landscape of higher education. But the data does not definitively answer the question of which universities are causally responsible for high or low rates of mobility. Instead, we are only justified in identifying which schools are associated with more or less opportunity.
We categorize the 342 colleges in our sample as “high” or “low” in terms of social mobility, based simply on whether they fall in the top or bottom half of all selective four-year universities in the country in terms of their mobility score. Of the 342 public selective universities in our sample, we categorize 59 percent as high-mobility institutions, and 41 percent as low-mobility institutions.2
Labs: Which colleges promote knowledge?
Colleges not only promote upward mobility, but they also produce valuable knowledge. To the extent that the benefits of this research flows to society in general, there is a case for public subsidy. We therefore examine the research contribution of the 342 colleges, drawing on the 2015 edition of the “Carnegie Classification of Institutions of Higher Education.” A widely used classification system, the Carnegie system draws on data from the National Science Foundation and the Integrated Postsecondary Education Data System. All four-year universities are placed in a particular category, including some for research. In descending order, research universities are divided into R1, R2, and R3 categories.3 The Carnegie indices combine the number of doctorates granted, aggregate research expenditures, and per capita research expenditures.
We define “high” research universities as those in the R1 or R2 category, and “low” as those in R3 or with no research ranking at all.4 Among our 342 colleges, 127 (37 percent) count as high-research institutions, or Labs, while 215 (63 percent) count as low-research institutions.
Labs, ladders, and laggards
Next, we combine the two rankings for mobility and research for the colleges in our sample. One difficulty here is that the two datasets we use do not map perfectly onto one another. The Carnegie classification system reports separately on each campus, while the Chetty Mobility Report Cards data merges some public institutions under one heading. For example, Chetty et al. report a single observation for the “University of Maryland System (Except University College) and Baltimore City Community College.” The Carnegie classifications break that group into a half dozen observations for the separate institutions. In these cases, we apply the highest research level of any of the constituent colleges to the whole group. The UMD system as reported by Chetty et al., for example, is coded as an R1, even though it includes R2, R3, and non-research institutions.5
Combining the two datasets allows us to estimate the share of America’s selective, public, four-year universities that succeed in promoting opportunity, producing research, both, or neither. Just 20 percent of America’s selective public universities manage to accomplish both objectives—to be both ladders and labs. Twenty-five percent are laggards, failing on both counts:

One might hope that schools with little success in promoting opportunity make up for it with their research output. Unfortunately, there seems to be little negative correlation between research output and success in generating mobility. The majority of low-mobility universities also produce little to no research.
It is troubling that a quarter of selective public universities are laggards, scoring poorly in terms of both producing research and facilitating social mobility, especially given the extensive public subsidies they receive. Nor can these colleges claim that they are serving a representative student body. In fact, the social class background of their students is almost identical to that for the sample as a whole. Almost thirty percent of students at low-mobility, low-research institutions come from the top quintile of earners, while under 7 percent come from families in the bottom fifth of the income distribution:

As shown above, we estimate that students from top-quintile families at these laggard public universities receive almost two billion dollars in annual subsidies. Such expenditures seem almost indefensible. Why should taxpayers pay to send relatively affluent students to public universities that both fail to produce research and fail to facilitate social mobility? There is a strong case that this money could be spent more wisely.
Who are the laggards?
To give an idea of the kind of college that falls into the laggard category, we listed below the ten “non-research” selective public universities ranked with the lowest rates of access6 (i.e. the lowest shares of students from the bottom 20 percent of households):

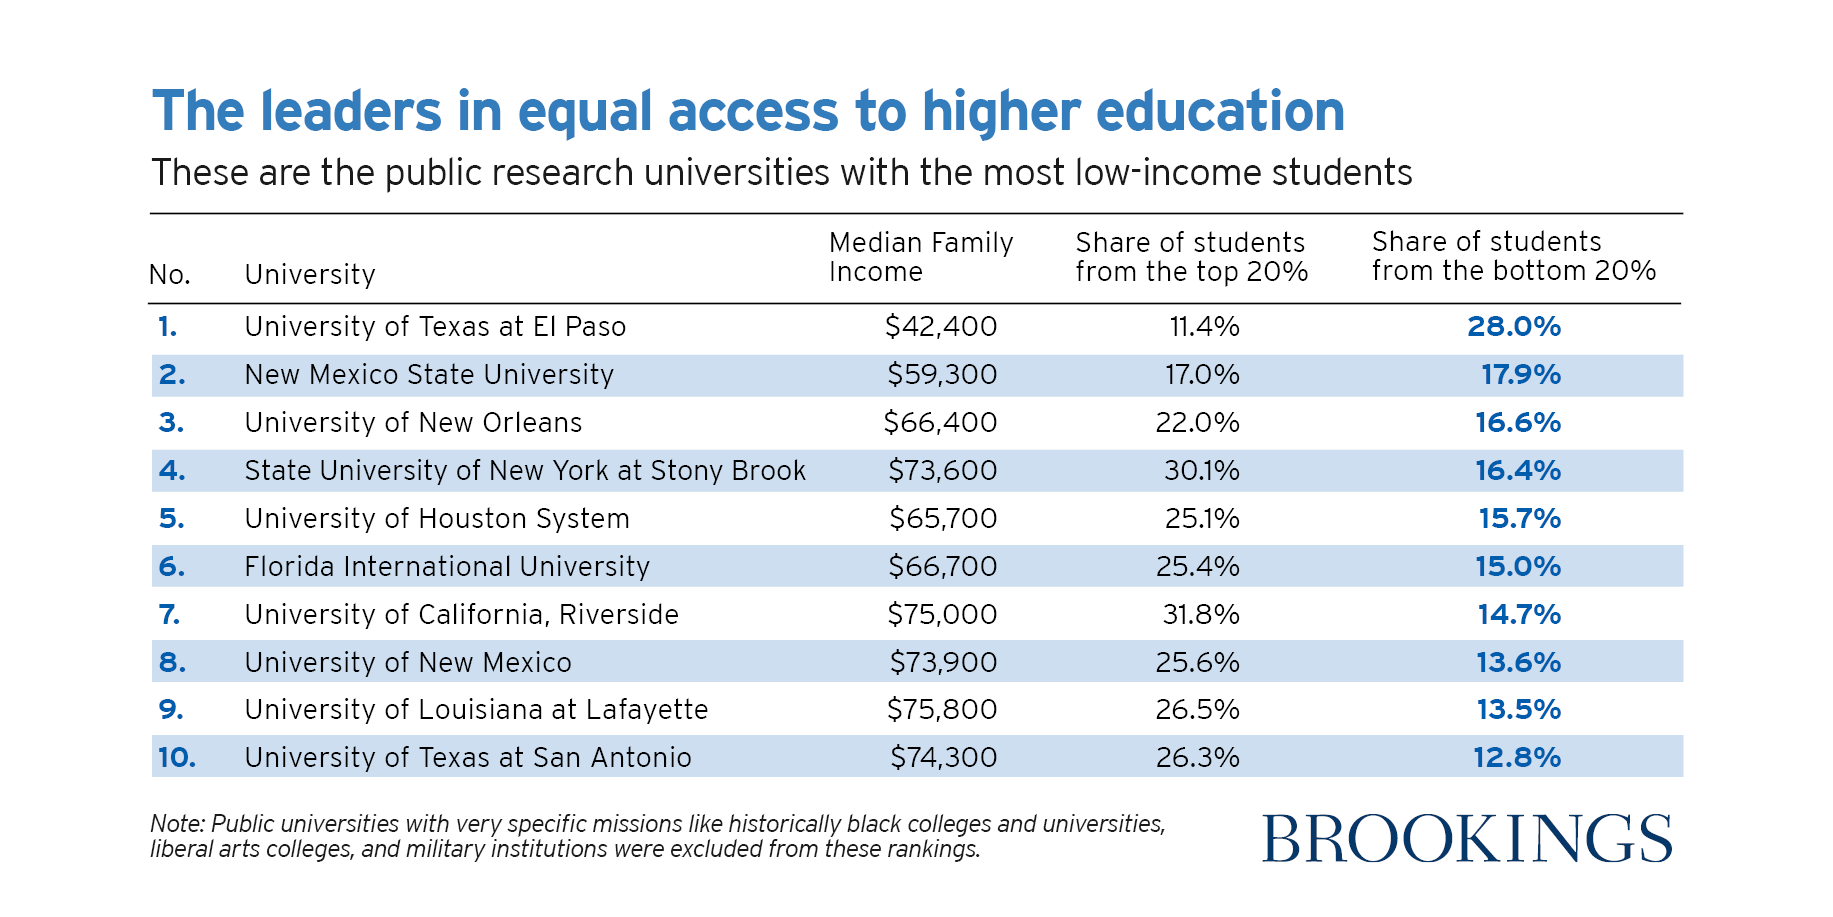
On a more optimistic note, however, many universities do manage to simultaneously produce important research while extending social opportunity to students from underprivileged backgrounds. Below are America’s selective, public, research-generating universities with the highest levels of low-income student enrollment.
Conclusion
A number of researchers have pointed out that schemes to expand public subsidies for higher education overwhelmingly benefit relatively affluent students. But this problem applies to existing subsidies, too. Every penny spent subsidizing an upper-middle-class student could have been spent somewhere else. A more equitable approach, therefore, will need more than increased subsidies. State governments should take a hard look at the universities in their jurisdictions that neither seriously promote opportunity, nor produce much serious research.
Misallocated investment doesn’t just come at a large opportunity cost, however. Public subsidies for the relatively affluent directly reify existing inequalities by reinforcing the opportunity “choke-point” of higher education, driving up demand (and costs), while crowding out other institutional opportunities for social mobility. As Joseph Fishkin observes in his book, Bottlenecks, these investments double down on “the presumption that four-year degrees are the only valid path and that anyone pursuing any other has failed.” A broader approach to higher education reform should emphasize and support alternative paths to upward mobility. A great many community colleges, for example, are success stories that remain forgotten and underappreciated. Similarly, apprenticeships and programs that lead to certification of marketable skill sets may be a valuable way to give disadvantaged students much-needed job skills.
A university education is a wonderful thing. But there are many wonderful things in life, and the government doesn’t need to pay for all of them. That’s especially true for students from the upper middle class, who dominate the current system and enter college with substantial advantages in life already. We are a very long way from the ideal of higher education as the “great equalizer,” with colleges acting as engines of mobility, leveling the playing field for each generation. Rather, public higher education too often provides yet another chance for the upper middle class to engage in opportunity hoarding at the expense of the taxpayer—and even worse, at the expense of students from low-income families.
Curious where a particular university lies in the rankings? Download the data for a quick list.
Authors
-
Footnotes
- For HBCUs, we remove schools using the US News classifications. For public liberal arts colleges, we remove schools that are members of the Council of Public Liberal Arts Colleges. For military-oriented institutions, we remove universities that are primarily military and maritime academies. That means that we remove universities like the Virginia Military Institute, but not public universities that merely have significant ROTC programs.”
- We adjusted this definition of high vs. low mobility in various ways. The most significant attempted to evaluate university mobility rates as they compare with mobility rates in the university’s local commuting zone. Ultimately, that alternative definition did little to alter the underlying distribution of lab, ladder, and laggard universities.
- Our analysis is primarily focused on the distribution of research-oriented, doctorate granting institutions. Among the over 2500 four-year colleges and universities in the classification system, 335 are research institutions. Of those, 115 are R1, 107 are R2, and 113 are R3. Among public universities, 71 are R1, 56 are R2, 29 are R3, and 187 are non-research institutions.
- These research categories are necessarily imperfect. Valuable humanities and social science scholarship, for example, can be produced in smaller universities and liberal arts colleges that are not considered research institutions by the Carnegie classification system.
- Another difficulty is that some of the universities in the Chetty et al. dataset do not have complete mobility data. For example, no cohort-level data is available at the Ohio State University until 1985. This means that the youngest graduates of OSU Chetty et al. can track are just 29 years old. That is too young to be convincingly representative of lifetime income ranks. As a result, Chetty et al. remove some schools from their full analysis. Following their method, we do not rank or classify nine selective, public universities for which we have limited data.
- Consistent with our analysis in this paper, we once again have excluded military institutions, liberal arts colleges, and historically black colleges and universities from these rankings.
The Brookings Institution is committed to quality, independence, and impact.
We are supported by a diverse array of funders. In line with our values and policies, each Brookings publication represents the sole views of its author(s).