Providing information about college outcomes to students and their families as they shop for college is critical (as Brown Center scholars have argued here and here). The availability of information has the potential to aid individual students by helping them to select a college that will best serve them, and to improve the system by allowing market forces to keep prices in line with value. However, these benefits are only generated to the extent that consumers know how to use the information to make good decisions. Financial outcomes such as graduate earnings and employment rates are one important piece of information, but clearly not the only metrics that prospective students should consider.
Graduation rates are often cited as a key measure that students should consider when selecting a college. This is undoubtedly true, but too often this only refers to six-year graduation rates which are only a partial measure of completion patterns. Among the cohort of first-time, full-time students entering four-year degree programs in 2005, 39 percent graduated within four years. And about 60 percent eventually graduated (within six years),[i] which means that about 35 percent of graduates take longer than necessary to complete their degrees.
Extended enrollment is very costly, perhaps more so than most students realize. Although some students take longer to graduate due to breaks in enrollment, others simply spend more time enrolled. With the average net price across all four-year, degree-granting institutions at $20,374 during the 2010-11 academic year, an additional year of enrollment would translate into an extra $234 per month in student loan payments if a student were to finance the cost.[ii] Extending enrollment to six years would mean an additional $469 per month in loan payments compared to if the student had graduated on time.
In addition to the direct costs of extended enrollment, students forgo earnings while they remain in school. Although the actual opportunity costs vary greatly by individual, these costs will generally be even larger than the direct costs of attendance. These statistics highlight that the time it takes to complete a degree, just like earnings and employment outcomes, can have important financial consequences.
The benefits of finishing college on time are clear, but it is less obvious that time-to-degree is a dimension on which students and parents need to pay close attention when shopping for college. One might assume that general metrics of college quality are good proxies for all sorts of outcomes, including time-to-degree. For example, perhaps institutions with good six-year graduation rates also have good four-year graduation rates so it doesn’t really matter which one students use. But it turns out that this is not the case. The average time-to-degree varies widely, even within institutions that seem to be of similar quality based on other measures.
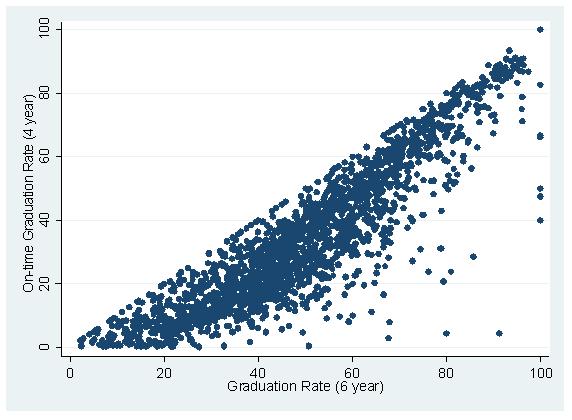
Figure 1 shows the relationship between four- and six-year graduation rates among all four-year, degree-granting institutions eligible for federal student aid. Since the number of students who graduate from an institution after six years is very small, we can think of six-year graduation rates as a decent proxy for the overall graduation rate (which is not observable due to natural data limitations). In this figure it is apparent that the rate of on-time graduation varies immensely even within the set of institutions with similar overall graduation rates. A student choosing among a group of institutions with similar six-year graduation rates ought to know that the chance of graduating on time is likely to vary significantly across those colleges.
Figure 1: Graduation and On-Time Graduation Rates

Source: IPEDS 2011 database.
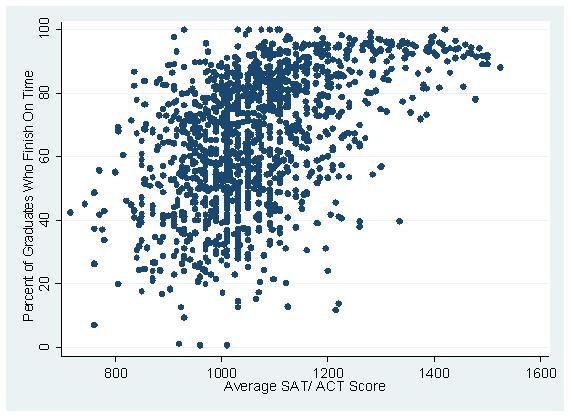
Figure 2 shows the relationship between a second measure of institution quality, average SAT/ACT score, and the share of graduates who finish on time (the ratio of the four-year graduation rate to the six-year graduation rate). Again, it is apparent from this figure that among schools of similar quality, as measured by average SAT/ACT score, the share of graduates who finish on time varies widely. For a 100 point range of SAT score surrounding the mean (1040), the mean rate of on-time graduation was 65 percent. For this set of 485 schools, the percent of graduates who finish on time varies from 49 percent at the 25th percentile to 79 percent at the 75th percentile. This is a surprisingly large range considering the similar SAT/ACT scores of their students. It is not obvious from visual inspection that on-time graduation is positively related to average SAT/ACT score. In other words, students and parents cannot necessarily expect that schools reporting higher average SAT/ACT scores will also produce faster time-to-degree. However, there is less variation in the share of graduates who finish on time among schools that report average SAT/ACT scores near the upper end of the possible range.
Figure 2. Time-to-Degree and Institutional Quality

Source: IPEDS 2011 database.
Since general metrics of institution quality (like average SAT/ACT score and six-year graduation rate) are not a sufficient substitute for the rate of on-time graduation, colleges need to be evaluated on time-to-degree explicitly. Of course student characteristics play an important role in determining a college’s on-time graduation rate, but Institutions also have important effects. A recent working paper by Sarah Cohodes and Josh Goodman reports some of the first rigorous, quasi-experimental evidence that college quality has a substantial impact on the likelihood that a student will graduate, in either four or six years.
In sum, information matters. Specifically, information about a school’s track record for getting students through their programs on time matters. As students and parents shop for college, they should be aware of differences between schools on this dimension. Policy makers should also recognize these differences and prioritize making this measure of quality available to consumers. Publishing information about on-time graduation rates to the public through online tools like the College Scorecard is important. As consumers gain a better understanding of the metrics that are important to them, it will create incentives for schools to help students graduate on time, replacing the previous incentive to keep tuition-paying students as long as possible. Perhaps most importantly, higher rates of on-time graduation will reduce the financial burden of higher education on both individual students and the tax payers who support them through financial aid programs and direct subsidies to institutions.
[i] Administrative data from Ohio indicate that only a very small fraction of students graduate after six years (p. 33 of Bowen, Chingos and McPherson, Crossing the Finish Line: Completing College at America’s Public Universities, Princeton University Press, 2009).
[ii] This calculation is based on a loan with a 6.8% interest rate and a 10-year term.
The Brookings Institution is committed to quality, independence, and impact.
We are supported by a diverse array of funders. In line with our values and policies, each Brookings publication represents the sole views of its author(s).


