The United States is projected to be “majority-minority” by 2044. As evidenced in our Diversity Explosion interactive, as the U.S. population ages it is also becoming much more diverse. Specifically, the share of people of color in the U.S. is 26 percent higher in the 0-19 age group than the 65+ age group. But over the next several decades, some states will change much faster than others. Hawaii and the District of Columbia already have the highest shares of people of color (77 percent and 64 percent, respectively), and given that those shares are already so high, their changes won’t be as drastic as other places. Here are the 10 states that stand out when looking at the difference in share of the people of color aged 19 and younger compared to those aged 65 and older.
10. Rhode Island
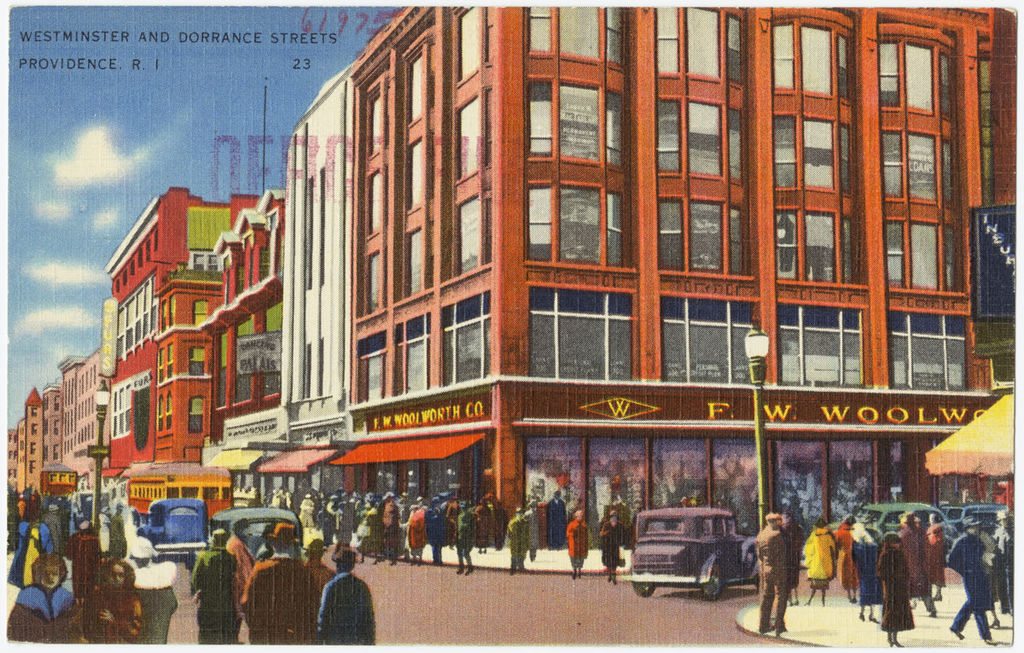
(Westminster and Dorrance Streets, Providence, RI, ca. 1930-45)
Generational diversity gap: 27.70%
Share of people of color 19 and under: 37%
Share of people of color 65 and older: 9%
9. Washington
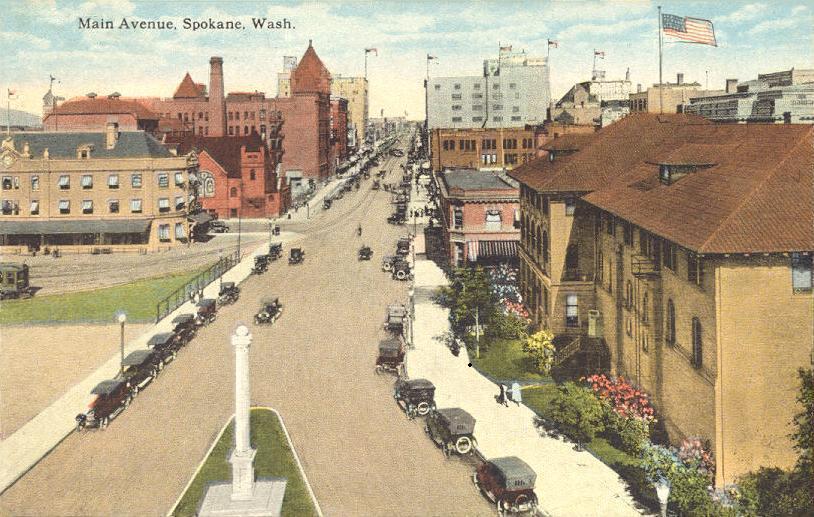
(Main Avenue, Spokane, Washington, ca. 1920)
Generational diversity gap: 27.83%
Share of people of color 19 and under: 41%
Share of people of color 65 and older: 13%
8. Oklahoma
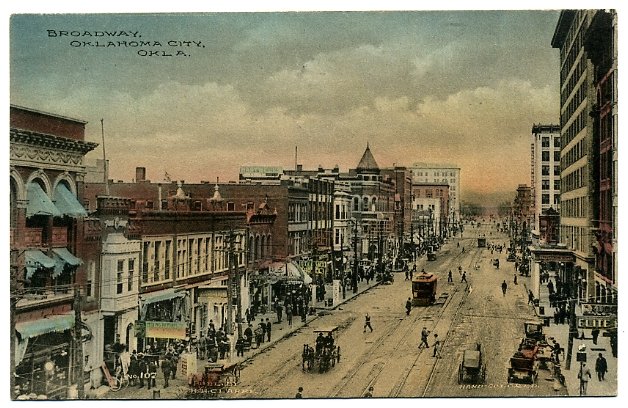
(Broadway in Oklahoma City, Oklahoma, ca. 1910)
Generational diversity gap: 29.33%
Share of people of color 19 and under: 45%
Share of people of color 65 and older: 15%
7. Delaware
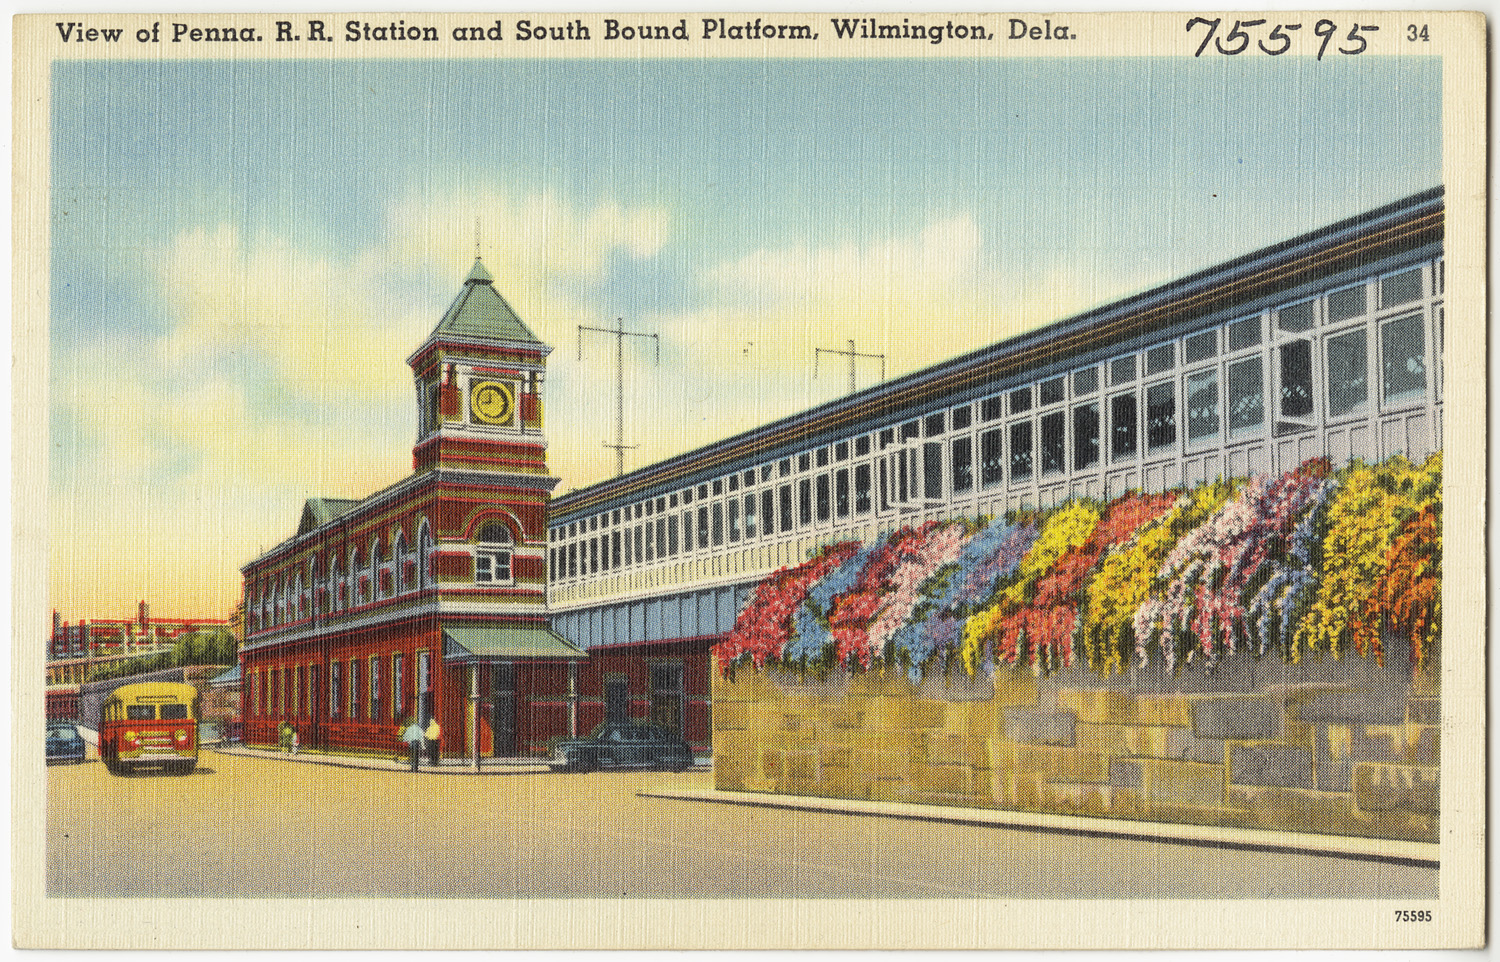
(View of Penna. R. R. Station and south bound platform, Wilmington, Dela., ca. 1930-45)
Generational diversity gap: 29.44%
Share of people of color 19 and under: 48%
Share of people of color 65 and older: 18%
6. Florida
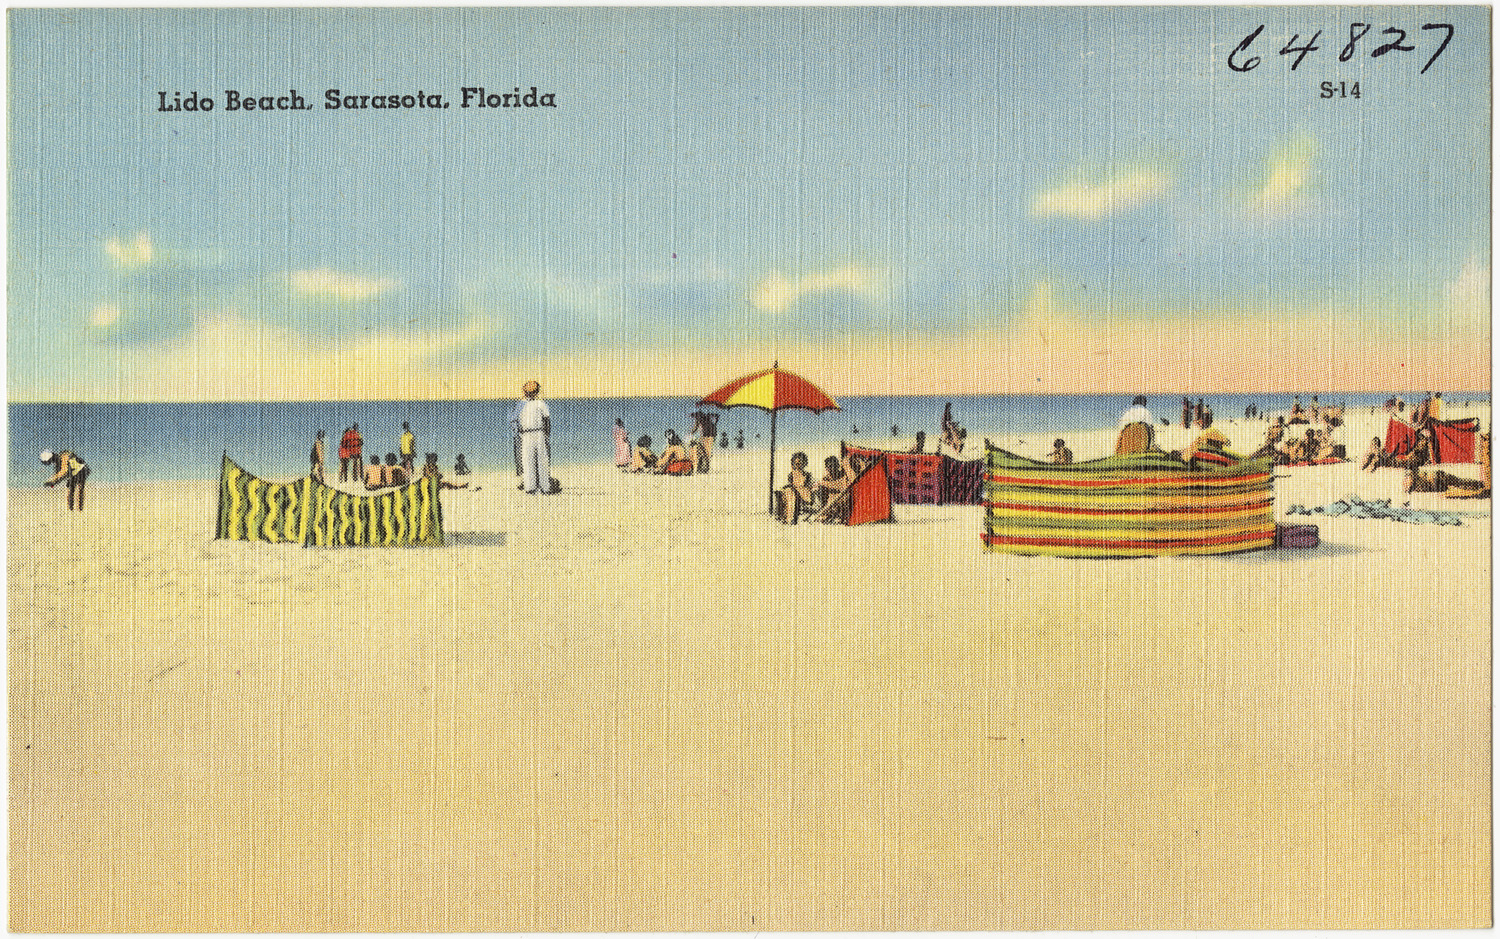
(Lido Beach, Sarasota, Florida Date, ca. 1930-45)
Generational diversity gap: 31.61%
Share of people of color 19 and under: 56%
Share of people of color 65 and older: 24%
5. Texas

(Beach Boulevard and the Seawall from the air, showing Hotel Galvez, Galveston, Texas, no date)
Generational diversity gap: 32.95%
Share of people of color 19 and under: 67%
Share of people of color 65 and older: 34%
4. California
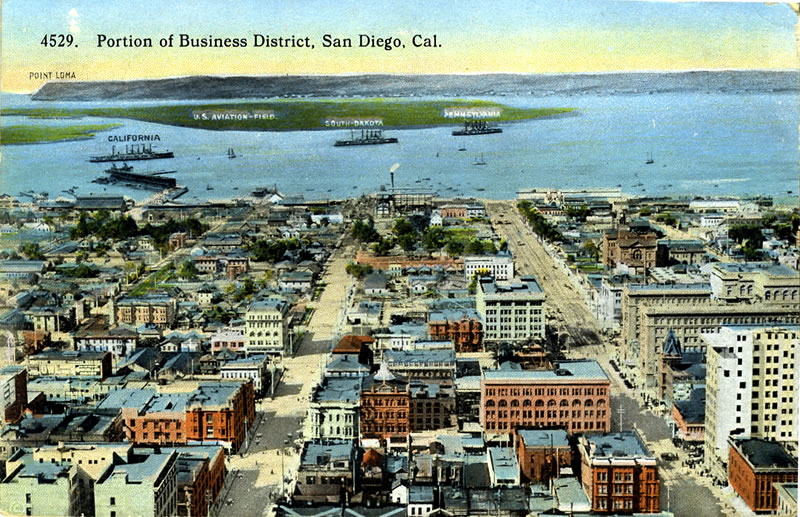
(Portion of business district, San Diego, Cal., no date)
Generational diversity gap: 33.52%
Share of people of color 19 and under: 73%
Share of people of color 65 and older: 40%
3. New Mexico
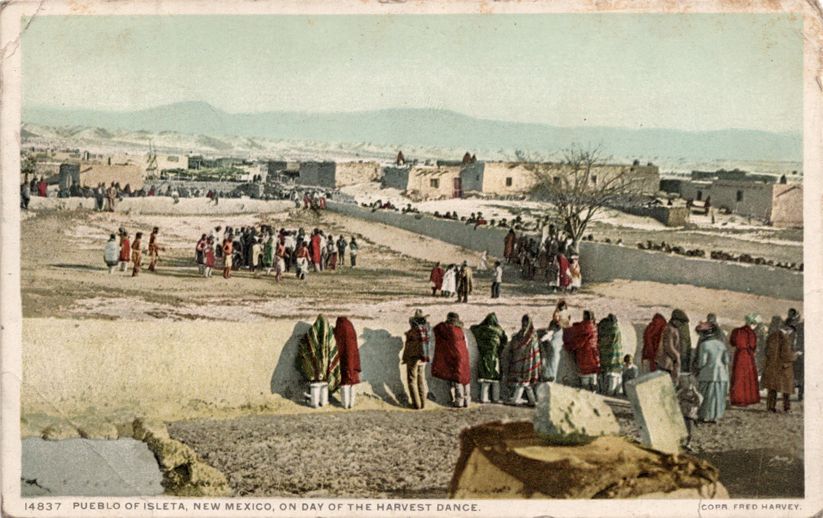
(Pueblo of Isleta, New Mexico, on day of the harvest dance, no date)
Generational diversity gap: 34.51%
Share of people of color 19 and under: 74%
Share of people of color 65 and older: 40%
2. Nevada
(“Howdy, Podner!” Las Vegas, Nevada, 1948)
Generational diversity gap: 36.61%
Share of people of color 19 and under: 62%
Share of people of color 65 and older: 26%
1. Arizona
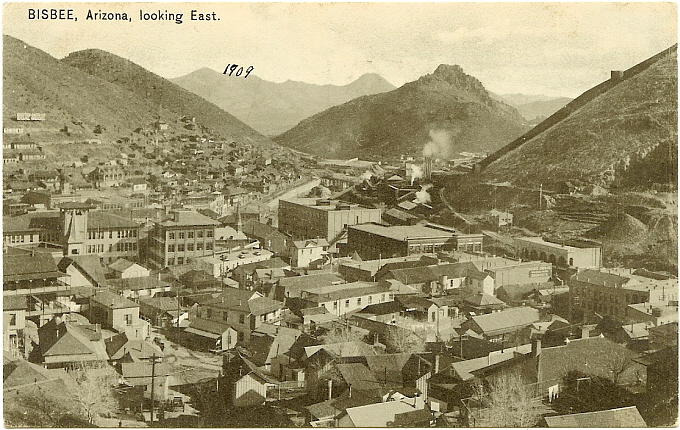
(Aerial view of Bisbee, Arizona, looking east, ca. 1909)
Generational diversity gap: 40.72%
Share of people of color 19 and under: 59%
Share of people of color 65 and older: 18%
For more, check out the Diversity Explosion interactive map that details the nation’s changing diversity at the county and city levels as well as the book, “Diversity Explosion,” by Brookings Senior Fellow William H. Frey.
N.b.: All images were found on Wikimedia Commons.
The Brookings Institution is committed to quality, independence, and impact.
We are supported by a diverse array of funders. In line with our values and policies, each Brookings publication represents the sole views of its author(s).
Commentary
The 10 states diversifying the fastest
February 26, 2015